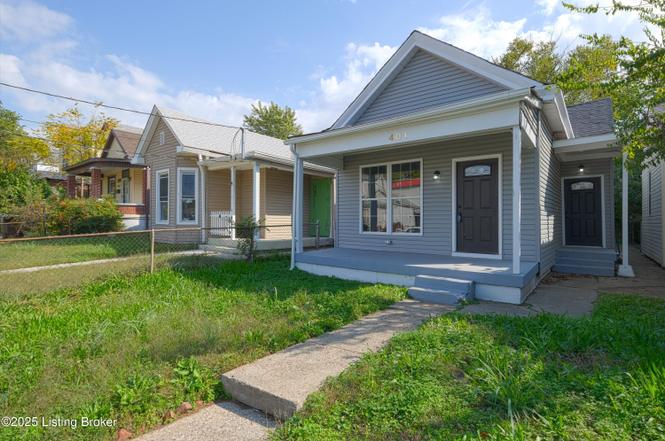
401 N 28th St · Louisville, KY
Flood risk 1/10 · Minimal
- FEMA flood zone
- X (unshaded)
- Chance of flooding over 30 yrs
- 0.0%
- Est. flood insurance / yr
- $473 – $860
Fire risk 1/10 · Minimal
- Est. fire insurance / yr
- $839 – $1,559
Heat risk 5/10 · Moderate
- Hot days now (above 105°F)
- 7 days/yr
- Hot days in 30 yrs
- 20 days/yr
Wind risk 2/10 · Minimal
- Chance of severe wind over 30 yrs
- 1.0%
Air-quality risk 2/10 · Minimal
- Unhealthy air days now
- 1 days/yr
- Unhealthy air days in 30 yrs
- 2 days/yr
Risk factors via First Street. Map © Google.
Why this score? — see what drove the C- grade
The composite is a weighted blend of 9 inputs, each scored 0–100. Each bar is that input's sub-score; the figure is the points it added to the 100-point composite (weight × sub-score).
- Cash flow +17.4/30.0
- Appreciation +10.0/10.0
- ARV discount +7.5/15.0
- DSCR +5.4/10.0
- 1% rule +3.4/10.0
- Livability +3.2/5.0
- Rent growth +2.6/5.0
- Condition / age +2.5/5.0
- Schools +2.3/10.0
$125,000
🖨 Deal sheet (PDF) 📄 Offer letter ✓ Due diligence
Listing remarks MLS
Investors this house is ready to finish. The Demo is done, down to the studs, for you to unleash all the potential. This home could easily be made a 2-bedroom 1- bath home with a cellar. Buyer to verify all information including but not limited to square footage, lot size, utilities, foundations, environmental concerns, zoning and intended uses, etc. Property being sold as is/where is. This house is down to the studs and priced right. Come put the finishing touches on. Will consider owner financing.
Key facts
- Open-concept kitchen
- Private bonus room
- Convenient location
Tags
Property features AI
Finance
- HOA & community: No association fee
Exterior
- Utilities: Electricity connected
- Home design: Single-family residence; One story
- Construction: Built in 1905; Vinyl siding with wood frame construction; Shingle roof; Crawl space and poured concrete foundation
- Exterior features: Sidewalk along the lot; Wood and chain-link fencing
Interior
- Kitchen: Kitchen located on the first floor; Dining area adjacent to the kitchen on the first floor
- Bedrooms: Two bedrooms total; Primary bedroom located on the first floor; Additional bedrooms located on the first floor
- Bathrooms: One full bathroom; One half bathroom; Primary bathroom located on the first floor; Full bathroom located on the first floor
- Interior features: Six total rooms; Four closets; Cellar with outside entry; Living room on the first floor; Dining area on the first floor; Primary bedroom on the first floor; Primary bathroom on the first floor; Full bathroom on the first floor; Half bathroom present; First-floor laundry
- Laundry & utility: Laundry located on the first floor; First-floor laundry
Neighborhood map
What this means for you Summary
Snapshot
- This is a 2-bed/1.5-bath single-family listed at $125k.
Deal economics
- At list price, monthly cash flow is $94 ($1k/yr) — positive.
- The deal already cash-flows at list — no discount required.
- To meet the 1% rule (rent ≥ 1% of price), the offer needs to be $105k (15.9% below list).
- Recommended offer: $105k (15.9% below list) — sets the bar for 1% rule.
- Cap rate 7.2% vs local median 5.0% in Louisville — top-decile yield for the area; either an underpriced asset or a hidden risk that comps aren't pricing in. Stress-test before assuming the spread holds.
Location & tenants
- Location reads 63/100 on livability (#333 in KY) — a middle-class / working-renter tenant base. Strengths: cost of living A+, housing A+; Watch: employment C-, health & safety D+, schools D-.
- Jefferson County (urban): math 19% / reading 35% proficiency, ranked #121 of 165 in KY (top 73%) — low school quality limits family demand, transient renter base, plan for 1-2y turnover.
- Market conditions: Rents flat; 140 active listings in the ZIP; 40 comparable units currently listed for rent nearby; rentals at typical pace (median 25d on market — plan ~3-4 weeks tenant-placement turnaround); lower-income renter base — watch delinquency; 2,836 units permitted in Jefferson County in 2024 (1,558 in 5+ unit buildings).
Forward outlook
- In year one you build about $13k of equity ($864 loan paydown + $12k appreciation (10.0% local appreciation)).
- Jefferson County population projected at +13% by 2050 — modest demand growth; plan on rents tracking national, not racing it.
- At projected returns (10.0% appreciation + 0.5% rent growth), your $35k cash investment doubles in ~3 years — after that, you're playing with house money.
- By year 3, paydown + projected appreciation supports a ~$34k cash-out refi (75% LTV) — recoverable capital for the next deal without selling this one.
Negotiation context
- It's been on market 225 days — a 12% lower offer ($110k) is reasonable based on typical stale-listing flexibility.
- 2 sale attempts since 4y ago; this cycle's ask has dropped $25k (17%) from the opening price — seller is motivated, your offer sets the floor, not the list.
- Current owner paid $25k; list at $125k implies a 400% gain — meaningful room to come down on a strong offer.
Risks & watch-outs
- Watch-outs: built in 1905 — expect roof / HVAC / electrical / plumbing capex.
- Climate carrying-cost: extreme-heat days projected 7→20/yr by 2055 (HVAC capex compounding) — expect insurance premiums to compound above CPI over the hold.
Questions for the listing agent
- It's been on market 225 days. Have you received any prior offers? Is the seller open to a 16% concession, seller financing, or rate buy-down credit?
- Built in 1905 — when were the roof, HVAC, electrical panel, plumbing, and water heater last replaced?
- Why hasn't it sold? Are there any deal-killer items the seller is aware of (foundation, flood, title, zoning, code violations)?
- Is there a deadline driving the sale (1031 exchange, divorce, estate, relocation)? That informs how much negotiation room exists.
- Schools are D-rated, which usually means shorter tenancies and higher turnover. Who's the typical renter profile here, and what's been the actual vacancy rate?
- Crime grade is F in this area — have there been break-ins, vandalism, or insurance claims at this property in the last 3 years? What carrier currently insures it and at what premium?
- What's the average days-on-market for RENTAL listings here right now (not sales)? A rising rental-DOM trend means longer vacancies and softer asking-rent achievability than the comps imply.
- What's the recent tenant-quality profile in this submarket — average credit score on applications, eviction rate, late-payment / NSF rate, and stable-employment percentage? A property-management company in the area should have these aggregated.
- How much new for-sale + rental construction is in the pipeline within 1–3 miles? Heavy new supply typically softens prices + rents 12–24 months out; constrained supply supports both.
Investment metrics
- 1% rule
- 0.84% ✗
- Cap rate
- 7.19%
- Cash-on-cash
- 3.22%
- DSCR
- 1.14
- GRM
- 9.9
CMA / ARV
- ARV (on-the-fly)
- $83,332
- Comps found
- 12
Show comp detail 12 sales within ~0.75 mi
| Address | Dist | Beds/Ba | Sqft | Sold | Price | $/sf | Match |
|---|---|---|---|---|---|---|---|
| 2722 Slevin St | 0.09mi | 2/1.0 | 984 (-2%) | 5mo | $65,000 | $66 | 86 |
| 363 N 27th St | 0.12mi | 2/1.0 | 972 (-3%) | 6mo | $36,500 | $38 | 82 |
| 365 N 27th St | 0.13mi | 2/1.0 | 1,093 (+9%) | 6mo | $95,000 | $87 | 72 |
| 3304 Bank St | 0.48mi | 2/1.0 | 1,020 (+2%) | 2mo | $131,000 | $128 | 71 |
| 2511 Bank St | 0.37mi | 2/1.0 | 960 (-4%) | 6mo | $10,000 | $10 | 68 |
| 2618 Cornwall St | 0.49mi | 2/1.0 | 1,024 (+2%) | 7mo | $85,000 | $83 | 66 |
| 315 N 26th St | 0.26mi | 1/1.0 (-1) | 878 (-12%) | 7mo | $29,000 | $33 | 54 |
| 2419 Montgomery St | 0.53mi | 3/1.0 (+1) | 1,092 (+9%) | 4mo | $92,000 | $84 | 51 |
| 331 N 23rd St | 0.51mi | 2/1.0 | 855 (-15%) | 4mo | $105,000 | $123 | 46 |
| 428 N 20th St | 0.72mi | 2/1.0 | 894 (-11%) | 7mo | $46,000 | $51 | 41 |
| 2321 W Market St | 0.65mi | 3/1.0 (+1) | 1,138 (+13%) | 1mo | $110,000 | $97 | 40 |
| 117 N 34th St | 0.68mi | 3/1.0 (+1) | 1,130 (+12%) | 4mo | $34,000 | $30 | 37 |
Match score weights: distance 35% · size 25% · config 20% · recency 20%. Top-matched comps best support the ARV.
Projected returns pro-forma
10.0% appreciation · 0.51% rent growth · sell at horizon
- IRR
- 25.8%
- Equity multiple
- 3.04×
- Total profit
- $71,424
- Equity at exit
- $112,610
- IRR
- 22.1%
- Equity multiple
- 6.74×
- Total profit
- $200,804
- Equity at exit
- $242,848
Cash invested: $35,000 (down + closing). Projections, not guarantees.
Landlord ↔ Tenant lean methodology
- Overall (STATE)
- 83 Strongly Landlord-Friendly
- State Kentucky
- 83 Strongly Landlord-Friendly · R+16
- County
- — inherits STATE
- City
- — inherits STATE
ZIP-level market 40212
- Home prices YoY
- 11.0%
- Rents YoY
- 0.5%
- Active inventory
- 140
- Price-to-rent
- 9.9×
Monthly cashflow live
- Estimated rent
- $1,052 high interval (Pro) →
- Mortgage (P&I)
- −$656
- Tax from tax record
- −$29 /mo · $351/yr
- Insurance
- −$52
- HOA
- −$0
- Vacancy / Maint / Mgmt
- −$221
- Net cashflow
- $94
Break-even live
Sensitivity live
| Price | -10% $165 | -5% $129 | +0% $94 | +5% $58 | +10% $23 |
|---|---|---|---|---|---|
| Rent | -10% $11 | -5% $52 | +0% $94 | +5% $135 | +10% $177 |
| Rate | -1.0pp $157 | -0.5pp $126 | base $94 | +0.5pp $61 | +1.0pp $29 |
UW: 25.0% down · 7.5% · 30yr · 1.5% tax · 5.0% vac · 8.0% maint · 8.0% mgmt
Financing live
Cash to close
- Down payment
- $31,250
- Closing costs
- $3,750
- Reserves months
- —
- Total cash needed
- —
Loan-product check · same deal, 3 products live
Conventional
25% down · 7.5% · 30yr
- Down + closing
- —
- Monthly P&I
- —
- Monthly cashflow
- —
- DSCR
- —
- Eligible?
- —
Personal DTI + credit; lowest rate.
DSCR
20% down · 8.5% · 30yr
- Down + closing
- —
- Monthly P&I
- —
- Monthly cashflow
- —
- DSCR
- —
- Eligible?
- —
No personal income docs; deal must DSCR.
Hard money
10% down · 12.0% · 12mo
- Down + closing
- —
- Monthly P&I
- —
- Monthly cashflow
- —
- DSCR
- —
- Eligible?
- —
Short-term bridge; refi at stabilization.
Rent comps 40 comps
| Address | Beds | Baths | Sqft | Rent | $/sqft | DOM | Units | Dist |
|---|---|---|---|---|---|---|---|---|
| 353 N 27th St Louisville, KY | 2.0 | 1.0 | 1100 | $1,100 | $1.00 | 24d | 1 | 0.11mi |
| 2925 Slevin St Louisville, KY | 2.0 | 1.0 | 896 | $775 | $0.86 | 4d | 1 | 0.21mi |
| 2433 Slevin St Unit 2433-2 Louisville, KY | 3.0 | 1.0 | 800 | $875 | $1.09 | 4d | 1 | 0.31mi |
| 2539 Bank St Unit 1 Louisville, KY | 1.0 | 1.0 | 900 | $750 | $0.83 | 24d | 1 | 0.32mi |
| 522 N 29th St Louisville, KY | 3.0 | 1.0 | 1031 | $1,300 | $1.26 | 4d | 1 | 0.34mi |
| 451 N 25th St Unit Mk Louisville, KY | 2.0 | 1.0 | 988 | $875 | $0.89 | 4d | 1 | 0.35mi |
| 322 N 24th St Louisville, KY | 2.0 | 1.0 | 950 | $1,100 | $1.16 | 16d | 1 | 0.38mi |
| 2927 Rowan St Louisville, KY | 3.0 | 1.0 | 1008 | $1,205 | $1.20 | 12d | 1 | 0.39mi |
| 212 N 25th St Louisville, KY | 3.0 | 1.0 | 1104 | $895 | $0.81 | 24d | 1 | 0.39mi |
| 509 N 31st St Louisville, KY | 2.0 | 1.0 | 800 | $795 | $0.99 | 24d | 1 | 0.43mi |
| 509 N 31st St Louisville, KY | 2.0 | 1.0 | 800 | $725 | $0.91 | 16d | 1 | 0.43mi |
| 2529 W Main St #2 Louisville, KY | 3.0 | 1.0 | 1404 | $1,200 | $0.85 | 24d | 1 | 0.44mi |
| 214 N 24th St Louisville, KY | 3.0 | 1.5 | 1012 | $915 | $0.90 | 24d | 1 | 0.44mi |
| 3120 Bank St Unit B Louisville, KY | 2.0 | 1.0 | 750 | $795 | $1.06 | 24d | 1 | 0.45mi |
| 2506 Montgomery St Louisville, KY | 3.0 | 2.0 | 1081 | $1,295 | $1.20 | 4d | 4 | 0.46mi |
| 2906 Montgomery St Unit B Louisville, KY | 3.0 | 1.0 | 1152 | $1,060 | $0.92 | 24d | 1 | 0.49mi |
| 331 N 23rd St Louisville, KY | 2.0 | 1.0 | 855 | $1,150 | $1.35 | 17d | 1 | 0.49mi |
| 2508 W Main St Louisville, KY | 3.0 | 1.0 | 1327 | $1,500 | $1.13 | 24d | 1 | 0.49mi |
| 652 N 29th St Louisville, KY | 3.0 | 1.0 | 1127 | $1,350 | $1.20 | 17d | 1 | 0.55mi |
| 2614 W Jefferson St Unit 2614-4 Louisville, KY | 2.0 | 1.0 | 740 | $795 | $1.07 | 24d | 1 | 0.63mi |
| 2132 Rowan St Louisville, KY | 1.0–2.0 | 1.0–2.0 | 875 | $928 | $1.06 | 4d | 4 | 0.65mi |
| 2623 Cedar St Louisville, KY | 3.0 | 1.0 | 1000 | $1,000 | $1.00 | 24d | 1 | 0.70mi |
| 409 N 20th St Louisville, KY | 3.0 | 1.0 | 1200 | $1,050 | $0.88 | 4d | 1 | 0.74mi |
| 320 N 36th St Louisville, KY | 3.0 | 1.0 | 830 | $1,225 | $1.48 | 16d | 1 | 0.78mi |
| 120 N 20th St Louisville, KY | 3.0 | 1.5 | 1300 | $1,400 | $1.08 | 24d | 1 | 0.79mi |
| 430 S 24th St Louisville, KY | 3.0 | 1.5 | 1288 | $1,400 | $1.09 | 24d | 1 | 0.80mi |
| 1919 Baird St Louisville, KY | 3.0 | 1.0 | 1500 | $1,100 | $0.73 | 16d | 1 | 0.80mi |
| 219 N 37th St Louisville, KY | 2.0 | 1.0 | 700 | $1,150 | $1.64 | 24d | 1 | 0.82mi |
| 2631 W Madison St Unit 2 Louisville, KY | 2.0 | 1.0 | 928 | $850 | $0.92 | 24d | 1 | 0.87mi |
| 2631 W Madison St Unit 1 Louisville, KY | 3.0 | 1.0 | 928 | $950 | $1.02 | 24d | 1 | 0.87mi |
| 2631 W Madison St Unit 2 Louisville, KY | 2.0 | 1.0 | 928 | $850 | $0.92 | 17d | 1 | 0.87mi |
| 200 N 18th St Unit 200-4 Louisville, KY | 2.0 | 1.0 | 740 | $775 | $1.05 | 21d | 1 | 0.94mi |
| 112 N 18th St Louisville, KY | 2.0 | 1.0 | 944 | $1,050 | $1.11 | 24d | 1 | 0.96mi |
| 3901 Jewell Ave Louisville, KY | 3.0 | 1.0 | 1069 | $1,140 | $1.07 | 21d | 1 | 0.99mi |
| 2221 W Madison St Louisville, KY | 3.0 | 1.0 | 1000 | $1,350 | $1.35 | 24d | 1 | 0.99mi |
| 2221 W Madison St Louisville, KY | 2.0 | 1.0 | 1000 | $1,350 | $1.35 | 22d | 1 | 0.99mi |
| 2300 W Madison St Louisville, KY | 2.0 | 1.0 | 900 | $850 | $0.94 | 24d | 1 | 0.99mi |
| 500 N 17th St Apt 309 Louisville, KY | 2.0 | 1.0 | 775 | $1,200 | $1.55 | 24d | 1 | 0.99mi |
| 500 N 17th St Unit 301 Louisville, KY | 2.0 | 1.0 | 775 | $1,200 | $1.55 | 16d | 1 | 0.99mi |
| 500 N 17th St Unit 305 Louisville, KY | 1.0 | 1.0 | 825 | $1,100 | $1.33 | 24d | 1 | 0.99mi |
Listing history 20 events
-
2026-06-18days on market $125,000 Active 225 DOM
-
2026-06-17days on market $125,000 Active 224 DOM
-
2026-06-16days on market $125,000 Active 223 DOM
-
2026-06-15days on market $125,000 Active 222 DOM
-
2026-06-13days on market $125,000 Active 220 DOM
-
2026-06-10days on market $125,000 Active 217 DOM
-
2026-06-09days on market $125,000 Active 216 DOM
-
2026-06-08days on market $125,000 Active 215 DOM
-
2026-06-07days on market $125,000 Active 214 DOM
-
2026-06-03days on market $125,000 Active 210 DOM
-
2026-06-02days on market $125,000 Active 209 DOM
-
2026-06-01days on market $125,000 Active 208 DOM
-
2026-05-31days on market $125,000 Active 207 DOM
-
2026-05-03price $125,000
-
2026-03-27price $130,000
-
2025-11-20price $145,000
-
2025-11-05$150,000 Active
-
2022-06-16soldstatus $25,000 Closed 507-char remark
Show marketing remark (507 chars)
Investors this house is ready to finish. The Demo is done, down to the studs, for you to unleash all the potential. This home could easily be made a 2-bedroom 1- bath home with a cellar. Buyer to verify all information including but not limited to square footage, lot size, utilities, foundations, environmental concerns, zoning and intended uses, etc. Property being sold as is/where is. This house is down to the studs and priced right. Come put the finishing touches on. Will consider owner financing.
-
2022-06-01historical Active Under Contract 507-char remark
Show marketing remark (507 chars)
Investors this house is ready to finish. The Demo is done, down to the studs, for you to unleash all the potential. This home could easily be made a 2-bedroom 1- bath home with a cellar. Buyer to verify all information including but not limited to square footage, lot size, utilities, foundations, environmental concerns, zoning and intended uses, etc. Property being sold as is/where is. This house is down to the studs and priced right. Come put the finishing touches on. Will consider owner financing.
-
2022-05-22$31,500 Active 507-char remark
Show marketing remark (507 chars)
Investors this house is ready to finish. The Demo is done, down to the studs, for you to unleash all the potential. This home could easily be made a 2-bedroom 1- bath home with a cellar. Buyer to verify all information including but not limited to square footage, lot size, utilities, foundations, environmental concerns, zoning and intended uses, etc. Property being sold as is/where is. This house is down to the studs and priced right. Come put the finishing touches on. Will consider owner financing.
ⓘ Source: listings_history table (triggers on properties + properties_extension) + one-shot
backfill from property_details.listing_events for pre-trigger history.
Tax reassessment forecast KY · Resets to sale price
- Current annual tax
- $351 · $29/mo
- Projected year-2 tax
- $1,075 · $90/mo
- Expected delta
- +$724/yr (+$60/mo · 205.9%)
ⓘ Screening estimate from a state-policy table — verify with the county assessor before closing.
Climate risk First Street
- Flood 1/10 Low FEMA zone X (unshaded) · 0% chance over 30 yrs
- Wildfire 1/10 Low
- Heat 5/10 Major 7 d/yr ≥105°F today · 20 d/yr by 30 yrs out
- Wind 2/10 Low 100% chance of damaging wind over 30 yrs
- Air quality 2/10 Low 1 unhealthy d/yr today · 2 by 30 yrs out
Nearby sold comps map
Loading sold comps map…
Walkable amenities ~0.75 mi
Loading nearby amenities…
Taxation est. · year 1
- Rental income
- $12,619
- − Mortgage interest
- −$7,002
- − Property taxes
- −$351
- − Insurance
- −$625
- − Repairs & maintenance
- −$1,010
- − Management
- −$1,010
- − Depreciation
- −$3,636
- Taxable loss
- −$1,015
- Est. tax savings @ 24.0%
- +$244
- After-tax cash flow
- $1,370/yr
For passive investors: Depreciation is non-cash, so a rental often shows a tax loss while cash-flowing — sheltering income. Rental losses are passive: they offset passive income freely, and up to $25,000/yr can offset ordinary (W-2) income if you actively participate and your MAGI is under $100k (phasing out to $0 by $150k); unused losses carry forward. On sale, claimed depreciation is recaptured at up to 25%, and gains may owe capital-gains tax (a 1031 exchange can defer both). Figures are a year-1 estimate at your 24.0% rate — not tax advice; consult a CPA.
Schools (NCES district)
- District
- Jefferson County
- NCES district ID
- 2102990
- Math proficiency
- 19% ▼ -17.00%
- Reading proficiency
- 35% ▼ -11.00%
- Median HH income
- $47,885
- Composite
- 23.45/100
- National rank
- #7884
- State rank
- #121 of 165 in KY
Livability — Louisville
- Score
- 63/100
- State rank
- #333
- US rank
- #15887
Category grades
Schools grade is shown separately in the Schools card above.
Census & demographics
- Census place
- Louisville, KY
- County
- Jefferson County · 790,184 people
- City population
- 769,292
- Metro
- Louisville/Jefferson County, KY-IN
- Population (ZIP)
- 14,661
- Household income
- $35,753
- Rent vs Own
- Severe rent burden
- 1148.0
Population outlook (Jefferson County) Hauer SSP2
- Today (2025)
- 823,112 people
- By 2030
- 849,343 · +3.2%
- By 2040
- 895,696 · +8.8%
- By 2050
- 933,630 · +13.4%
- By 2075
- 1,028,262 · +24.9%
- By 2100
- 1,072,675 · +30.3%
Race, ethnicity, and origin ACS 2023
- Neighborhood character
- Majority Black (60%)
- Race & ethnicity
- Black 60% White 37% Two or more races 2% Hispanic / Latino 1%
- Common ancestry
- Slovak 1% Lithuanian 1% Iranian 1%
- Foreign-born
- 1% · Canada
- Languages at home
- 98% English-only · Spanish 1%
Political lean MEDSL · Jefferson
- 2024 margin
- D (+16.6) · D 57.4% · R 40.9% · Other 1.7%
- 2008→2024 swing
- +4.5pp toward D · 2008: 12.0pp · 2024: 16.6pp
- All cycles
- 2024: D+16.6 2020: D+20.1 2016: D+13.3 2012: D+11.1 2008: D+12.0
Not yet ingested
- Civics
- —
Market trends
- HPI YoY
- ▲ 29.02%
- Current HPI
- 293.2624
- Rent YoY
- ▲ 0.51%
- Metro
- Louisville/Jefferson County, KY-IN
- State GDP YoY
- ▲ 1.81%
- F500 in state
- 4
Industry mix (Fortune 500 HQ in KY)
| Industry | F500 HQs | Revenue |
|---|---|---|
| Healthcare | 1 | $118B |
|
||
| Food / Beverage | 1 | $7B |
|
||
Price history
+296.8% since first listed7 events — show timeline
- 2026-05-03 Price Changed $125,000 Metro Search MLS
- 2026-03-27 Price Changed $130,000 Metro Search MLS
- 2025-11-20 Price Changed $145,000 Metro Search MLS
- 2025-11-05 Listed $150,000 Metro Search MLS
- 2022-06-16 Sold (MLS) $25,000 Metro Search MLS
- 2022-06-01 Contingent — Metro Search MLS
- 2022-05-22 Listed $31,500 Metro Search MLS
Property tax history
+0.5%/yrLatest (2025): $351 · +9.5% YoY. Source: county tax records.
Cash-flow waterfall
monthlySold comps — $/sqft
last 12 mo · ≤1 miLoading sold comps…