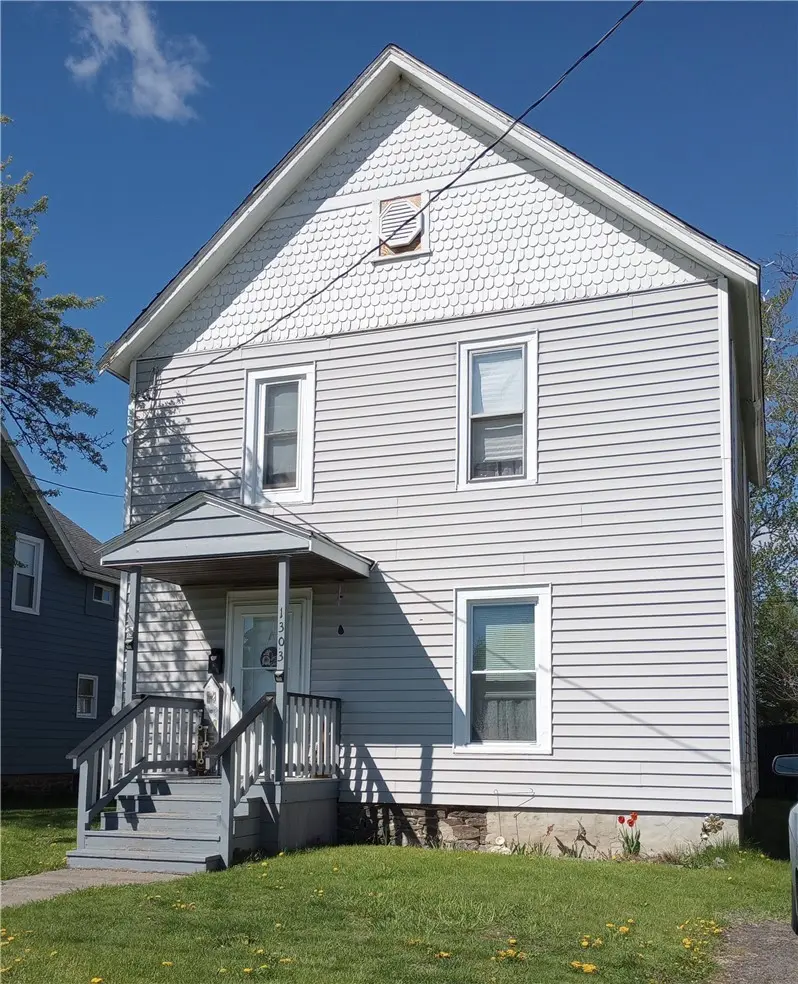
1303 N Main St · Elmira, NY
Flood risk 1/10 · Minimal
- FEMA flood zone
- X (shaded)
- Chance of flooding over 30 yrs
- 0.0%
- Est. flood insurance / yr
- $473 – $860
Fire risk 3/10 · Minor
- Est. fire insurance / yr
- $691 – $1,283
Heat risk 3/10 · Minor
- Hot days now (above 96°F)
- 8 days/yr
- Hot days in 30 yrs
- 17 days/yr
Wind risk 1/10 · Minimal
- Chance of severe wind over 30 yrs
- 1.0%
Air-quality risk 1/10 · Minimal
- Unhealthy air days now
- 0 days/yr
- Unhealthy air days in 30 yrs
- 0 days/yr
Risk factors via First Street. Map © Google.
Why this score? — see what drove the C+ grade
The composite is a weighted blend of 9 inputs, each scored 0–100. Each bar is that input's sub-score; the figure is the points it added to the 100-point composite (weight × sub-score).
- Cash flow +19.5/30.0
- ARV discount +13.2/15.0
- Appreciation +10.0/10.0
- DSCR +6.1/10.0
- 1% rule +5.5/10.0
- Livability +3.1/5.0
- Rent growth +2.5/5.0
- Condition / age +2.5/5.0
- Schools +2.4/10.0
$125,000
🖨 Deal sheet (PDF) 📄 Offer letter ✓ Due diligence
Listing remarks
This home is conveniently located near Elmira College, LECOM, Arnot Ogden Medical Center, shopping, restaurants, parks, schools, biking and hiking trail. The 1st floor has kitchen, dining room, living room and bonus room could be a den, office, or a bedroom. The 2nd floor has 3 bedrooms and a full bath, bonus room off one of the bedrooms could be extra storage or office space. A deck area for entertaining and/or relaxing and off-street parking. Tenant occupied please allow 48 hours. Tenant maybe present. No appliances to convey with sale, all tenant owned
Key facts
- Deck area
- Off street parking
- Bonus room
Tags
Property features AI
Exterior
- Parking: No garage
- Utilities: Public water connected; Sewer connected
- Home design: 2-story; Resale property
- Construction: Wood siding; Blown-in insulation; Stone foundation; Existing (previously built)
- Exterior features: Blacktop driveway; Deck; Covered porch
Interior
- Flooring: Hardwood; Laminate; Varied flooring
- Bathrooms: 1 full bathroom
- Heating & cooling: Gas forced-air heating
- Interior features: Separate formal dining room; Separate formal living room; Full basement
- Laundry & utility: Gas water heater
Neighborhood map
What this means for you Summary
Snapshot
- This is a 3-bed/1.0-bath single-family listed at $125k.
Deal economics
- At list price, monthly cash flow is $141 ($2k/yr) — positive.
- The deal already cash-flows at list — no discount required.
- Meets the 1% rule at list price ($1k rent vs $125k).
- Recommended offer: $121k (3.0% below list) — sets the bar for market timing.
- Cap rate 7.6% vs local median 10.1% in Elmira — below-typical yield; the buyer is paying a premium for something (appreciation thesis, condition, location) that the cap rate doesn't capture.
Location & tenants
- Location reads 62/100 on livability (#832 in NY) — a middle-class / working-renter tenant base. Strengths: cost of living A+, housing A+, health & safety A+; Watch: schools F, crime F, amenities F.
- Elmira City School District (urban): math 23% / reading 35% proficiency, ranked #580 of 590 in NY (top 98%) — low school quality limits family demand, transient renter base, plan for 1-2y turnover.
- Market conditions: 79 active listings in the ZIP; 6 comparable units currently listed for rent nearby; rentals lingering (median 45d on market — plan ~5-8 weeks vacancy on turnover, expect pricing pressure); 100% of comp listings sitting > 30 days — soft ceiling on asking rent; 91 units permitted in Chemung County in 2024 (63 in 5+ unit buildings).
Forward outlook
- In year one you build about $13k of equity ($864 loan paydown + $12k appreciation (10.0% local appreciation)).
- Chemung County population projected at -17% by 2050 — secular population decline; favor cash flow + early exit over multi-decade hold.
- At projected returns (10.0% appreciation + 3.0% rent growth), your $35k cash investment doubles in ~3 years — after that, you're playing with house money.
- By year 3, paydown + projected appreciation supports a ~$34k cash-out refi (75% LTV) — recoverable capital for the next deal without selling this one.
Negotiation context
- It's been on market 49 days — a 3% lower offer ($121k) is reasonable based on typical stale-listing flexibility.
- 3 sale attempts since 5y ago; this cycle's ask has dropped $10k (7%) from the opening price — seller is motivated, your offer sets the floor, not the list.
Risks & watch-outs
- Watch-outs: built in 1900 — expect roof / HVAC / electrical / plumbing capex.
Questions for the listing agent
- It's been on market 49 days. Have you received any prior offers? Is the seller open to a 3% concession, seller financing, or rate buy-down credit?
- Built in 1900 — when were the roof, HVAC, electrical panel, plumbing, and water heater last replaced?
- Is there a deadline driving the sale (1031 exchange, divorce, estate, relocation)? That informs how much negotiation room exists.
- Schools are F-rated, which usually means shorter tenancies and higher turnover. Who's the typical renter profile here, and what's been the actual vacancy rate?
- Crime grade is F in this area — have there been break-ins, vandalism, or insurance claims at this property in the last 3 years? What carrier currently insures it and at what premium?
- What's the average days-on-market for RENTAL listings here right now (not sales)? A rising rental-DOM trend means longer vacancies and softer asking-rent achievability than the comps imply.
- What's the recent tenant-quality profile in this submarket — average credit score on applications, eviction rate, late-payment / NSF rate, and stable-employment percentage? A property-management company in the area should have these aggregated.
- How much new for-sale + rental construction is in the pipeline within 1–3 miles? Heavy new supply typically softens prices + rents 12–24 months out; constrained supply supports both.
Investment metrics
- 1% rule
- 1.05% ✓
- Cap rate
- 7.64%
- Cash-on-cash
- 4.83%
- DSCR
- 1.21
- GRM
- 7.9
CMA / ARV
- ARV (median comp)
- $143,124
- List price
- $125,000
- Delta
- -12.66%
- Verdict
- UNDERPRICED
- Comps
- 20 within 1.0 mi
Show comp detail 12 sales within ~0.75 mi
| Address | Dist | Beds/Ba | Sqft | Sold | Price | $/sf | Match |
|---|---|---|---|---|---|---|---|
| 218 Grant St | 0.09mi | 2/1.0 (-1) | 1,580 (-1%) | 5mo | $89,000 | $56 | 84 |
| 1201 Magee St | 0.10mi | 3/2.0 | 1,686 (+5%) | 8mo | $176,000 | $104 | 76 |
| 1153 College Ave | 0.23mi | 3/1.0 | 1,480 (-8%) | 5mo | $105,000 | $71 | 73 |
| 229 Crete Ave | 0.53mi | 3/1.5 | 1,730 (+8%) | 3mo | $75,000 | $43 | 57 |
| 235 Chapman Pl | 0.71mi | 3/1.5 | 1,668 (+4%) | 4mo | $222,000 | $133 | 54 |
| 1320 Grand Central Ave | 0.45mi | 3/1.0 | 1,376 (-14%) | 3mo | $37,500 | $27 | 53 |
| 950 N Main St | 0.63mi | 4/1.5 (+1) | 1,644 (+3%) | 7mo | $37,000 | $23 | 53 |
| 478 Roe Ave | 0.67mi | 3/1.0 | 1,512 (-6%) | 8mo | $157,500 | $104 | 52 |
| 319 Webber Pl | 0.64mi | 3/1.5 | 1,716 (+7%) | 8mo | $145,000 | $84 | 49 |
| 224 Kingsbury Ave | 0.61mi | 3/1.5 | 1,404 (-12%) | 6mo | $160,000 | $114 | 44 |
| 918 Magee St | 0.65mi | 4/1.0 (+1) | 1,812 (+13%) | 1mo | $112,000 | $62 | 42 |
| 455 Roe Ave | 0.66mi | 4/2.0 (+1) | 1,764 (+10%) | 6mo | $105,000 | $60 | 38 |
Match score weights: distance 35% · size 25% · config 20% · recency 20%. Top-matched comps best support the ARV.
Projected returns pro-forma
10.0% appreciation · 3.0% rent growth · sell at horizon
- IRR
- 27.8%
- Equity multiple
- 3.20×
- Total profit
- $77,087
- Equity at exit
- $112,610
- IRR
- 24.2%
- Equity multiple
- 7.29×
- Total profit
- $220,039
- Equity at exit
- $242,848
Cash invested: $35,000 (down + closing). Projections, not guarantees.
Landlord ↔ Tenant lean methodology
- Overall (STATE)
- 15 Strongly Tenant-Friendly
- State New York
- 15 Strongly Tenant-Friendly · D+10
- County
- — inherits STATE
- City
- — inherits STATE
ZIP-level market 14901
- Home prices YoY
- 15.9%
- Active inventory
- 79
- Price-to-rent
- 7.9×
Monthly cashflow live
- Estimated rent
- $1,315 high interval (Pro) →
- Mortgage (P&I)
- −$656
- Tax from tax record
- −$191 /mo · $2,288/yr
- Insurance
- −$52
- HOA
- −$0
- Vacancy / Maint / Mgmt
- −$276
- Net cashflow
- $141
Break-even live
Sensitivity live
| Price | -10% $212 | -5% $176 | +0% $141 | +5% $105 | +10% $70 |
|---|---|---|---|---|---|
| Rent | -10% $37 | -5% $89 | +0% $141 | +5% $193 | +10% $245 |
| Rate | -1.0pp $204 | -0.5pp $173 | base $141 | +0.5pp $108 | +1.0pp $75 |
UW: 25.0% down · 7.5% · 30yr · 1.5% tax · 5.0% vac · 8.0% maint · 8.0% mgmt
Financing live
Cash to close
- Down payment
- $31,250
- Closing costs
- $3,750
- Reserves months
- —
- Total cash needed
- —
Loan-product check · same deal, 3 products live
Conventional
25% down · 7.5% · 30yr
- Down + closing
- —
- Monthly P&I
- —
- Monthly cashflow
- —
- DSCR
- —
- Eligible?
- —
Personal DTI + credit; lowest rate.
DSCR
20% down · 8.5% · 30yr
- Down + closing
- —
- Monthly P&I
- —
- Monthly cashflow
- —
- DSCR
- —
- Eligible?
- —
No personal income docs; deal must DSCR.
Hard money
10% down · 12.0% · 12mo
- Down + closing
- —
- Monthly P&I
- —
- Monthly cashflow
- —
- DSCR
- —
- Eligible?
- —
Short-term bridge; refi at stabilization.
Rent comps 6 comps
| Address | Beds | Baths | Sqft | Rent | $/sqft | DOM | Units | Dist |
|---|---|---|---|---|---|---|---|---|
| 355 W Clinton St Unit 1 Elmira, NY | 3.0 | 1.5 | 1650 | $1,400 | $0.85 | 44d | 1 | 1.16mi |
| 357 W Clinton St Unit 1 Elmira, NY | 2.0 | 1.5 | 1650 | $1,500 | $0.91 | 44d | 1 | 1.16mi |
| 106 W 2nd St Unit A Elmira, NY | 3.0 | 1.0 | 1395 | $1,400 | $1.00 | 44d | 1 | 1.28mi |
| 454 W 2nd St Unit 1 Elmira, NY | 2.0 | 1.0 | 1400 | $1,000 | $0.71 | 44d | 1 | 1.36mi |
| 258 E 14th St Elmira, NY | 2.0 | 1.0 | 1100 | $1,200 | $1.09 | 44d | 1 | 1.43mi |
| 514 W 1st St Unit A Elmira, NY | 4.0 | 1.0 | 1416 | $1,275 | $0.90 | 44d | 1 | 1.46mi |
Listing history 21 events
-
2026-06-19days on market $125,000 Active 49 DOM
-
2026-06-18days on market $125,000 Active 48 DOM
-
2026-06-17days on market $125,000 Active 47 DOM
-
2026-06-16days on market $125,000 Active 46 DOM
-
2026-06-15days on market $125,000 Active 45 DOM
-
2026-06-14days on market $125,000 Active 43 DOM
-
2026-06-12days on market $125,000 Active 42 DOM
-
2026-06-09days on market $125,000 Active 39 DOM
-
2026-06-08days on market $125,000 Active 38 DOM
-
2026-06-07days on market $125,000 Active 37 DOM
-
2026-06-05days on market $125,000 Active 34 DOM
-
2026-06-03days on market $125,000 Active 33 DOM
-
2026-06-02days on market $125,000 Active 32 DOM
-
2026-06-01days on market $125,000 Active 31 DOM
-
2026-05-31days on market $125,000 Active 30 DOM
-
2026-05-30days on market $125,000 Active 29 DOM
-
2026-05-01$135,000 Active 564-char remark
-
2023-05-01historical
-
2023-04-04$83,900
-
2021-04-30historical
-
2021-01-28$68,000
ⓘ Source: listings_history table (triggers on properties + properties_extension) + one-shot
backfill from property_details.listing_events for pre-trigger history.
Tax reassessment forecast NY · Partial reset (capped growth)
- Current annual tax
- $2,288 · $191/mo
- Projected year-2 tax
- $2,288 · $191/mo
- Expected delta
- $0/yr ($0/mo · 0.0%)
ⓘ Screening estimate from a state-policy table — verify with the county assessor before closing.
Climate risk First Street
- Flood 1/10 Low FEMA zone X (shaded) · 0% chance over 30 yrs
- Wildfire 3/10 Moderate
- Heat 3/10 Moderate 8 d/yr ≥96°F today · 17 d/yr by 30 yrs out
- Wind 1/10 Low 100% chance of damaging wind over 30 yrs
- Air quality 1/10 Low 0 unhealthy d/yr today · 0 by 30 yrs out
Nearby sold comps map
Loading sold comps map…
Walkable amenities ~0.75 mi
Loading nearby amenities…
Taxation est. · year 1
- Rental income
- $15,783
- − Mortgage interest
- −$7,002
- − Property taxes
- −$2,288
- − Insurance
- −$625
- − Repairs & maintenance
- −$1,263
- − Management
- −$1,263
- − Depreciation
- −$3,636
- Taxable loss
- −$293
- Est. tax savings @ 24.0%
- +$70
- After-tax cash flow
- $1,760/yr
For passive investors: Depreciation is non-cash, so a rental often shows a tax loss while cash-flowing — sheltering income. Rental losses are passive: they offset passive income freely, and up to $25,000/yr can offset ordinary (W-2) income if you actively participate and your MAGI is under $100k (phasing out to $0 by $150k); unused losses carry forward. On sale, claimed depreciation is recaptured at up to 25%, and gains may owe capital-gains tax (a 1031 exchange can defer both). Figures are a year-1 estimate at your 24.0% rate — not tax advice; consult a CPA.
Schools (NCES district)
- District
- Elmira City School District
- NCES district ID
- 3610560
- Math proficiency
- 23% ▼ -7.00%
- Reading proficiency
- 35% ▲ 7.00%
- Median HH income
- $40,180
- Composite
- 24.39/100
- National rank
- #7688
- State rank
- #580 of 590 in NY
Livability — Elmira
- Score
- 62/100
- State rank
- #832
- US rank
- #16139
Category grades
Schools grade is shown separately in the Schools card above.
Census & demographics
- Census place
- Elmira, NY
- City population
- 14,276
- Population (ZIP)
- 14,430
Population outlook (Chemung County) Hauer SSP2
- Today (2025)
- 82,931 people
- By 2030
- 80,356 · -3.1%
- By 2040
- 74,745 · -9.9%
- By 2050
- 69,012 · -16.8%
- By 2075
- 55,689 · -32.8%
- By 2100
- 41,428 · -50.0%
Race, ethnicity, and origin ACS 2023
- Neighborhood character
- Predominantly White (70%)
- Race & ethnicity
- White 70% Black 15% Two or more races 7% Hispanic / Latino 7% Asian 1%
- Hispanic origin (detail)
- Mexican 1% Puerto Rican 3%
- Common ancestry
- Romanian 4% Slovak 3% Iranian 2%
- Foreign-born
- 4% · Canada, China
- Languages at home
- 93% English-only · Spanish 3% Russian/Polish/Slavic 1% Chinese 1%
Political lean MEDSL · Chemung
- 2024 margin
- R (+16.8) · D 41.6% · R 58.4%
- 2008→2024 swing
- -15.6pp toward R · 2008: -1.2pp · 2024: -16.8pp
- All cycles
- 2024: R+16.8 2020: R+13.4 2016: R+20.0 2012: R+2.9 2008: R+1.2
Not yet ingested
- Civics
- —
Market trends
- HPI YoY
- ▲ 32.34%
- Current HPI
- 236.2674
- Rent YoY
- —
- Metro
- —
- State GDP YoY
- ▲ 2.60%
- F500 in state
- 92
Industry mix (Fortune 500 HQ in NY)
| Industry | F500 HQs | Revenue |
|---|---|---|
| Financial Services | 10 | $950B |
|
||
| Consumer Goods | 9 | $162B |
|
||
| Insurance | 4 | $225B |
|
||
| Telecommunications | 2 | $144B |
|
||
| Pharmaceuticals | 2 | $112B |
|
||
| Media / Entertainment | 2 | $69B |
|
||
Price history
+83.8% since first listed6 events — show timeline
- 2026-05-29 Price Changed $125,000 UNYREIS
- 2026-05-01 Listed $135,000 UNYREIS
- 2023-05-01 Listing Removed — UNYREIS
- 2023-04-04 Listed $83,900 UNYREIS
- 2021-04-30 Listing Removed — UNYREIS
- 2021-01-28 Listed $68,000 UNYREIS
Property tax history
+4.9%/yrLatest (2025): $2,288 · -22.6% YoY. Source: county tax records.
Cash-flow waterfall
monthlySold comps — $/sqft
last 12 mo · ≤1 miLoading sold comps…