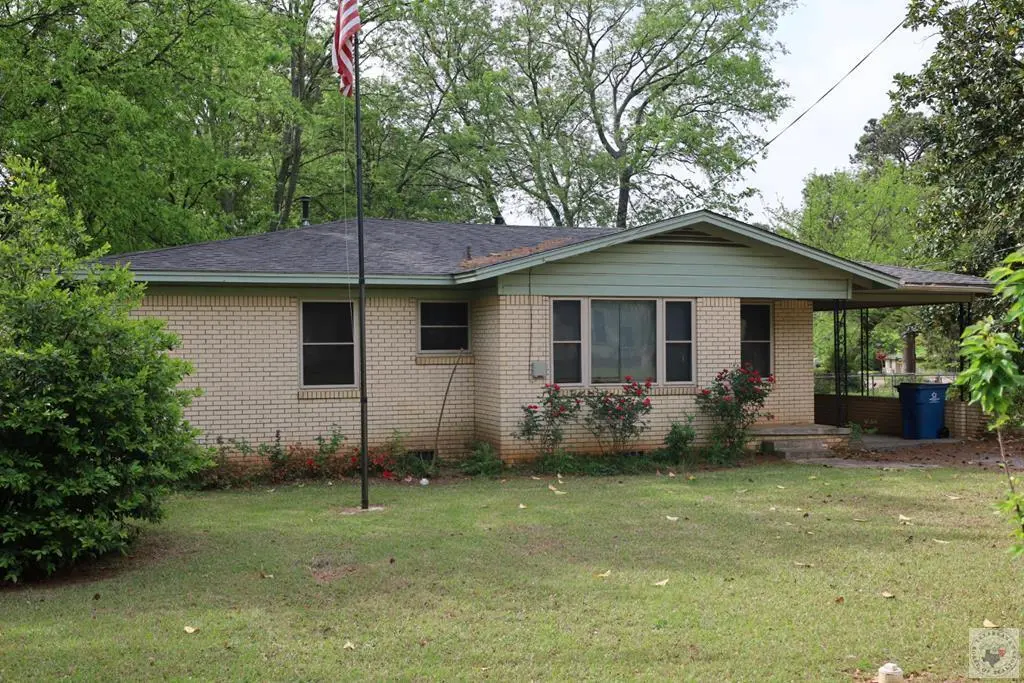
1221 Webb · Daingerfield, TX
Flood risk 1/10 · Minimal
- FEMA flood zone
- X
- Chance of flooding over 30 yrs
- 0.0%
- Est. flood insurance / yr
- $507 – $1,088
Fire risk 5/10 · Moderate
- Est. fire insurance / yr
- $1,222 – $2,270
Heat risk 7/10 · Major
- Hot days now (above 111°F)
- 7 days/yr
- Hot days in 30 yrs
- 23 days/yr
Wind risk 6/10 · Moderate
- Chance of severe wind over 30 yrs
- 27.0%
Air-quality risk 2/10 · Minimal
- Unhealthy air days now
- 0 days/yr
- Unhealthy air days in 30 yrs
- 1 days/yr
Risk factors via First Street. Map © Google.
Why this score? — see what drove the D grade
The composite is a weighted blend of 9 inputs, each scored 0–100. Each bar is that input's sub-score; the figure is the points it added to the 100-point composite (weight × sub-score).
- ARV discount +11.9/15.0
- Cash flow +9.2/30.0
- Appreciation +6.6/10.0
- Livability +3.4/5.0
- 1% rule +2.8/10.0
- DSCR +2.6/10.0
- Rent growth +2.5/5.0
- Condition / age +2.5/5.0
- Schools +2.3/10.0
$149,500
🖨 Deal sheet (PDF) 📄 Offer letter ✓ Due diligence
Listing remarks MLS
3/2/1 Located close to schools, this home has been completely remodeled…. .new floor covering, paint, ceiling fans, bathroom fixtures, new kitchen appliances. Home has walk-in closets, utility room and storage room. A fenced back yard for your two and four legged babies. Outside Storage building.
Key facts
- Lvt floors
- Hvac
- Utility room
Tags
Property features AI
Exterior
- Parking: One-car garage with workshop; Carport
- Utilities: Natural gas available; Public sewer
- Home design: Single-family residence; One level
- Construction: Pillar/post/pier foundation
- Exterior features: Partial fencing; Corner, level lot; Asphalt road access; Storage structure on property
Interior
- Bathrooms: Two full bathrooms
- Heating & cooling: Central heating; Electric heating; Natural gas heating; Central air conditioning
- Interior features: Gas water heater; Nine total rooms
Neighborhood map
What this means for you Summary
Snapshot
- This is a 3-bed/1.0-bath single-family listed at $150k.
Deal economics
- At list price, monthly cash flow is $-112 ($-1k/yr) — negative.
- To cash-flow at today's rent, offer at most $130k (13.2% below list).
- To meet the 1% rule (rent ≥ 1% of price), the offer needs to be $117k (21.7% below list).
- Recommended offer: $117k (21.7% below list) — sets the bar for 1% rule.
- Cap rate 5.4% vs local median 3.5% in Daingerfield — top-decile yield for the area; either an underpriced asset or a hidden risk that comps aren't pricing in. Stress-test before assuming the spread holds.
Location & tenants
- Location reads 67/100 on livability (#536 in TX) — a middle-class / working-renter tenant base. Strengths: cost of living A+, housing A+, health & safety A+; Watch: crime F, amenities F, commute F.
- Daingerfield-Lone Star ISD (town): math 24% / reading 32% proficiency, ranked #679 of 826 in TX (top 82%) — low school quality limits family demand, transient renter base, plan for 1-2y turnover; 71% free/reduced lunch — lower-income household profile, screen leases tightly.
- Zoned schools: West El (270 students, 90% FRL); Daingerfield J H (math 26% / reading 30%, grade F, #1,143 of 1,662 statewide, top 69%, 228 students, 86% FRL); Daingerfield H S (math 12% / reading 47%, grade F, #1,112 of 1,632 statewide, top 70%, 297 students, 83% FRL) — zoned schools average 86% FRL vs 71% district-wide (16 pts higher); higher-poverty schools than district average — tighter screening recommended.
- Market conditions: 86 active listings in the ZIP; 3 units permitted in Morris County in 2024 (0 in 5+ unit buildings).
Forward outlook
- In year one you build about $6k of equity ($1k loan paydown + $5k appreciation (3.1% local appreciation)).
- Morris County population projected at -19% by 2050 — secular population decline; favor cash flow + early exit over multi-decade hold.
- By year 6, paydown + projected appreciation supports a ~$30k cash-out refi (75% LTV) — recoverable capital for the next deal without selling this one.
Negotiation context
- It's been on market 29 days — a 2% lower offer ($147k) is reasonable based on typical stale-listing flexibility.
- 3 sale attempts since 7y ago with the ask held roughly flat each time — persistent listings suggest the price (not the market) is what's stuck; bring a comps-based counter.
- Current owner paid $74k; list at $150k implies a 101% gain — meaningful room to come down on a strong offer.
Risks & watch-outs
- Watch-outs: built in 1956 — expect roof / HVAC / electrical / plumbing capex.
- Climate carrying-cost: major wind risk, 27% chance of damaging wind over 30y; moderate wildfire risk; extreme-heat days projected 7→23/yr by 2055 (HVAC capex compounding) — expect insurance premiums to compound above CPI over the hold.
Questions for the listing agent
- What do current leases actually rent for vs. the listed asking? Can we see a recent rent roll and the last 12 months of T-12 income?
- Built in 1956 — when were the roof, HVAC, electrical panel, plumbing, and water heater last replaced?
- Is there a deadline driving the sale (1031 exchange, divorce, estate, relocation)? That informs how much negotiation room exists.
- Schools are F-rated, which usually means shorter tenancies and higher turnover. Who's the typical renter profile here, and what's been the actual vacancy rate?
- Crime grade is F in this area — have there been break-ins, vandalism, or insurance claims at this property in the last 3 years? What carrier currently insures it and at what premium?
- The area grade is low — what's the realistic commute time and amenity access for the typical tenant pool here? Any planned neighborhood developments (good or bad) we should know about?
- What's the average days-on-market for RENTAL listings here right now (not sales)? A rising rental-DOM trend means longer vacancies and softer asking-rent achievability than the comps imply.
- What's the recent tenant-quality profile in this submarket — average credit score on applications, eviction rate, late-payment / NSF rate, and stable-employment percentage? A property-management company in the area should have these aggregated.
- How much new for-sale + rental construction is in the pipeline within 1–3 miles? Heavy new supply typically softens prices + rents 12–24 months out; constrained supply supports both.
Investment metrics
- 1% rule
- 0.78% ✗
- Cap rate
- 5.39%
- Cash-on-cash
- -3.21%
- DSCR
- 0.86
- GRM
- 10.6
CMA / ARV
- ARV (median comp)
- $165,734
- List price
- $149,500
- Delta
- -4.06%
- Verdict
- FAIR
- Comps
- 12 within 1.0 mi
Show comp detail 5 sales within ~0.75 mi
| Address | Dist | Beds/Ba | Sqft | Sold | Price | $/sf | Match |
|---|---|---|---|---|---|---|---|
| 304 Hillcrest Blvd | 0.52mi | 3/2.0 | 1,445 (-4%) | 1mo | $85,000 | $59 | 65 |
| 111 Eg Mcmillan Way | 0.47mi | 3/2.0 | 1,454 (-3%) | 16mo | $209,900 | $144 | 56 |
| 1107 Glenn St | 0.22mi | 3/2.0 | 1,638 (+9%) | 24mo | $175,000 | $107 | 50 |
| 119 E G Mcmillan Way | 0.51mi | 3/2.0 | 1,333 (-11%) | 15mo | $199,000 | $149 | 41 |
| 501 N Willis St | 0.74mi | 3/2.0 | 1,668 (+11%) | 8mo | $46,000 | $28 | 36 |
Match score weights: distance 35% · size 25% · config 20% · recency 20%. Top-matched comps best support the ARV.
Projected returns pro-forma
3.11% appreciation · 3.0% rent growth · sell at horizon
- IRR
- 4.9%
- Equity multiple
- 1.28×
- Total profit
- $11,759
- Equity at exit
- $68,145
- IRR
- 7.9%
- Equity multiple
- 2.21×
- Total profit
- $50,845
- Equity at exit
- $105,743
Cash invested: $41,860 (down + closing). Projections, not guarantees.
Landlord ↔ Tenant lean methodology
- Overall (STATE)
- 87 Strongly Landlord-Friendly
- State Texas
- 87 Strongly Landlord-Friendly · R+5
- County
- — inherits STATE
- City
- — inherits STATE
ZIP-level market 75638
- Home prices YoY
- 1.7%
- Active inventory
- 86
- Price-to-rent
- 10.6×
Monthly cashflow live
- Estimated rent
- $1,171 medium interval (Pro) →
- Mortgage (P&I)
- −$784
- Tax from tax record
- −$191 /mo · $2,293/yr
- Insurance
- −$62
- HOA
- −$0
- Vacancy / Maint / Mgmt
- −$246
- Net cashflow
- $-112
Break-even live
Sensitivity live
| Price | -10% $-27 | -5% $-70 | +0% $-112 | +5% $-154 | +10% $-197 |
|---|---|---|---|---|---|
| Rent | -10% $-205 | -5% $-158 | +0% $-112 | +5% $-66 | +10% $-20 |
| Rate | -1.0pp $-37 | -0.5pp $-74 | base $-112 | +0.5pp $-151 | +1.0pp $-190 |
UW: 25.0% down · 7.5% · 30yr · 1.5% tax · 5.0% vac · 8.0% maint · 8.0% mgmt
Financing live
Cash to close
- Down payment
- $37,375
- Closing costs
- $4,485
- Reserves months
- —
- Total cash needed
- —
Loan-product check · same deal, 3 products live
Conventional
25% down · 7.5% · 30yr
- Down + closing
- —
- Monthly P&I
- —
- Monthly cashflow
- —
- DSCR
- —
- Eligible?
- —
Personal DTI + credit; lowest rate.
DSCR
20% down · 8.5% · 30yr
- Down + closing
- —
- Monthly P&I
- —
- Monthly cashflow
- —
- DSCR
- —
- Eligible?
- —
No personal income docs; deal must DSCR.
Hard money
10% down · 12.0% · 12mo
- Down + closing
- —
- Monthly P&I
- —
- Monthly cashflow
- —
- DSCR
- —
- Eligible?
- —
Short-term bridge; refi at stabilization.
Listing history 20 events
-
2026-06-21days on market $149,500 Active 29 DOM
-
2026-06-19days on market $149,500 Active 27 DOM
-
2026-06-18days on market $149,500 Active 26 DOM
-
2026-06-17days on market $149,500 Active 25 DOM
-
2026-06-16days on market $149,500 Active 24 DOM
-
2026-06-15days on market $149,500 Active 23 DOM
-
2026-06-14days on market $149,500 Active 21 DOM
-
2026-06-12pricedays on market $149,500 Active 20 DOM
-
2026-02-04price $159,000 1018-char remark
-
2026-01-20$169,900 Active 1018-char remark
-
2020-08-17soldstatus
-
2020-08-14soldstatus 304-char remark
Show marketing remark (304 chars)
3/2/1 Located close to schools, this home has been completely remodeled…. .new floor covering, paint, ceiling fans, bathroom fixtures, new kitchen appliances. Home has walk-in closets, utility room and storage room. A fenced back yard for your two and four legged babies. Outside Storage building.
-
2020-07-08$119,000 304-char remark
Show marketing remark (304 chars)
3/2/1 Located close to schools, this home has been completely remodeled…. .new floor covering, paint, ceiling fans, bathroom fixtures, new kitchen appliances. Home has walk-in closets, utility room and storage room. A fenced back yard for your two and four legged babies. Outside Storage building.
-
2020-01-27soldstatus
-
2020-01-22soldstatus
-
2019-07-21$70,000
-
2014-11-14soldstatus
-
2013-01-28soldstatus $74,250
-
1999-03-16soldstatus
-
1980-12-09soldstatus
ⓘ Source: listings_history table (triggers on properties + properties_extension) + one-shot
backfill from property_details.listing_events for pre-trigger history.
Tax reassessment forecast TX · Resets to sale price
- Current annual tax
- $2,293 · $191/mo
- Projected year-2 tax
- $2,736 · $228/mo
- Expected delta
- +$443/yr (+$37/mo · 19.3%)
ⓘ Screening estimate from a state-policy table — verify with the county assessor before closing.
Climate risk First Street
- Flood 1/10 Low FEMA zone X · 0% chance over 30 yrs
- Wildfire 5/10 Major
- Heat 7/10 Severe 7 d/yr ≥111°F today · 23 d/yr by 30 yrs out
- Wind 6/10 Major 27% chance of damaging wind over 30 yrs
- Air quality 2/10 Low 0 unhealthy d/yr today · 1 by 30 yrs out
Nearby sold comps map
Loading sold comps map…
Walkable amenities ~0.75 mi
Loading nearby amenities…
Taxation est. · year 1
- Rental income
- $14,055
- − Mortgage interest
- −$8,374
- − Property taxes
- −$2,293
- − Insurance
- −$748
- − Repairs & maintenance
- −$1,124
- − Management
- −$1,124
- − Depreciation
- −$4,349
- Taxable loss
- −$3,958
- Est. tax savings @ 24.0%
- +$950
- After-tax cash flow
- $-395/yr
For passive investors: Depreciation is non-cash, so a rental often shows a tax loss while cash-flowing — sheltering income. Rental losses are passive: they offset passive income freely, and up to $25,000/yr can offset ordinary (W-2) income if you actively participate and your MAGI is under $100k (phasing out to $0 by $150k); unused losses carry forward. On sale, claimed depreciation is recaptured at up to 25%, and gains may owe capital-gains tax (a 1031 exchange can defer both). Figures are a year-1 estimate at your 24.0% rate — not tax advice; consult a CPA.
Schools (NCES district)
- District
- Daingerfield-Lone Star ISD
- NCES district ID
- 4816180
- Math proficiency
- 24% ▼ -11.00%
- Reading proficiency
- 32% ▼ -4.00%
- Median HH income
- $39,097
- Composite
- 23.48/100
- National rank
- #7877
- State rank
- #679 of 826 in TX
Livability — Daingerfield
- Score
- 67/100
- State rank
- #536
- US rank
- #10463
Category grades
Schools grade is shown separately in the Schools card above.
Census & demographics
- Census place
- Daingerfield, TX
- Population (ZIP)
- 5,363
Population outlook (Morris County) Hauer SSP2
- Today (2025)
- 11,628 people
- By 2030
- 11,126 · -4.3%
- By 2040
- 10,181 · -12.4%
- By 2050
- 9,408 · -19.1%
- By 2075
- 8,268 · -28.9%
- By 2100
- 7,463 · -35.8%
Race, ethnicity, and origin ACS 2023
- Neighborhood character
- Diverse neighborhood (Simpson 0.60)
- Race & ethnicity
- White 59% Black 20% Hispanic / Latino 13% Two or more races 11% Asian 2%
- Hispanic origin (detail)
- Mexican 12%
- Common ancestry
- Scottish 4% Italian 2% Lithuanian 1%
- Foreign-born
- 6% · Canada, Vietnam
- Languages at home
- 87% English-only · Spanish 10% Vietnamese 1% Russian/Polish/Slavic 1%
Political lean MEDSL · Morris
- 2024 margin
- Solid R (+51.2) · D 24.1% · R 75.3%
- 2008→2024 swing
- -30.2pp toward R · 2008: -21.0pp · 2024: -51.2pp
- All cycles
- 2024: R+51.2 2020: R+39.4 2016: R+40.6 2012: R+26.7 2008: R+21.0
Not yet ingested
- Civics
- —
Market trends
- HPI YoY
- ▲ 3.11%
- Current HPI
- 186.7313
- Rent YoY
- —
- Metro
- —
- State GDP YoY
- ▲ 3.95%
- F500 in state
- 110
Industry mix (Fortune 500 HQ in TX)
| Industry | F500 HQs | Revenue |
|---|---|---|
| Energy | 16 | $1,198B |
|
||
| Technology | 5 | $198B |
|
||
| Engineering / Construction | 4 | $72B |
|
||
| Energy Services | 3 | $60B |
|
||
| Utilities | 3 | $41B |
|
||
| Healthcare | 2 | $330B |
|
||
Price history
+101.3% since first listed12 events — show timeline
- 2026-05-23 Listed $149,500 LAAR
- 2026-02-04 Price Changed $159,000 TBOR
- 2020-08-17 Sold (Public Records) — Public Records
- 2020-08-14 Sold (MLS) — GTAR
- 2020-07-08 Listed $119,000 GTAR
- 2020-01-27 Sold (Public Records) — Public Records
- 2020-01-22 Sold (MLS) — LAAR
- 2019-07-21 Listed $70,000 LAAR
- 2014-11-14 Sold (Public Records) — Public Records
- 2013-01-28 Sold (Public Records) $74,250 Public Records
- 1999-03-16 Sold (Public Records) — Public Records
- 1980-12-09 Sold (Public Records) — Public Records
Property tax history
+7.3%/yrLatest (2025): $2,293 · +10.7% YoY. Source: county tax records.
Cash-flow waterfall
monthlySold comps — $/sqft
last 12 mo · ≤1 miLoading sold comps…