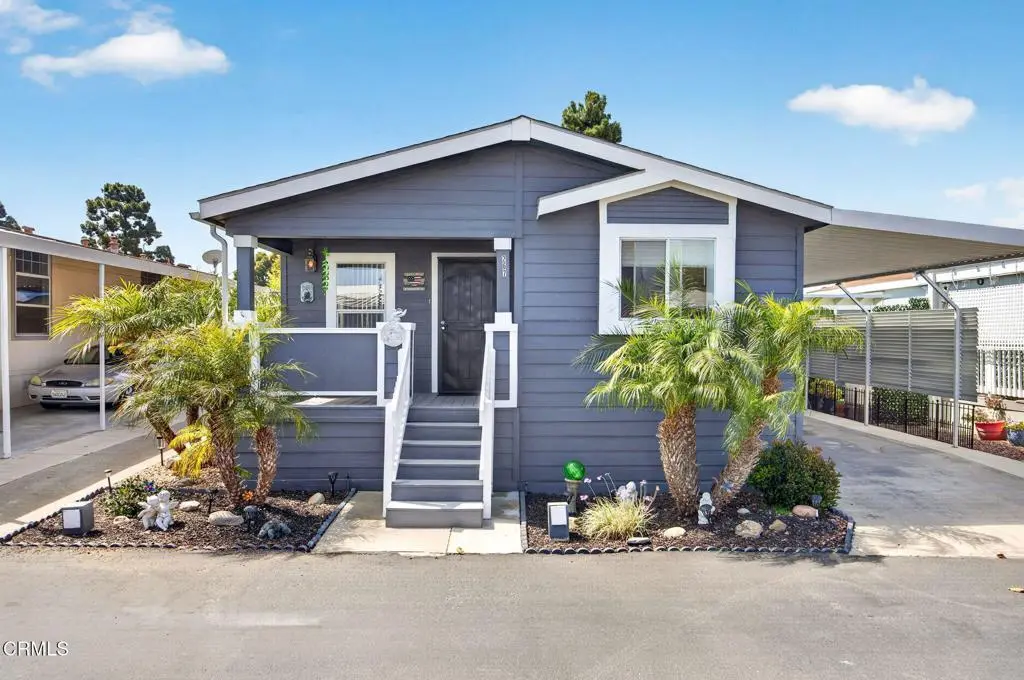
267 Rodgers St #267 · San Buenaventura (Ventura), CA
Flood risk 1/10 · Minimal
- FEMA flood zone
- X (unshaded)
- Chance of flooding over 30 yrs
- 0.0%
- Est. flood insurance / yr
- $507 – $1,088
Fire risk 2/10 · Minimal
- Est. fire insurance / yr
- $659 – $1,223
Heat risk 5/10 · Moderate
- Hot days now (above 86°F)
- 7 days/yr
- Hot days in 30 yrs
- 17 days/yr
Wind risk 1/10 · Minimal
- Chance of severe wind over 30 yrs
- —
Air-quality risk 7/10 · Major
- Unhealthy air days now
- 12 days/yr
- Unhealthy air days in 30 yrs
- 12 days/yr
Risk factors via First Street. Map © Google.
Why this score? — see what drove the D- grade
The composite is a weighted blend of 9 inputs, each scored 0–100. Each bar is that input's sub-score; the figure is the points it added to the 100-point composite (weight × sub-score).
- Cash flow +13.8/30.0
- DSCR +4.2/10.0
- Rent growth +4.0/5.0
- 1% rule +3.9/10.0
- Schools +3.7/10.0
- ARV discount +2.7/15.0
- Livability +2.5/5.0
- Condition / age +2.5/5.0
- Appreciation +0.0/10.0
$430,000
🖨 Deal sheet (PDF) 📄 Offer letter ✓ Due diligence
Listing remarks
Welcome home to this beautifully maintained 3-bedroom, 2-bath manufactured home located in a desirable family park in Ventura. Move-in ready and filled with natural light, this spacious home features vaulted ceilings, an open-concept layout, and a bright kitchen with ample cabinet and counter space. A separate laundry room adds convenience, while the attached two-car carport provides easy parking. The generous primary suite offers a walk-in closet plus an additional closet, providing exceptional storage. The washer, dryer, and refrigerator can stay making your move even easier. Relax on the inviting front porch and enjoy Ventura's year-round coastal climate. Additional upgrades include a ne
Key facts
- Bright kitchen
- Walk-in closet
- Ample cabinet space
Tags
Property features AI
Finance
- Other: Directions: 101 to Telephone, to Portola, to Thille, to Gershwin to Rodgers
- Financial info: Pets allowed with size and number limits
- HOA & community: Land lease in park: $927 monthly (seller source); Manager approval required for residency; Park name: Imperial
Exterior
- Parking: Carport parking (2 spaces); Driveway parking
- Utilities: Public sewer; District/public water
- Home design: Mobile home (remains on site), double-wide (24' x 56'); Single-story; Located in a suburban mobile home park (Imperial MHP - 0287)
- Construction: Mobile construction
- Exterior features: Front porch; Patio; Association pool; Shed
Interior
- Kitchen: Refrigerator; Gas range; Dishwasher; Tankless water heater; Water softener
- Bedrooms: Primary bedroom on main level; All bedrooms on main level
- Flooring: Laminated flooring
- Bathrooms: Main floor full bath with bathtub
- Heating & cooling: Forced air heating; Central cooling
- Interior features: One-level entry; One story; Community/association spa
- Laundry & utility: Inside laundry in a dedicated room
Neighborhood map
What this means for you Summary
Snapshot
- This is a 3-bed/?-bath manufactured listed at $430k.
Deal economics
- At list price, monthly cash flow is $41 ($495/yr) — positive.
- The deal already cash-flows at list — no discount required.
- To meet the 1% rule (rent ≥ 1% of price), the offer needs to be $381k (11.3% below list).
- Recommended offer: $381k (11.3% below list) — sets the bar for 1% rule.
- Cap rate 6.4% vs local median 2.4% in San Buenaventura (Ventura) — top-decile yield for the area; either an underpriced asset or a hidden risk that comps aren't pricing in. Stress-test before assuming the spread holds.
Location & tenants
- Location reads: area grade D — affects rentability + tenant quality, not the cash-flow math above.
- Ventura Unified (urban): math 33% / reading 48% proficiency, ranked #218 of 517 in CA (top 42%) — families likely to look elsewhere, expect single-tenant / working-renter base with shorter leases.
- Zoned schools: Elmhurst Elementary (math 22% / reading 32%, grade F, #917 of 1,571 statewide, top 60%, 362 students, 68% FRL); Anacapa Middle (math 19% / reading 36%, grade F, #239 of 498 statewide, top 48%, 691 students, 67% FRL); Buena High (math 38% / reading 67%, grade C-, #289 of 1,170 statewide, top 25%, 1,710 students, 53% FRL) — zoned schools average 63% FRL vs 40% district-wide (23 pts higher); higher-poverty schools than district average — tighter screening recommended.
- Market conditions: Rents rising fast (+5.9%/yr); 91 active listings in the ZIP; 20 comparable units currently listed for rent nearby; rentals at typical pace (median 26d on market — plan ~3-4 weeks tenant-placement turnaround); 45% of comp listings sitting > 30 days — soft ceiling on asking rent; solid renter incomes; 1,759 units permitted in Ventura County in 2024 (1,196 in 5+ unit buildings).
- This rent runs 44% of the median local income ($104k/yr) — at the standard rent-burdened threshold; future hikes will face affordability resistance.
Forward outlook
- Local home prices are declining (-3.0%/yr); year-one equity from $3k of loan paydown is wiped out by about $13k of value loss. Plan a longer hold.
- Ventura County population projected at +4% by 2050 — modest demand growth; plan on rents tracking national, not racing it.
Negotiation context
- Only 9 days on market — expect competitive offers; lowballing is unlikely to land.
- 3 sale attempts since 16y ago with the ask held roughly flat each time — persistent listings suggest the price (not the market) is what's stuck; bring a comps-based counter.
Risks & watch-outs
- Climate carrying-cost: extreme-heat days projected 7→17/yr by 2055 (HVAC capex compounding) — expect insurance premiums to compound above CPI over the hold.
Questions for the listing agent
- Is there a deadline driving the sale (1031 exchange, divorce, estate, relocation)? That informs how much negotiation room exists.
- The area grade is low — what's the realistic commute time and amenity access for the typical tenant pool here? Any planned neighborhood developments (good or bad) we should know about?
- What's the average days-on-market for RENTAL listings here right now (not sales)? A rising rental-DOM trend means longer vacancies and softer asking-rent achievability than the comps imply.
- What's the recent tenant-quality profile in this submarket — average credit score on applications, eviction rate, late-payment / NSF rate, and stable-employment percentage? A property-management company in the area should have these aggregated.
- How much new for-sale + rental construction is in the pipeline within 1–3 miles? Heavy new supply typically softens prices + rents 12–24 months out; constrained supply supports both.
Investment metrics
- 1% rule
- 0.89% ✗
- Cap rate
- 6.41%
- Cash-on-cash
- 0.41%
- DSCR
- 1.02
- GRM
- 9.4
CMA / ARV
- ARV (on-the-fly)
- $388,584
- Comps found
- 12
Show comp detail 12 sales within ~0.75 mi
| Address | Dist | Beds/Ba | Sqft | Sold | Price | $/sf | Match |
|---|---|---|---|---|---|---|---|
| 101 Gay Dr Unit . | 0.17mi | 3/2.0 | 1,568 (+4%) | 2mo | $480,000 | $306 | 84 |
| 27 Debussy Ln #27 | 0.09mi | 3/2.0 | 1,568 (+4%) | 8mo | $450,000 | $287 | 83 |
| 73 Gay Dr | 0.19mi | 3/2.0 | 1,440 (-5%) | 8mo | $150,000 | $104 | 77 |
| 24 Debussy Ln #24 | 0.13mi | 2/2.0 (-1) | 1,344 (-11%) | 7mo | $355,000 | $264 | 65 |
| 4700 Aurora Dr #75 | 0.51mi | 2/2.0 (-1) | 1,440 (-5%) | 4mo | $355,000 | $247 | 60 |
| 75 Copland Cir #75 | 0.59mi | 2/2.0 (-1) | 1,440 (-5%) | 5mo | $261,405 | $182 | 56 |
| 4700 Aurora Dr #129 | 0.46mi | 2/2.0 (-1) | 1,344 (-11%) | 1mo | $365,000 | $272 | 54 |
| 80 Copland Cir #80 | 0.58mi | 2/2.0 (-1) | 1,440 (-5%) | 7mo | $240,000 | $167 | 54 |
| 79 Copland Cir #79 | 0.59mi | 2/2.0 (-1) | 1,440 (-5%) | 8mo | $225,000 | $156 | 53 |
| 54 Copland Cir #54 | 0.60mi | 2/2.0 (-1) | 1,344 (-11%) | 1mo | $345,000 | $257 | 48 |
| 4700 Aurora Dr #16 | 0.57mi | 2/2.0 (-1) | 1,344 (-11%) | 6mo | $373,500 | $278 | 45 |
| 4499 Copland Dr #34 | 0.63mi | 2/2.0 (-1) | 1,300 (-14%) | 13mo | $310,000 | $238 | 32 |
Match score weights: distance 35% · size 25% · config 20% · recency 20%. Top-matched comps best support the ARV.
Projected returns pro-forma
-3.0% appreciation · 5.88% rent growth · sell at horizon
- IRR
- -12.5%
- Equity multiple
- 0.54×
- Total profit
- $-55,625
- Equity at exit
- $64,114
- IRR
- 0.5%
- Equity multiple
- 1.04×
- Total profit
- $4,676
- Equity at exit
- $37,179
Cash invested: $120,400 (down + closing). Projections, not guarantees.
Landlord ↔ Tenant lean methodology
- Overall (STATE)
- 18 Strongly Tenant-Friendly
- State California
- 18 Strongly Tenant-Friendly · D+13
- County
- — inherits STATE
- City
- — inherits STATE
ZIP-level market 93003
- Rents YoY
- 5.9%
- Active inventory
- 91
- Price-to-rent
- 9.4×
Monthly cashflow live
- Estimated rent
- $3,814 high interval (Pro) →
- Mortgage (P&I)
- −$2,255
- Tax est. 1.5%
- −$538 /mo · $6,450/yr
- Insurance
- −$179
- HOA
- −$0
- Vacancy / Maint / Mgmt
- −$801
- Net cashflow
- $41
Break-even live
Sensitivity live
| Price | -10% $338 | -5% $190 | +0% $41 | +5% $-107 | +10% $-256 |
|---|---|---|---|---|---|
| Rent | -10% $-260 | -5% $-109 | +0% $41 | +5% $192 | +10% $343 |
| Rate | -1.0pp $258 | -0.5pp $151 | base $41 | +0.5pp $-70 | +1.0pp $-184 |
UW: 25.0% down · 7.5% · 30yr · 1.5% tax · 5.0% vac · 8.0% maint · 8.0% mgmt
Financing live
Cash to close
- Down payment
- $107,500
- Closing costs
- $12,900
- Reserves months
- —
- Total cash needed
- —
Loan-product check · same deal, 3 products live
Conventional
25% down · 7.5% · 30yr
- Down + closing
- —
- Monthly P&I
- —
- Monthly cashflow
- —
- DSCR
- —
- Eligible?
- —
Personal DTI + credit; lowest rate.
DSCR
20% down · 8.5% · 30yr
- Down + closing
- —
- Monthly P&I
- —
- Monthly cashflow
- —
- DSCR
- —
- Eligible?
- —
No personal income docs; deal must DSCR.
Hard money
10% down · 12.0% · 12mo
- Down + closing
- —
- Monthly P&I
- —
- Monthly cashflow
- —
- DSCR
- —
- Eligible?
- —
Short-term bridge; refi at stabilization.
Rent comps 20 comps
| Address | Beds | Baths | Sqft | Rent | $/sqft | DOM | Units | Dist |
|---|---|---|---|---|---|---|---|---|
| 930 Pacific Strand Pl Ventura, CA | 1.0–2.0 | 1.0–2.0 | 946 | $3,245 | $3.43 | 3d | 11 | 0.24mi |
| 4888 Ellington St Ventura, CA | 3.0 | 2.0 | 1163 | $3,650 | $3.14 | 17d | 1 | 0.28mi |
| 4729 Ellington St Ventura, CA | 3.0 | 2.5 | 1609 | $3,800 | $2.36 | 4d | 1 | 0.37mi |
| 329 Bucknell Ave Ventura, CA | 3.0 | 2.0 | 1570 | $5,000 | $3.18 | 45d | 1 | 0.38mi |
| 848 Weber Cir Ventura, CA | 1.0–2.0 | 1.0–2.0 | 845 | $4,169 | $4.93 | 3d | 47 | 0.38mi |
| 352 Paine Ave Ventura, CA | 4.0 | 2.0 | 2056 | $7,900 | $3.84 | 45d | 1 | 0.41mi |
| 1300 Saratoga Ave Ventura, CA | 2.0–3.0 | 1.0–2.0 | 1004 | $2,750 | $2.74 | 45d | 2 | 0.50mi |
| 1252 San Simeon Ct #6 Ventura, CA | 3.0 | 2.5 | 1226 | $3,400 | $2.77 | 45d | 1 | 0.55mi |
| 138 S Bryn Mawr St #6 Ventura, CA | 3.0 | 1.5 | 1255 | $2,995 | $2.39 | 16d | 1 | 0.62mi |
| 138 S Bryn Mawr St #6 Ventura, CA | 3.0 | 1.5 | 1255 | $3,250 | $2.59 | 45d | 1 | 0.62mi |
| 5651 N Bryn Mawr St Ventura, CA | 4.0 | 3.0 | 1911 | $4,500 | $2.35 | 45d | 1 | 0.95mi |
| 6160 Promontory Ln Ventura, CA | 1.0–2.0 | 1.0–2.0 | 1038 | $3,495 | $3.37 | 3d | 3 | 1.08mi |
| 3700 Dean Dr Ventura, CA | 2.0 | 2.0 | 1173 | $2,925 | $2.49 | 45d | 2 | 1.16mi |
| 3700 Dean Dr Ventura, CA | 2.0 | 2.0 | 1178 | $2,900 | $2.46 | 5d | 2 | 1.16mi |
| 1220 Johnson Dr #108 Ventura, CA | 2.0 | 2.0 | 1440 | $3,200 | $2.22 | 25d | 1 | 1.33mi |
| 1220 Johnson Dr #108 Ventura, CA | 2.0 | 2.0 | 1440 | $3,200 | $2.22 | 45d | 1 | 1.33mi |
| 1220 Johnson Dr #108 Ventura, CA | 2.0 | 2.0 | 1440 | $2,975 | $2.07 | 16d | 1 | 1.33mi |
| 3357 Rexford St Ventura, CA | 2.0 | 2.0 | 1050 | $2,675 | $2.55 | 3d | 1 | 1.50mi |
| 3357 Rexford St Ventura, CA | 2.0 | 2.0 | 1050 | $2,675 | $2.55 | 4d | 1 | 1.50mi |
| 3357 Rexford St Ventura, CA | 2.0 | 2.0 | 1050 | $2,795 | $2.66 | 45d | 1 | 1.50mi |
Listing history 7 events
-
2026-06-21days on market $430,000 Active 9 DOM
-
2026-06-18days on market $430,000 Active 6 DOM
-
2026-06-17days on market $430,000 Active 5 DOM
-
2026-06-16days on market $430,000 Active 4 DOM
-
2026-06-15days on market $430,000 Active 3 DOM
-
2026-06-13remarks 699-char remark
-
2026-06-13$430,000 Active 1 DOM
ⓘ Source: listings_history table (triggers on properties + properties_extension) + one-shot
backfill from property_details.listing_events for pre-trigger history.
Climate risk First Street
- Flood 1/10 Low FEMA zone X (unshaded) · 0% chance over 30 yrs
- Wildfire 2/10 Low
- Heat 5/10 Major 7 d/yr ≥86°F today · 17 d/yr by 30 yrs out
- Wind 1/10 Low
- Air quality 7/10 Severe 12 unhealthy d/yr today · 12 by 30 yrs out
Nearby sold comps map
Loading sold comps map…
Walkable amenities ~0.75 mi
Loading nearby amenities…
Taxation est. · year 1
- Rental income
- $45,765
- − Mortgage interest
- −$24,087
- − Property taxes
- −$6,450
- − Insurance
- −$2,150
- − Repairs & maintenance
- −$3,661
- − Management
- −$3,661
- − Depreciation
- −$12,509
- Taxable loss
- −$6,753
- Est. tax savings @ 24.0%
- +$1,621
- After-tax cash flow
- $2,116/yr
For passive investors: Depreciation is non-cash, so a rental often shows a tax loss while cash-flowing — sheltering income. Rental losses are passive: they offset passive income freely, and up to $25,000/yr can offset ordinary (W-2) income if you actively participate and your MAGI is under $100k (phasing out to $0 by $150k); unused losses carry forward. On sale, claimed depreciation is recaptured at up to 25%, and gains may owe capital-gains tax (a 1031 exchange can defer both). Figures are a year-1 estimate at your 24.0% rate — not tax advice; consult a CPA.
Schools (NCES district)
- District
- Ventura Unified
- NCES district ID
- 0640980
- Math proficiency
- 33% ▼ -11.00%
- Reading proficiency
- 48% ▼ -7.00%
- Median HH income
- $67,362
- Composite
- 36.51/100
- National rank
- #4646
- State rank
- #218 of 517 in CA
Livability — San Buenaventura (Ventura)
No livability data for this city. (Only ~50 U.S. cities are tracked.)
Census & demographics
- Census place
- San Buenaventura (Ventura), CA
- County
- Ventura County · 829,955 people
- City population
- 83,837
- Metro
- Oxnard-Thousand Oaks-Ventura, CA
- Population (ZIP)
- 52,906
- Household income
- $103,761
- Rent vs Own
- Severe rent burden
- 2414.0
Population outlook (Ventura County) Hauer SSP2
- Today (2025)
- 895,754 people
- By 2030
- 912,134 · +1.8%
- By 2040
- 931,454 · +4.0%
- By 2050
- 934,609 · +4.3%
- By 2075
- 924,899 · +3.3%
- By 2100
- 864,712 · -3.5%
Race, ethnicity, and origin ACS 2023
- Neighborhood character
- Diverse neighborhood (Simpson 0.56)
- Race & ethnicity
- White 57% Hispanic / Latino 33% Two or more races 15% Asian 4% Black 1%
- Hispanic origin (detail)
- Mexican 27%
- Common ancestry
- Lithuanian 3% Italian 2% Slovak 2%
- Foreign-born
- 12% · Canada, Jamaica, China
- Languages at home
- 78% English-only · Spanish 17% Other Indo-European 1% Arabic 1%
Political lean MEDSL · Ventura
- 2024 margin
- D (+15.1) · D 56.1% · R 41.0% · Other 2.9%
- 2008→2024 swing
- +2.8pp toward D · 2008: 12.3pp · 2024: 15.1pp
- All cycles
- 2024: D+15.1 2020: D+21.1 2016: D+16.8 2012: D+5.3 2008: D+12.3
Not yet ingested
- Civics
- —
Market trends
- HPI YoY
- ▼ -1074.56%
- Current HPI
- 308.6282
- Rent YoY
- ▲ 5.88%
- Metro
- Oxnard-Thousand Oaks-Ventura, CA
- State GDP YoY
- ▲ 3.21%
- F500 in state
- 116
Industry mix (Fortune 500 HQ in CA)
| Industry | F500 HQs | Revenue |
|---|---|---|
| Technology | 27 | $1,492B |
|
||
| Financial Services | 3 | $174B |
|
||
| Retail | 3 | $44B |
|
||
| Insurance | 3 | $26B |
|
||
| Media / Entertainment | 2 | $115B |
|
||
| Pharmaceuticals / Biotech | 2 | $62B |
|
||
Price history
+196.8% since first listed8 events — show timeline
- 2026-06-12 Listed $430,000 CRMLS
- 2011-05-19 Listing Removed — CRMLS
- 2011-04-02 Price Changed $119,900 CRMLS
- 2011-01-13 Relisted — CRMLS
- 2011-01-04 Listing Removed — CRMLS
- 2010-11-10 Price Changed $129,900 CRMLS
- 2010-10-14 Price Changed $142,500 CRMLS
- 2010-09-02 Listed $144,900 CRMLS
Cash-flow waterfall
monthlySold comps — $/sqft
last 12 mo · ≤1 miLoading sold comps…