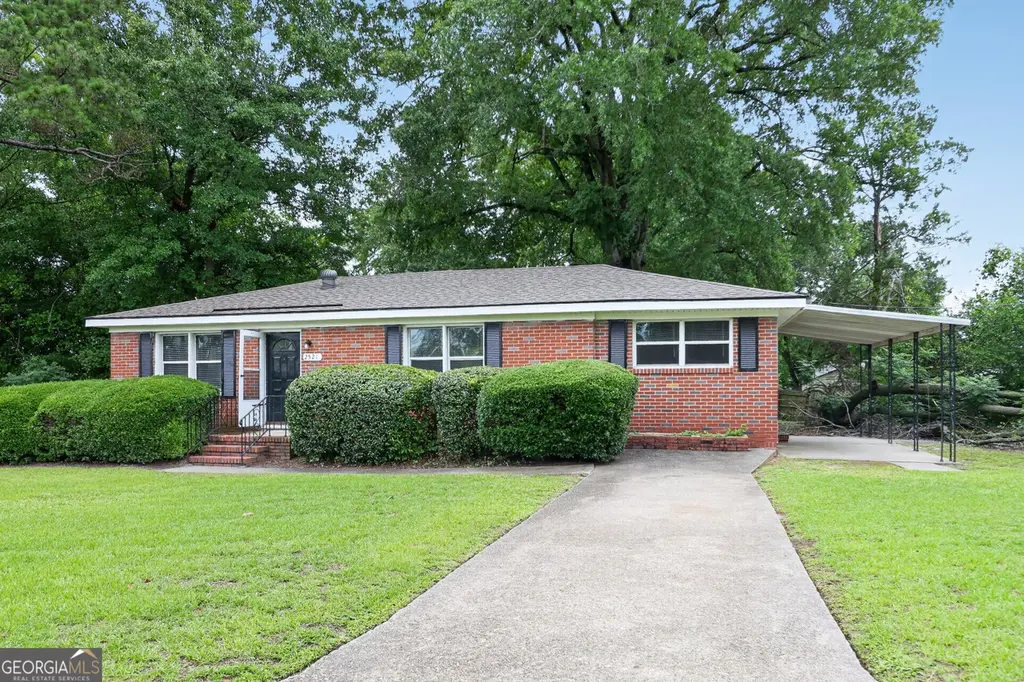
2521 Briarwood Ave · Augusta-Richmond County consolidated government (balance), GA
Flood risk 1/10 · Minimal
- FEMA flood zone
- X (unshaded)
- Chance of flooding over 30 yrs
- 0.0%
- Est. flood insurance / yr
- $507 – $1,088
Fire risk 1/10 · Minimal
- Est. fire insurance / yr
- $963 – $1,789
Heat risk 8/10 · Major
- Hot days now (above 109°F)
- 7 days/yr
- Hot days in 30 yrs
- 18 days/yr
Wind risk 6/10 · Moderate
- Chance of severe wind over 30 yrs
- 69.0%
Air-quality risk 3/10 · Minor
- Unhealthy air days now
- 3 days/yr
- Unhealthy air days in 30 yrs
- 3 days/yr
Risk factors via First Street. Map © Google.
Why this score? — see what drove the C+ grade
The composite is a weighted blend of 9 inputs, each scored 0–100. Each bar is that input's sub-score; the figure is the points it added to the 100-point composite (weight × sub-score).
- Cash flow +25.8/30.0
- ARV discount +12.3/15.0
- DSCR +8.6/10.0
- 1% rule +6.5/10.0
- Livability +2.5/5.0
- Condition / age +2.5/5.0
- Rent growth +2.4/5.0
- Schools +1.3/10.0
- Appreciation +0.0/10.0
$114,900
🖨 Deal sheet (PDF) 📄 Offer letter ✓ Due diligence
Listing remarks MLS
Good fixer-upper. Has great potential with TLC. Good for investor or fix up to rent.
Key facts
- Dining area
- Eat-in kitchen
- Spacious living room
Tags
Property features AI
Finance
- Other: Accepted financing: Cash, Conventional, FHA, VA
- HOA & community: No HOA
Exterior
- Parking: Open parking with a parking pad
- Utilities: Public water; Public sewer; Other utilities
- Home design: Single-family house; One story; Resale property
- Construction: Brick construction; Composition roof; Slab foundation; Built in 1954
- Exterior features: Level lot
Interior
- Kitchen: Dishwasher; Refrigerator; Pantry
- Bedrooms: 3 bedrooms on the main level
- Flooring: Carpet; Vinyl; Hardwood
- Bathrooms: 1 full bathroom on the main level
- Heating & cooling: Central heating; Central air conditioning
- Interior features: Dining room and living room combined; Pantry
- Laundry & utility: Laundry closet; Electric water heater
Neighborhood map
What this means for you Summary
Snapshot
- This is a 3-bed/1.0-bath single-family listed at $115k.
Deal economics
- At list price, monthly cash flow is $277 ($3k/yr) — positive.
- The deal already cash-flows at list — no discount required.
- Meets the 1% rule at list price ($1k rent vs $115k).
- Recommended offer: $113k (1.5% below list) — sets the bar for market timing.
- Cap rate 9.2% vs local median 5.3% in Augusta-Richmond County consolidated government (balance) — top-decile yield for the area; either an underpriced asset or a hidden risk that comps aren't pricing in. Stress-test before assuming the spread holds.
Location & tenants
- Location reads: area grade C — affects rentability + tenant quality, not the cash-flow math above.
- Richmond County (urban): math 12% / reading 20% proficiency, ranked #154 of 174 in GA (top 88%) — low school quality limits family demand, transient renter base, plan for 1-2y turnover; 72% free/reduced lunch — lower-income household profile, screen leases tightly.
- Zoned schools: Terrace Manor Elementary School (math 2% / reading 8%, grade F, #1,160 of 1,228 statewide, top 98%, 254 students, 98% FRL); Murphey Middle School (math 0% / reading 6%, grade F, #469 of 470 statewide, top 100%, 635 students, 98% FRL); Josey High School (math 2% / reading 5%, grade F, #413 of 424 statewide, top 99%, 779 students, 98% FRL) — zoned schools average 98% FRL vs 72% district-wide (26 pts higher); higher-poverty schools than district average — tighter screening recommended.
- Zoned-school proficiency averages 4% at this address vs 16% district-wide (-12 pts) — the specific schools serving this property underperform the Richmond County average; the district grade overstates school quality for this exact location.
- Market conditions: Rents soft (-0.2%/yr); 364 active listings in the ZIP; 18 comparable units currently listed for rent nearby; rentals lingering (median 45d on market — plan ~5-8 weeks vacancy on turnover, expect pricing pressure); 61% of comp listings sitting > 30 days — soft ceiling on asking rent; 561 units permitted in Richmond County in 2024 (0 in 5+ unit buildings).
Forward outlook
- Local home prices are declining (-3.0%/yr); year-one equity from $794 of loan paydown is wiped out by about $3k of value loss. Plan a longer hold.
- Richmond County population projected to shrink 5% by 2050 — rents likely to lag national; underwrite the cash flow, not the appreciation.
Negotiation context
- It's been on market 22 days — a 2% lower offer ($113k) is reasonable based on typical stale-listing flexibility.
- 5 sale attempts since 20y ago with the ask held roughly flat each time — persistent listings suggest the price (not the market) is what's stuck; bring a comps-based counter.
- Current owner paid $90k; 28% above their basis — modest negotiation headroom, anchor on the comps not their cost.
Risks & watch-outs
- Watch-outs: built in 1954 — expect roof / HVAC / electrical / plumbing capex.
- Climate carrying-cost: major wind risk, 69% chance of damaging wind over 30y; extreme-heat days projected 7→18/yr by 2055 (HVAC capex compounding) — expect insurance premiums to compound above CPI over the hold.
Questions for the listing agent
- Built in 1954 — when were the roof, HVAC, electrical panel, plumbing, and water heater last replaced?
- Is there a deadline driving the sale (1031 exchange, divorce, estate, relocation)? That informs how much negotiation room exists.
- What's the average days-on-market for RENTAL listings here right now (not sales)? A rising rental-DOM trend means longer vacancies and softer asking-rent achievability than the comps imply.
- What's the recent tenant-quality profile in this submarket — average credit score on applications, eviction rate, late-payment / NSF rate, and stable-employment percentage? A property-management company in the area should have these aggregated.
- How much new for-sale + rental construction is in the pipeline within 1–3 miles? Heavy new supply typically softens prices + rents 12–24 months out; constrained supply supports both.
Investment metrics
- 1% rule
- 1.15% ✓
- Cap rate
- 9.19%
- Cash-on-cash
- 10.35%
- DSCR
- 1.46
- GRM
- 7.2
CMA / ARV
- ARV (on-the-fly)
- $128,592
- Comps found
- 12
Show comp detail 12 sales within ~0.75 mi
| Address | Dist | Beds/Ba | Sqft | Sold | Price | $/sf | Match |
|---|---|---|---|---|---|---|---|
| 2524 Elderberry Dr | 0.09mi | 3/1.0 | 1,200 (+6%) | 9mo | $129,900 | $108 | 77 |
| 1825 Medlar St | 0.06mi | 3/1.5 | 1,000 (-11%) | 2mo | $97,000 | $97 | 75 |
| 3207 E Gerald Dr | 0.35mi | 3/2.0 | 1,152 (+2%) | 3mo | $179,000 | $155 | 74 |
| 2019 Dunham Ct | 0.37mi | 3/1.0 | 1,200 (+6%) | 1mo | $104,900 | $87 | 72 |
| 3209 E Gerald Dr | 0.36mi | 3/2.0 | 1,221 (+8%) | 4mo | $138,700 | $114 | 62 |
| 2030 Virginia Ave | 0.63mi | 3/2.0 | 1,189 (+5%) | 5mo | $159,900 | $134 | 53 |
| 1907 Virginia Ave | 0.73mi | 3/2.0 | 1,133 (+0%) | 11mo | $128,900 | $114 | 52 |
| 2520 Reese Ave | 0.69mi | 2/1.0 (-1) | 1,073 (-5%) | 5mo | $76,000 | $71 | 51 |
| 2707 Smith Dr | 0.53mi | 3/2.0 | 1,243 (+10%) | 11mo | $176,000 | $142 | 45 |
| 2126 Harding Rd | 0.68mi | 3/2.0 | 1,260 (+12%) | 3mo | $155,000 | $123 | 42 |
| 2021 Virginia Ave | 0.64mi | 3/1.5 | 1,296 (+15%) | 3mo | $78,000 | $60 | 41 |
| 3326 Sylvester Dr | 0.69mi | 3/1.0 | 960 (-15%) | 5mo | $149,900 | $156 | 39 |
Match score weights: distance 35% · size 25% · config 20% · recency 20%. Top-matched comps best support the ARV.
Projected returns pro-forma
-3.0% appreciation · 0.0% rent growth · sell at horizon
- IRR
- -4.1%
- Equity multiple
- 0.85×
- Total profit
- $-4,826
- Equity at exit
- $17,132
- IRR
- 1.8%
- Equity multiple
- 1.11×
- Total profit
- $3,577
- Equity at exit
- $9,934
Cash invested: $32,172 (down + closing). Projections, not guarantees.
Landlord ↔ Tenant lean methodology
- Overall (STATE)
- 90 Strongly Landlord-Friendly
- State Georgia
- 90 Strongly Landlord-Friendly · R+3
- County
- — inherits STATE
- City
- — inherits STATE
ZIP-level market 30906
- Home prices YoY
- -21.6%
- Rents YoY
- -0.2%
- Active inventory
- 364
- Price-to-rent
- 7.2×
Monthly cashflow live
- Estimated rent
- $1,323 high interval (Pro) →
- Mortgage (P&I)
- −$603
- Tax from tax record
- −$117 /mo · $1,410/yr
- Insurance
- −$48
- HOA
- −$0
- Vacancy / Maint / Mgmt
- −$278
- Net cashflow
- $277
Break-even live
Sensitivity live
| Price | -10% $342 | -5% $310 | +0% $277 | +5% $245 | +10% $212 |
|---|---|---|---|---|---|
| Rent | -10% $173 | -5% $225 | +0% $277 | +5% $330 | +10% $382 |
| Rate | -1.0pp $335 | -0.5pp $307 | base $277 | +0.5pp $248 | +1.0pp $217 |
UW: 25.0% down · 7.5% · 30yr · 1.5% tax · 5.0% vac · 8.0% maint · 8.0% mgmt
Financing live
Cash to close
- Down payment
- $28,725
- Closing costs
- $3,447
- Reserves months
- —
- Total cash needed
- —
Loan-product check · same deal, 3 products live
Conventional
25% down · 7.5% · 30yr
- Down + closing
- —
- Monthly P&I
- —
- Monthly cashflow
- —
- DSCR
- —
- Eligible?
- —
Personal DTI + credit; lowest rate.
DSCR
20% down · 8.5% · 30yr
- Down + closing
- —
- Monthly P&I
- —
- Monthly cashflow
- —
- DSCR
- —
- Eligible?
- —
No personal income docs; deal must DSCR.
Hard money
10% down · 12.0% · 12mo
- Down + closing
- —
- Monthly P&I
- —
- Monthly cashflow
- —
- DSCR
- —
- Eligible?
- —
Short-term bridge; refi at stabilization.
Rent comps 18 comps
| Address | Beds | Baths | Sqft | Rent | $/sqft | DOM | Units | Dist |
|---|---|---|---|---|---|---|---|---|
| 1822 Catalina Dr Augusta, GA | 3.0 | 1.0 | 888 | $1,350 | $1.52 | 24d | 1 | 0.18mi |
| 1822 Catalina Dr Augusta, GA | 3.0 | 1.0 | 888 | $1,350 | $1.52 | 44d | 1 | 0.18mi |
| 2932 Abelia Dr Augusta, GA | 3.0 | 1.0 | 888 | $1,100 | $1.24 | 44d | 1 | 0.34mi |
| 3211 Kevin Dr Augusta, GA | 3.0 | 1.5 | 1005 | $1,275 | $1.27 | 24d | 1 | 0.41mi |
| 3211 Kevin Dr Augusta, GA | 3.0 | 1.5 | 1005 | $1,275 | $1.27 | 44d | 1 | 0.41mi |
| 2119 Lumpkin Rd Augusta, GA | 2.0 | 1.0–1.5 | 974 | $912 | $0.94 | 22d | 6 | 0.64mi |
| 2235 Woodward Ave Augusta, GA | 2.0 | 1.0 | 773 | $895 | $1.16 | 45d | 1 | 0.89mi |
| 1915 Dianne Dr Augusta, GA | 3.0 | 1.0 | 1196 | $1,236 | $1.03 | 44d | 1 | 0.91mi |
| 2006 Denmark Dr Augusta, GA | 3.0 | 1.0 | 1033 | $1,100 | $1.06 | 45d | 1 | 0.98mi |
| 2006 Denmark Dr Augusta, GA | 3.0 | 1.0 | 1033 | $1,100 | $1.06 | 44d | 1 | 0.98mi |
| 2910 Richmond Hill Rd Augusta, GA | 2.0 | 1.0 | 1000 | $900 | $0.90 | 44d | 3 | 0.99mi |
| 1916 Preston Dr Augusta, GA | 3.0 | 1.5 | 1134 | $1,055 | $0.93 | 44d | 1 | 1.02mi |
| 2111 Cadden Rd Augusta, GA | 3.0 | 1.0 | 1100 | $1,150 | $1.05 | 44d | 1 | 1.07mi |
| 2204 Sandra Ct Augusta, GA | 4.0 | 2.0 | 1325 | $1,585 | $1.20 | 24d | 1 | 1.10mi |
| 2401 Norfolk St Augusta, GA | 2.0 | 1.0 | 991 | $949 | $0.96 | 44d | 1 | 1.11mi |
| 2605 Shalimar Dr Augusta, GA | 4.0 | 2.0 | 1444 | $1,500 | $1.04 | 22d | 1 | 1.39mi |
| 2020 Garr Dr Augusta, GA | 3.0 | 1.0 | 1100 | $1,200 | $1.09 | 15d | 1 | 1.44mi |
| 2205 Southgate Dr Augusta, GA | 1.0–2.0 | 1.0–1.5 | 770 | $1,099 | $1.43 | 15d | 7 | 1.46mi |
Listing history 26 events
-
2026-06-18days on market $114,900 Active 22 DOM
-
2026-06-17days on market $114,900 Active 21 DOM
-
2026-06-16days on market $114,900 Active 20 DOM
-
2026-06-15days on market $114,900 Active 19 DOM
-
2026-06-14days on market $114,900 Active 17 DOM
-
2026-06-10statusdays on market $114,900 Active 14 DOM
-
2026-06-09days on market $114,900 New 13 DOM
-
2026-06-08days on market $114,900 New 12 DOM
-
2026-06-07days on market $114,900 New 11 DOM
-
2026-06-03days on market $114,900 New 7 DOM
-
2026-06-02days on market $114,900 New 6 DOM
-
2026-06-01days on market $114,900 New 5 DOM
-
2026-05-31days on market $114,900 New 4 DOM
-
2026-05-30days on market $114,900 New 3 DOM
-
2026-05-27$114,900 New
-
2026-05-11historical
-
2026-02-13price $55,900 84-char remark
Show marketing remark (84 chars)
Good fixer-upper. Has great potential with TLC. Good for investor or fix up to rent.
-
2022-09-17historical 84-char remark
Show marketing remark (84 chars)
Good fixer-upper. Has great potential with TLC. Good for investor or fix up to rent.
-
2022-06-03$120,000 84-char remark
Show marketing remark (84 chars)
Good fixer-upper. Has great potential with TLC. Good for investor or fix up to rent.
-
2022-06-03soldstatus $90,000
Show marketing remark (84 chars)
Good fixer-upper. Has great potential with TLC. Good for investor or fix up to rent.
-
2021-10-29historical
-
2021-05-17$120,000
-
2021-05-17$120,000
-
2006-11-08soldstatus $46,000 Closed 84-char remark
Show marketing remark (84 chars)
Good fixer-upper. Has great potential with TLC. Good for investor or fix up to rent.
-
2006-11-08soldstatus $46,000
Show marketing remark (84 chars)
Good fixer-upper. Has great potential with TLC. Good for investor or fix up to rent.
-
2006-05-10$55,900
ⓘ Source: listings_history table (triggers on properties + properties_extension) + one-shot
backfill from property_details.listing_events for pre-trigger history.
Tax reassessment forecast GA · Resets to sale price
- Current annual tax
- $1,410 · $117/mo
- Projected year-2 tax
- $1,410 · $117/mo
- Expected delta
- $0/yr ($0/mo · 0.0%)
ⓘ Screening estimate from a state-policy table — verify with the county assessor before closing.
Climate risk First Street
- Flood 1/10 Low FEMA zone X (unshaded) · 0% chance over 30 yrs
- Wildfire 1/10 Low
- Heat 8/10 Severe 7 d/yr ≥109°F today · 18 d/yr by 30 yrs out
- Wind 6/10 Major 69% chance of damaging wind over 30 yrs
- Air quality 3/10 Moderate 3 unhealthy d/yr today · 3 by 30 yrs out
Nearby sold comps map
Loading sold comps map…
Walkable amenities ~0.75 mi
Loading nearby amenities…
Taxation est. · year 1
- Rental income
- $15,878
- − Mortgage interest
- −$6,436
- − Property taxes
- −$1,410
- − Insurance
- −$574
- − Repairs & maintenance
- −$1,270
- − Management
- −$1,270
- − Depreciation
- −$3,343
- Taxable income
- $1,574
- Est. tax owed @ 24.0%
- −$378
- After-tax cash flow
- $2,951/yr
For passive investors: Depreciation is non-cash, so a rental often shows a tax loss while cash-flowing — sheltering income. Rental losses are passive: they offset passive income freely, and up to $25,000/yr can offset ordinary (W-2) income if you actively participate and your MAGI is under $100k (phasing out to $0 by $150k); unused losses carry forward. On sale, claimed depreciation is recaptured at up to 25%, and gains may owe capital-gains tax (a 1031 exchange can defer both). Figures are a year-1 estimate at your 24.0% rate — not tax advice; consult a CPA.
Schools (NCES district)
- District
- Richmond County
- NCES district ID
- 1304380
- Math proficiency
- 12% ▼ -9.00%
- Reading proficiency
- 20% ▼ -6.00%
- Median HH income
- $38,069
- Composite
- 13.43/100
- National rank
- #9524
- State rank
- #154 of 174 in GA
Livability — Augusta-Richmond County consolidated government (balance)
No livability data for this city. (Only ~50 U.S. cities are tracked.)
Census & demographics
- Census place
- Augusta-Richmond County consolidated government (balance), GA
- County
- Richmond County · 190,917 people
- City population
- 154,035
- Metro
- Augusta-Richmond County, GA-SC
- Population (ZIP)
- 60,423
- Household income
- $45,999
- Rent vs Own
- Severe rent burden
- 3363.0
Population outlook (Richmond County) Hauer SSP2
- Today (2025)
- 200,753 people
- By 2030
- 200,232 · -0.3%
- By 2040
- 196,813 · -2.0%
- By 2050
- 190,347 · -5.2%
- By 2075
- 172,496 · -14.1%
- By 2100
- 146,284 · -27.1%
Race, ethnicity, and origin ACS 2023
- Neighborhood character
- Majority Black (64%)
- Race & ethnicity
- Black 64% White 27% Two or more races 5% Hispanic / Latino 5%
- Common ancestry
- Lithuanian 1%
- Foreign-born
- 2% · Canada
- Languages at home
- 95% English-only · Spanish 3% German/W. Germanic 1%
Political lean MEDSL · Richmond
- 2024 margin
- Solid D (+36.1) · D 67.8% · R 31.7%
- 2008→2024 swing
- +4.3pp toward D · 2008: 31.8pp · 2024: 36.1pp
- All cycles
- 2024: D+36.1 2020: D+37.2 2016: D+32.4 2012: D+33.8 2008: D+31.8
Not yet ingested
- Civics
- —
Market trends
- HPI YoY
- ▼ -58.99%
- Current HPI
- 213.5733
- Rent YoY
- ▼ -0.25%
- Metro
- Augusta-Richmond County, GA-SC
- State GDP YoY
- ▲ 2.66%
- F500 in state
- 28
Industry mix (Fortune 500 HQ in GA)
| Industry | F500 HQs | Revenue |
|---|---|---|
| Paper / Packaging | 2 | $29B |
|
||
| Retail | 1 | $160B |
|
||
| Transportation / Logistics | 1 | $91B |
|
||
| Airlines | 1 | $62B |
|
||
| Consumer Goods | 1 | $47B |
|
||
| Utilities | 1 | $25B |
|
||
Price history
+105.5% since first listed12 events — show timeline
- 2026-05-27 Listed $114,900 GAMLS
- 2026-05-11 Listing Removed — Hive MLS
- 2026-02-13 Price Changed $55,900 Hive MLS
- 2022-09-17 Listing Removed — Hive MLS
- 2022-06-03 Sold (Public Records) $90,000 Public Records
- 2022-06-03 Listed $120,000 Hive MLS
- 2021-10-29 Listing Removed — Hive MLS
- 2021-05-17 Listed $120,000 Hive MLS
- 2021-05-17 Listed $120,000 Hive MLS
- 2006-11-08 Sold (MLS) $46,000 Hive MLS
- 2006-11-08 Sold (MLS) $46,000 Hive MLS
- 2006-05-10 Listed $55,900 Hive MLS
Property tax history
+1.7%/yrLatest (2025): $1,410 · +6.2% YoY. Source: county tax records.
Cash-flow waterfall
monthlySold comps — $/sqft
last 12 mo · ≤1 miLoading sold comps…