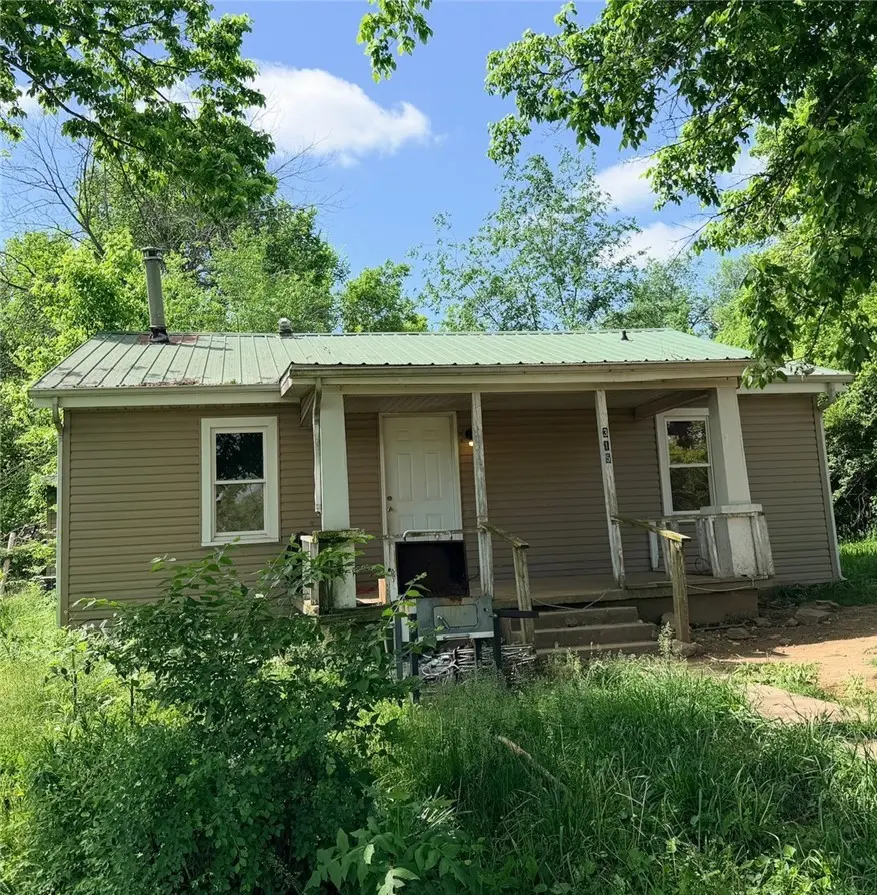
315 Gear St · Yellville, AR
Flood risk No data
- FEMA flood zone
- —
- Chance of flooding over 30 yrs
- —
- Est. flood insurance / yr
- —
Fire risk No data
- Est. fire insurance / yr
- —
Heat risk No data
- Hot days now (above threshold)
- —
- Hot days in 30 yrs
- —
Wind risk No data
- Chance of severe wind over 30 yrs
- —
Air-quality risk No data
- Unhealthy air days now
- —
- Unhealthy air days in 30 yrs
- —
Risk factors via First Street. Map © Google.
Why this score? — see what drove the B grade
The composite is a weighted blend of 9 inputs, each scored 0–100. Each bar is that input's sub-score; the figure is the points it added to the 100-point composite (weight × sub-score).
- Cash flow +30.0/30.0
- ARV discount +15.0/15.0
- DSCR +10.0/10.0
- 1% rule +7.7/10.0
- Schools +3.2/10.0
- Livability +3.2/5.0
- Rent growth +2.5/5.0
- Condition / age +2.5/5.0
- Appreciation +0.0/10.0
$80,000
🖨 Deal sheet (PDF) 📄 Offer letter ✓ Due diligence
Listing remarks
3 bd 1 ba home in Yellville close to school and nursing home. Detached garage with carport. Both home and garage have metal roofs. Yellcott internet receiver will convey. Shelves in living room and dog pen outside do not convey. Home will not go VA, FHA or RD. Selling AS-IS; all numbers approximate. Per Marion County Assessor lots are 50x125 each.
Key facts
- Metal roofs
- Detached garage
- 0.29 acre lot
Tags
Property features AI
Finance
- HOA & community: Monthly association fee; Near schools
Exterior
- Parking: Detached garage; No driveway; 1 covered parking space
- Utilities: Public water; Sewer available; Natural gas available; Cable available
- Home design: Single-story home; Residential zoning
- Construction: Vinyl siding; Metal roof; Block foundation; Built 25+ years ago
- Exterior features: Porch; Storage building; Workshop; City lot; Open lot; Public paved road access
Interior
- Kitchen: Dishwasher; Electric range
- Flooring: Laminate flooring; Wood flooring
- Bathrooms: 1 full bathroom
- Heating & cooling: Central heating (gas); Central air conditioning
- Interior features: Eat-in kitchen; Pantry; Satellite dish
- Laundry & utility: Washer hookup; Dryer hookup; Electric water heater
Neighborhood map
What this means for you Summary
Snapshot
- This is a 3-bed/2.0-bath single-family listed at $80k.
Deal economics
- At list price, monthly cash flow is $303 ($4k/yr) — positive.
- The deal already cash-flows at list — no discount required.
- Meets the 1% rule at list price ($1k rent vs $80k).
- Recommended offer: $79k (1.5% below list) — sets the bar for market timing.
- Cap rate 10.8% vs local median 3.1% in Yellville — top-decile yield for the area; either an underpriced asset or a hidden risk that comps aren't pricing in. Stress-test before assuming the spread holds.
Location & tenants
- Location reads 64/100 on livability (#181 in AR) — a middle-class / working-renter tenant base. Strengths: cost of living A+, health & safety A+, housing A; Watch: amenities F, commute F, employment F.
- Yellville-Summit School District (rural): math 41% / reading 37% proficiency, ranked #90 of 238 in AR (top 38%) — families likely to look elsewhere, expect single-tenant / working-renter base with shorter leases.
- Zoned schools: Yellville-Summit Elem. School (math 51% / reading 39%, grade D-, #138 of 454 statewide, top 31%, 399 students, 95% FRL); Yellville-Summit Middle School (283 students, 99% FRL); Yellville-Summit High School (math 31% / reading 35%, grade F, #115 of 292 statewide, top 40%, 318 students, 99% FRL) — zoned schools average 98% FRL vs 57% district-wide (40 pts higher); higher-poverty schools than district average — tighter screening recommended.
- Market conditions: 170 active listings in the ZIP; 237 units permitted in Marion County in 2024 (0 in 5+ unit buildings).
Forward outlook
- Local home prices are declining (-3.0%/yr); year-one equity from $553 of loan paydown is wiped out by about $2k of value loss. Plan a longer hold.
- Marion County population projected at -24% by 2050 — secular population decline; favor cash flow + early exit over multi-decade hold.
- At projected returns (-3.0% appreciation + 3.0% rent growth), your $22k cash investment doubles in ~8 years — after that, you're playing with house money.
Negotiation context
- It's been on market 28 days — a 2% lower offer ($79k) is reasonable based on typical stale-listing flexibility.
- Current owner paid $53k; list at $80k implies a 51% gain — meaningful room to come down on a strong offer.
Questions for the listing agent
- Is there a deadline driving the sale (1031 exchange, divorce, estate, relocation)? That informs how much negotiation room exists.
- Schools are D-rated, which usually means shorter tenancies and higher turnover. Who's the typical renter profile here, and what's been the actual vacancy rate?
- What's the average days-on-market for RENTAL listings here right now (not sales)? A rising rental-DOM trend means longer vacancies and softer asking-rent achievability than the comps imply.
- What's the recent tenant-quality profile in this submarket — average credit score on applications, eviction rate, late-payment / NSF rate, and stable-employment percentage? A property-management company in the area should have these aggregated.
- How much new for-sale + rental construction is in the pipeline within 1–3 miles? Heavy new supply typically softens prices + rents 12–24 months out; constrained supply supports both.
Investment metrics
- 1% rule
- 1.27% ✓
- Cap rate
- 10.84%
- Cash-on-cash
- 16.26%
- DSCR
- 1.72
- GRM
- 6.6
CMA / ARV
- ARV (median comp)
- $115,452
- List price
- $80,000
- Delta
- -30.71%
- Verdict
- UNDERPRICED
- Comps
- 20 within 1.0 mi
Show comp detail 12 sales within ~0.75 mi
| Address | Dist | Beds/Ba | Sqft | Sold | Price | $/sf | Match |
|---|---|---|---|---|---|---|---|
| 315 Gear St | 0.00mi | 3/1.0 | 1,084 (0%) | 1mo | $53,000 | $49 | 96 |
| 502 Hackberry Ln | 0.07mi | 3/1.0 | 1,148 (+6%) | 1mo | $140,000 | $122 | 82 |
| 901 N Estes Ave | 0.33mi | 3/2.0 | 1,113 (+3%) | 4mo | $140,000 | $126 | 76 |
| 816 N Wickersham St | 0.35mi | 3/1.5 | 1,080 (-0%) | 12mo | $150,000 | $139 | 71 |
| 102 E 5th St | 0.22mi | 2/1.0 (-1) | 1,049 (-3%) | 6mo | $140,000 | $133 | 70 |
| 1001 N Estes Ave | 0.41mi | 3/1.5 | 1,152 (+6%) | 2mo | $140,000 | $122 | 66 |
| 909 N Panther Ave | 0.36mi | 3/1.0 | 1,125 (+4%) | 13mo | $135,000 | $120 | 62 |
| 1013 Broadway | 0.48mi | 3/2.0 | 1,187 (+10%) | 2mo | $165,000 | $139 | 60 |
| 128 Walnut Cir | 0.66mi | 3/1.5 | 1,152 (+6%) | 4mo | $105,000 | $91 | 54 |
| 416 N Berry St | 0.38mi | 2/2.0 (-1) | 978 (-10%) | 20mo | $122,500 | $125 | 44 |
| 1112 N Estes Ave | 0.58mi | 3/2.0 | 1,190 (+10%) | 17mo | $165,000 | $139 | 43 |
| 1217 N Broadway Ave | 0.65mi | 2/2.0 (-1) | 1,181 (+9%) | 11mo | $167,000 | $141 | 40 |
Match score weights: distance 35% · size 25% · config 20% · recency 20%. Top-matched comps best support the ARV.
Projected returns pro-forma
-3.0% appreciation · 3.0% rent growth · sell at horizon
- IRR
- 7.2%
- Equity multiple
- 1.28×
- Total profit
- $6,345
- Equity at exit
- $11,928
- IRR
- 16.5%
- Equity multiple
- 2.35×
- Total profit
- $30,333
- Equity at exit
- $6,917
Cash invested: $22,400 (down + closing). Projections, not guarantees.
Landlord ↔ Tenant lean methodology
- Overall (STATE)
- 92 Strongly Landlord-Friendly
- State Arkansas
- 92 Strongly Landlord-Friendly · R+14
- County
- — inherits STATE
- City
- — inherits STATE
ZIP-level market 72687
- Home prices YoY
- -31.7%
- Active inventory
- 170
- Price-to-rent
- 6.6×
Monthly cashflow live
- Estimated rent
- $1,012 medium interval (Pro) →
- Mortgage (P&I)
- −$420
- Tax from tax record
- −$44 /mo · $522/yr
- Insurance
- −$33
- HOA
- −$0
- Lot rent
- −$0
- Vacancy / Maint / Mgmt
- −$213
- Net cashflow
- $303
Break-even live
Sensitivity live
| Price | -10% $349 | -5% $326 | +0% $303 | +5% $281 | +10% $258 |
|---|---|---|---|---|---|
| Rent | -10% $223 | -5% $263 | +0% $303 | +5% $343 | +10% $383 |
| Rate | -1.0pp $344 | -0.5pp $324 | base $303 | +0.5pp $283 | +1.0pp $262 |
UW: 25.0% down · 7.5% · 30yr · 1.5% tax · 5.0% vac · 8.0% maint · 8.0% mgmt
Financing live
Cash to close
- Down payment
- $20,000
- Closing costs
- $2,400
- Reserves months
- —
- Total cash needed
- —
Loan-product check · same deal, 3 products live
Conventional
25% down · 7.5% · 30yr
- Down + closing
- —
- Monthly P&I
- —
- Monthly cashflow
- —
- DSCR
- —
- Eligible?
- —
Personal DTI + credit; lowest rate.
DSCR
20% down · 8.5% · 30yr
- Down + closing
- —
- Monthly P&I
- —
- Monthly cashflow
- —
- DSCR
- —
- Eligible?
- —
No personal income docs; deal must DSCR.
Hard money
10% down · 12.0% · 12mo
- Down + closing
- —
- Monthly P&I
- —
- Monthly cashflow
- —
- DSCR
- —
- Eligible?
- —
Short-term bridge; refi at stabilization.
Listing history 1 events
-
2026-04-20$80,000 Active 349-char remark
ⓘ Source: listings_history table (triggers on properties + properties_extension) + one-shot
backfill from property_details.listing_events for pre-trigger history.
Tax reassessment forecast AR · Resets to sale price
- Current annual tax
- $522 · $44/mo
- Projected year-2 tax
- $522 · $44/mo
- Expected delta
- $0/yr ($0/mo · 0.0%)
ⓘ Screening estimate from a state-policy table — verify with the county assessor before closing.
Nearby sold comps map
Loading sold comps map…
Walkable amenities ~0.75 mi
Loading nearby amenities…
Taxation est. · year 1
- Rental income
- $12,149
- − Mortgage interest
- −$4,481
- − Property taxes
- −$522
- − Insurance
- −$400
- − Repairs & maintenance
- −$972
- − Management
- −$972
- − Depreciation
- −$2,327
- Taxable income
- $2,475
- Est. tax owed @ 24.0%
- −$594
- After-tax cash flow
- $3,048/yr
For passive investors: Depreciation is non-cash, so a rental often shows a tax loss while cash-flowing — sheltering income. Rental losses are passive: they offset passive income freely, and up to $25,000/yr can offset ordinary (W-2) income if you actively participate and your MAGI is under $100k (phasing out to $0 by $150k); unused losses carry forward. On sale, claimed depreciation is recaptured at up to 25%, and gains may owe capital-gains tax (a 1031 exchange can defer both). Figures are a year-1 estimate at your 24.0% rate — not tax advice; consult a CPA.
Schools (NCES district)
- District
- Yellville-Summit School District
- NCES district ID
- 0514490
- Math proficiency
- 41% ▼ -5.00%
- Reading proficiency
- 37% ▼ -2.00%
- Median HH income
- $32,234
- Composite
- 31.99/100
- National rank
- #5834
- State rank
- #90 of 238 in AR
Livability — Yellville
- Score
- 64/100
- State rank
- #181
- US rank
- #14569
Category grades
Schools grade is shown separately in the Schools card above.
Census & demographics
- Census place
- Yellville, AR
- Population (ZIP)
- 6,724
Population outlook (Marion County) Hauer SSP2
- Today (2025)
- 14,979 people
- By 2030
- 14,153 · -5.5%
- By 2040
- 12,546 · -16.2%
- By 2050
- 11,386 · -24.0%
- By 2075
- 9,663 · -35.5%
- By 2100
- 8,248 · -44.9%
Race, ethnicity, and origin ACS 2023
- Neighborhood character
- Predominantly White (91%)
- Race & ethnicity
- White 91% Two or more races 5% Hispanic / Latino 4%
- Common ancestry
- Lithuanian 5% Romanian 4% Slovak 4%
- Foreign-born
- 2% · Canada
- Languages at home
- 98% English-only · Spanish 1%
Political lean MEDSL · Marion
- 2024 margin
- Solid R (+60.2) · D 19.1% · R 79.3% · Other 1.5%
- 2008→2024 swing
- -30.3pp toward R · 2008: -29.9pp · 2024: -60.2pp
- All cycles
- 2024: R+60.2 2020: R+56.7 2016: R+55.1 2012: R+39.1 2008: R+29.9
Not yet ingested
- Civics
- —
Market trends
- HPI YoY
- ▼ -74.78%
- Current HPI
- 161.0917
- Rent YoY
- —
- Metro
- —
- State GDP YoY
- ▲ 3.80%
- F500 in state
- 10
Industry mix (Fortune 500 HQ in AR)
| Industry | F500 HQs | Revenue |
|---|---|---|
| Retail | 1 | $681B |
|
||
| Food / Agriculture | 1 | $53B |
|
||
| Retail / Energy | 1 | $22B |
|
||
| Transportation / Logistics | 1 | $12B |
|
||
| Energy | 1 | $4B |
|
||
Price history
-33.8% since first listed3 events — show timeline
- 2026-06-04 Sold (MLS) $53,000 NWARMLS
- 2026-05-20 Pending — NWARMLS
- 2026-04-20 Listed $80,000 NWARMLS
Property tax history
-5.2%/yrLatest (2025): $522 · +7.1% YoY. Source: county tax records.
Cash-flow waterfall
monthlySold comps — $/sqft
last 12 mo · ≤1 miLoading sold comps…