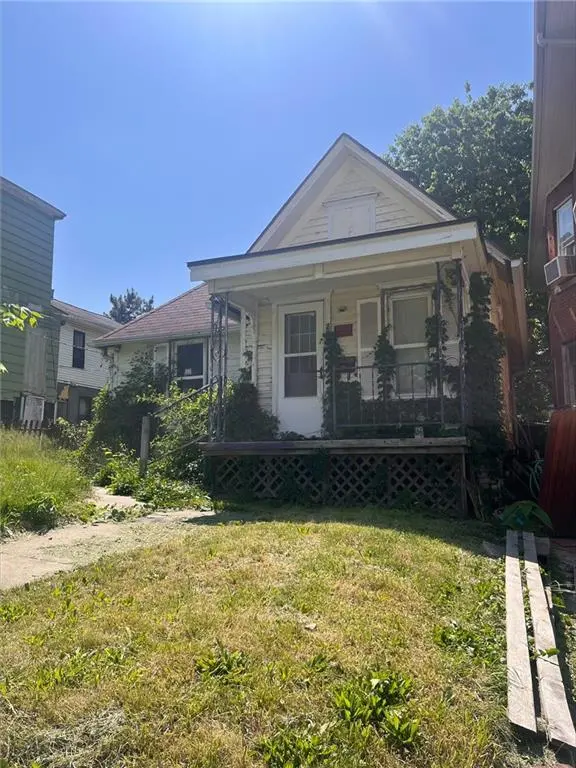
206 N 16th St · St. Joseph, MO
Flood risk 1/10 · Minimal
- FEMA flood zone
- X
- Chance of flooding over 30 yrs
- 0.0%
- Est. flood insurance / yr
- $473 – $860
Fire risk 3/10 · Minor
- Est. fire insurance / yr
- $1,054 – $1,958
Heat risk 4/10 · Minor
- Hot days now (above 106°F)
- 7 days/yr
- Hot days in 30 yrs
- 16 days/yr
Wind risk 2/10 · Minimal
- Chance of severe wind over 30 yrs
- —
Air-quality risk 2/10 · Minimal
- Unhealthy air days now
- 1 days/yr
- Unhealthy air days in 30 yrs
- 1 days/yr
Risk factors via First Street. Map © Google.
Why this score? — see what drove the C+ grade
The composite is a weighted blend of 9 inputs, each scored 0–100. Each bar is that input's sub-score; the figure is the points it added to the 100-point composite (weight × sub-score).
- Cash flow +30.0/30.0
- 1% rule +10.0/10.0
- DSCR +10.0/10.0
- Schools +2.8/10.0
- Rent growth +2.5/5.0
- Livability +2.5/5.0
- Condition / age +2.5/5.0
- ARV discount +0.0/15.0
- Appreciation +0.0/10.0
$29,000
🖨 Deal sheet 📄 Offer letter ✓ Due diligence
Listing remarks MLS
This house has been gutted and can be finished to your liking. Lots of potential! There is some shiplap and exposed brick for those who love that. There is no back yard, for easy yard maintenance. There is a heat wall unit, but it is unknown if it works. Sits on west side of N 16th between Jules and Francis. Seller is a licensed real estate agent in Missouri (not the listing agent).
Key facts
- New electric meter
- 8,276 sq ft lot
- Built 1912
Tags
Property features AI
Finance
- Other: Above-grade finished area reported as 434 (source: public records)
- HOA & community: No maintenance provided
Exterior
- Parking: Other parking
- Utilities: Public water; Public sewer; Cable available
- Home design: Single-family residential; Residential property; Single-story (entry level: first floor)
- Construction: Wood siding exterior; Composition roof; Approximately 101+ years old
- Exterior features: Front porch; Lot within city limits; Level lot; Paved public road access
Interior
- Bedrooms: One bedroom on the first floor
- Bathrooms: One full bathroom
- Heating & cooling: No heating; No cooling
- Interior features: Crawl space basement; One total room
Neighborhood map
What this means for you Summary
Snapshot
- This is a 1-bed/1.0-bath single-family listed at $29k.
Deal economics
- At list price, monthly cash flow is $390 ($5k/yr) — positive.
- The deal already cash-flows at list — no discount required.
- Meets the 1% rule at list price ($719 rent vs $29k).
- Recommended offer: $28k (3.0% below list) — sets the bar for market timing.
- Cap rate 22.4% vs local median 4.7% in St. Joseph — top-decile yield for the area; either an underpriced asset or a hidden risk that comps aren't pricing in. Stress-test before assuming the spread holds.
Location & tenants
- Location reads: area grade C — affects rentability + tenant quality, not the cash-flow math above.
- St. Joseph (urban): math 28% / reading 38% proficiency, ranked #241 of 324 in MO (top 74%) — families likely to look elsewhere, expect single-tenant / working-renter base with shorter leases.
- Market conditions: 97 active listings in the ZIP; 70 units permitted in Buchanan County in 2024 (0 in 5+ unit buildings).
Forward outlook
- Local home prices are declining (-3.0%/yr); year-one equity from $200 of loan paydown is wiped out by about $870 of value loss. Plan a longer hold.
- Buchanan County population projected to shrink 6% by 2050 — rents likely to lag national; underwrite the cash flow, not the appreciation.
- At projected returns (-3.0% appreciation + 3.0% rent growth), your $8k cash investment doubles in ~2 years — after that, you're playing with house money.
Negotiation context
- It's been on market 35 days — a 3% lower offer ($28k) is reasonable based on typical stale-listing flexibility.
- 8 sale attempts since 24y ago with the ask held roughly flat each time — persistent listings suggest the price (not the market) is what's stuck; bring a comps-based counter.
Risks & watch-outs
- Watch-outs: built in 1912 — expect roof / HVAC / electrical / plumbing capex.
Questions for the listing agent
- It's been on market 35 days. Have you received any prior offers? Is the seller open to a 3% concession, seller financing, or rate buy-down credit?
- Built in 1912 — when were the roof, HVAC, electrical panel, plumbing, and water heater last replaced?
- Is there a deadline driving the sale (1031 exchange, divorce, estate, relocation)? That informs how much negotiation room exists.
- What's the average days-on-market for RENTAL listings here right now (not sales)? A rising rental-DOM trend means longer vacancies and softer asking-rent achievability than the comps imply.
- What's the recent tenant-quality profile in this submarket — average credit score on applications, eviction rate, late-payment / NSF rate, and stable-employment percentage? A property-management company in the area should have these aggregated.
- How much new for-sale + rental construction is in the pipeline within 1–3 miles? Heavy new supply typically softens prices + rents 12–24 months out; constrained supply supports both.
Investment metrics
- 1% rule
- 2.48% ✓
- Cap rate
- 22.42%
- Cash-on-cash
- 57.59%
- DSCR
- 3.56
- GRM
- 3.4
CMA / ARV
- ARV (median comp)
- $20,944
- List price
- $29,000
- Delta
- 38.46%
- Verdict
- OVERPRICED
- Comps
- 5 within 1.0 mi
Projected returns pro-forma
-3.0% appreciation · 3.0% rent growth · sell at horizon
- IRR
- 56.1%
- Equity multiple
- 3.48×
- Total profit
- $20,117
- Equity at exit
- $4,324
- IRR
- 61.1%
- Equity multiple
- 7.09×
- Total profit
- $49,465
- Equity at exit
- $2,507
Cash invested: $8,120 (down + closing). Projections, not guarantees.
Landlord ↔ Tenant lean methodology
- Overall (STATE)
- 81 Strongly Landlord-Friendly
- State Missouri
- 81 Strongly Landlord-Friendly · R+10
- County
- — inherits STATE
- City
- — inherits STATE
ZIP-level market 64501
- Active inventory
- 97
- Price-to-rent
- 3.4×
Monthly cashflow live
- Estimated rent
- $719 medium interval (Pro) →
- Mortgage (P&I)
- −$152
- Tax from tax record
- −$14 /mo · $169/yr
- Insurance
- −$12
- HOA
- −$0
- Vacancy / Maint / Mgmt
- −$151
- Net cashflow
- $390
Break-even live
UW: 25.0% down · 7.5% · 30yr · 1.5% tax · 5.0% vac · 8.0% maint · 8.0% mgmt
Financing live
Cash to close
- Down payment
- $7,250
- Closing costs
- $870
- Reserves months
- —
- Total cash needed
- —
Loan-product check · same deal, 3 products live
Conventional
25% down · 7.5% · 30yr
- Down + closing
- —
- Monthly P&I
- —
- Monthly cashflow
- —
- DSCR
- —
- Eligible?
- —
Personal DTI + credit; lowest rate.
DSCR
20% down · 8.5% · 30yr
- Down + closing
- —
- Monthly P&I
- —
- Monthly cashflow
- —
- DSCR
- —
- Eligible?
- —
No personal income docs; deal must DSCR.
Hard money
10% down · 12.0% · 12mo
- Down + closing
- —
- Monthly P&I
- —
- Monthly cashflow
- —
- DSCR
- —
- Eligible?
- —
Short-term bridge; refi at stabilization.
Listing history 30 events
-
2026-06-19days on market $29,000 Active 35 DOM
-
2026-06-18days on market $29,000 Active 34 DOM
-
2026-06-17days on market $29,000 Active 33 DOM
-
2026-06-16days on market $29,000 Active 32 DOM
-
2026-06-15days on market $29,000 Active 31 DOM
-
2026-06-14days on market $29,000 Active 29 DOM
-
2026-06-12days on market $29,000 Active 28 DOM
-
2026-06-09days on market $29,000 Active 25 DOM
-
2026-06-08days on market $29,000 Active 24 DOM
-
2026-06-07days on market $29,000 Active 23 DOM
-
2026-06-03days on market $29,000 Active 19 DOM
-
2026-06-02days on market $29,000 Active 18 DOM
-
2026-06-01days on market $29,000 Active 17 DOM
-
2026-05-31days on market $29,000 Active 16 DOM
-
2026-05-30days on market $29,000 Active 15 DOM
-
2026-05-15$29,000 Active 282-char remark
-
2025-12-05historical
-
2025-06-27$29,000 Active
-
2021-12-31historical
Show marketing remark (385 chars)
This house has been gutted and can be finished to your liking. Lots of potential! There is some shiplap and exposed brick for those who love that. There is no back yard, for easy yard maintenance. There is a heat wall unit, but it is unknown if it works. Sits on west side of N 16th between Jules and Francis. Seller is a licensed real estate agent in Missouri (not the listing agent).
-
2021-08-10price $19,900
Show marketing remark (385 chars)
This house has been gutted and can be finished to your liking. Lots of potential! There is some shiplap and exposed brick for those who love that. There is no back yard, for easy yard maintenance. There is a heat wall unit, but it is unknown if it works. Sits on west side of N 16th between Jules and Francis. Seller is a licensed real estate agent in Missouri (not the listing agent).
-
2021-06-10$24,900 Active
Show marketing remark (385 chars)
This house has been gutted and can be finished to your liking. Lots of potential! There is some shiplap and exposed brick for those who love that. There is no back yard, for easy yard maintenance. There is a heat wall unit, but it is unknown if it works. Sits on west side of N 16th between Jules and Francis. Seller is a licensed real estate agent in Missouri (not the listing agent).
-
2021-06-10historical
Show marketing remark (385 chars)
This house has been gutted and can be finished to your liking. Lots of potential! There is some shiplap and exposed brick for those who love that. There is no back yard, for easy yard maintenance. There is a heat wall unit, but it is unknown if it works. Sits on west side of N 16th between Jules and Francis. Seller is a licensed real estate agent in Missouri (not the listing agent).
-
2020-08-28$29,500 Active
-
2018-09-07historical
-
2018-05-23$29,000 Active
-
2006-12-01soldstatus
-
2006-09-22$27,800
-
2006-06-19$24,900
-
2003-01-16soldstatus
-
2002-09-11$13,500
ⓘ Source: listings_history table (triggers on properties + properties_extension) + one-shot
backfill from property_details.listing_events for pre-trigger history.
Tax reassessment forecast MO · Resets to sale price
- Current annual tax
- $169 · $14/mo
- Projected year-2 tax
- $281 · $23/mo
- Expected delta
- +$112/yr (+$9/mo · 66.3%)
ⓘ Screening estimate from a state-policy table — verify with the county assessor before closing.
Climate risk First Street
- Flood 1/10 Low FEMA zone X · 0% chance over 30 yrs
- Wildfire 3/10 Moderate
- Heat 4/10 Moderate 7 d/yr ≥106°F today · 16 d/yr by 30 yrs out
- Wind 2/10 Low
- Air quality 2/10 Low 1 unhealthy d/yr today · 1 by 30 yrs out
Nearby sold comps map
Loading sold comps map…
Walkable amenities ~0.75 mi
Loading nearby amenities…
Taxation est. · year 1
- Rental income
- $8,627
- − Mortgage interest
- −$1,624
- − Property taxes
- −$169
- − Insurance
- −$145
- − Repairs & maintenance
- −$690
- − Management
- −$690
- − Depreciation
- −$844
- Taxable income
- $4,464
- Est. tax owed @ 24.0%
- −$1,071
- After-tax cash flow
- $3,605/yr
For passive investors: Depreciation is non-cash, so a rental often shows a tax loss while cash-flowing — sheltering income. Rental losses are passive: they offset passive income freely, and up to $25,000/yr can offset ordinary (W-2) income if you actively participate and your MAGI is under $100k (phasing out to $0 by $150k); unused losses carry forward. On sale, claimed depreciation is recaptured at up to 25%, and gains may owe capital-gains tax (a 1031 exchange can defer both). Figures are a year-1 estimate at your 24.0% rate — not tax advice; consult a CPA.
Schools (NCES district)
- District
- St. Joseph
- NCES district ID
- 2927060
- Math proficiency
- 28% ▼ -6.00%
- Reading proficiency
- 38% ▼ -1.00%
- Median HH income
- $43,007
- Composite
- 27.99/100
- National rank
- #6853
- State rank
- #241 of 324 in MO
Livability — St. Joseph
No livability data for this city. (Only ~50 U.S. cities are tracked.)
Census & demographics
- Census place
- St. Joseph, MO
- County
- Buchanan County · 32,150 people
- City population
- 44,382
- Metro
- St. Joseph, MO-KS
- Population (ZIP)
- 10,689
- Household income
- $46,731
- Rent vs Own
- Severe rent burden
- 721.0
Population outlook (Buchanan County) Hauer SSP2
- Today (2025)
- 89,041 people
- By 2030
- 88,401 · -0.7%
- By 2040
- 86,220 · -3.2%
- By 2050
- 83,603 · -6.1%
- By 2075
- 76,750 · -13.8%
- By 2100
- 67,623 · -24.1%
Race, ethnicity, and origin ACS 2023
- Neighborhood character
- Predominantly White (69%)
- Race & ethnicity
- White 69% Black 12% Hispanic / Latino 11% Two or more races 9%
- Hispanic origin (detail)
- Mexican 6% Puerto Rican 1%
- Common ancestry
- Italian 3% Romanian 1% Slovak 1%
- Foreign-born
- 7% · Canada, China
- Languages at home
- 89% English-only · Spanish 7% Arabic 1%
Political lean MEDSL · Buchanan
- 2024 margin
- Strong R (+28.0) · D 35.2% · R 63.3% · Other 1.5%
- 2008→2024 swing
- -28.2pp toward R · 2008: 0.1pp · 2024: -28.0pp
- All cycles
- 2024: R+28.0 2020: R+24.6 2016: R+26.2 2012: R+8.7 2008: D+0.1
Not yet ingested
- Civics
- —
Market trends
- HPI YoY
- ▼ -150.20%
- Current HPI
- 157.8706
- Rent YoY
- —
- Metro
- St. Joseph, MO-KS
- State GDP YoY
- ▲ 1.84%
- F500 in state
- 20
Industry mix (Fortune 500 HQ in MO)
| Industry | F500 HQs | Revenue |
|---|---|---|
| Healthcare | 1 | $163B |
|
||
| Insurance | 1 | $21B |
|
||
| Industrial Technology | 1 | $17B |
|
||
| Retail | 1 | $16B |
|
||
| Industrial Distribution | 1 | $10B |
|
||
| Utilities | 1 | $9B |
|
||
Price history
+114.8% since first listed15 events — show timeline
- 2026-05-15 Listed $29,000 Heartland MLS as Distributed by MLS Grid
- 2025-12-05 Listing Removed — Heartland MLS as Distributed by MLS Grid
- 2025-06-27 Listed $29,000 Heartland MLS as Distributed by MLS Grid
- 2021-12-31 Listing Removed — Heartland MLS as Distributed by MLS Grid
- 2021-08-10 Price Changed $19,900 Heartland MLS as Distributed by MLS Grid
- 2021-06-10 Listing Removed — Heartland MLS as Distributed by MLS Grid
- 2021-06-10 Listed $24,900 Heartland MLS as Distributed by MLS Grid
- 2020-08-28 Listed $29,500 Heartland MLS as Distributed by MLS Grid
- 2018-09-07 Listing Removed — Heartland MLS as Distributed by MLS Grid
- 2018-05-23 Listed $29,000 Heartland MLS as Distributed by MLS Grid
- 2006-12-01 Sold (MLS) — Heartland MLS as Distributed by MLS Grid
- 2006-09-22 Listed $27,800 Heartland MLS as Distributed by MLS Grid
- 2006-06-19 Listed $24,900 Heartland MLS as Distributed by MLS Grid
- 2003-01-16 Sold (MLS) — Heartland MLS as Distributed by MLS Grid
- 2002-09-11 Listed $13,500 Heartland MLS as Distributed by MLS Grid
Property tax history
+1.7%/yrLatest (2025): $169 · +8.7% YoY. Source: county tax records.
Cash-flow waterfall
monthlySold comps — $/sqft
last 12 mo · ≤1 miLoading sold comps…