611 Philosopher St · Napoleonville, LA
Flood risk 1/10 · Minimal
- FEMA flood zone
- X
- Chance of flooding over 30 yrs
- 0.0%
- Est. flood insurance / yr
- $507 – $1,088
Fire risk 1/10 · Minimal
- Est. fire insurance / yr
- $1,269 – $2,357
Heat risk 9/10 · Severe
- Hot days now (above 107°F)
- 7 days/yr
- Hot days in 30 yrs
- 22 days/yr
Wind risk 9/10 · Severe
- Chance of severe wind over 30 yrs
- 99.0%
Air-quality risk 1/10 · Minimal
- Unhealthy air days now
- 0 days/yr
- Unhealthy air days in 30 yrs
- 0 days/yr
Risk factors via First Street. Map © Google.
Why this score? — see what drove the B- grade
The composite is a weighted blend of 9 inputs, each scored 0–100. Each bar is that input's sub-score; the figure is the points it added to the 100-point composite (weight × sub-score).
- Cash flow +30.0/30.0
- 1% rule +10.0/10.0
- DSCR +10.0/10.0
- ARV discount +7.5/15.0
- Livability +3.0/5.0
- Schools +2.8/10.0
- Rent growth +2.5/5.0
- Condition / age +2.2/5.0
- Appreciation +0.0/10.0
$50,000
🖨 Deal sheet 📄 Offer letter ✓ Due diligence
Listing remarks
Great investment property
Key facts
- 0.3 acre lot
- 4 parking spots
- Built 1920
Neighborhood map
What this means for you Summary
Snapshot
- This is a 3-bed/2.0-bath single-family listed at $50k. Condition is rated fair.
Deal economics
- At list price, monthly cash flow is $563 ($7k/yr) — positive.
- The deal already cash-flows at list — no discount required.
- Meets the 1% rule at list price ($1k rent vs $50k).
Location & tenants
- Location reads 60/100 on livability (#249 in LA) — a middle-class / working-renter tenant base. Strengths: cost of living A+, health & safety A+, housing B; Watch: crime F, amenities F, commute F.
- Assumption Parish (other): math 30% / reading 35% proficiency, ranked #39 of 98 in LA (top 40%) — families likely to look elsewhere, expect single-tenant / working-renter base with shorter leases; 65% free/reduced lunch — lower-income household profile, screen leases tightly.
- Market conditions: 50 active listings in the ZIP; 30 units permitted in Assumption Parish in 2024 (0 in 5+ unit buildings).
Forward outlook
- Local home prices are declining (-3.0%/yr); year-one equity from $346 of loan paydown is wiped out by about $2k of value loss. Plan a longer hold.
- Assumption County population projected at -15% by 2050 — secular population decline; favor cash flow + early exit over multi-decade hold.
- At projected returns (-3.0% appreciation + 3.0% rent growth), your $14k cash investment doubles in ~3 years — after that, you're playing with house money.
Negotiation context
- Only 13 days on market — expect competitive offers; lowballing is unlikely to land.
- 2 sale attempts since 4y ago; this cycle's ask has dropped $10k (17%) from the opening price — seller is motivated, your offer sets the floor, not the list.
Risks & watch-outs
- Watch-outs: built in 1920 — expect roof / HVAC / electrical / plumbing capex.
- Climate carrying-cost: severe wind risk, 99% chance of damaging wind over 30y; extreme-heat days projected 7→22/yr by 2055 (HVAC capex compounding) — expect insurance premiums to compound above CPI over the hold.
Questions for the listing agent
- Have any recent inspections been done? Can we get a copy of the seller's disclosures and any deferred-maintenance estimates?
- Built in 1920 — when were the roof, HVAC, electrical panel, plumbing, and water heater last replaced?
- Is there a deadline driving the sale (1031 exchange, divorce, estate, relocation)? That informs how much negotiation room exists.
- Crime grade is F in this area — have there been break-ins, vandalism, or insurance claims at this property in the last 3 years? What carrier currently insures it and at what premium?
- What's the average days-on-market for RENTAL listings here right now (not sales)? A rising rental-DOM trend means longer vacancies and softer asking-rent achievability than the comps imply.
- What's the recent tenant-quality profile in this submarket — average credit score on applications, eviction rate, late-payment / NSF rate, and stable-employment percentage? A property-management company in the area should have these aggregated.
- How much new for-sale + rental construction is in the pipeline within 1–3 miles? Heavy new supply typically softens prices + rents 12–24 months out; constrained supply supports both.
Investment metrics
- 1% rule
- 2.30% ✓
- Cap rate
- 19.82%
- Cash-on-cash
- 48.30%
- DSCR
- 3.15
- GRM
- 3.6
CMA / ARV
- ARV (on-the-fly)
- $151,011
- Comps found
- 4
Show comp detail 4 sales within ~0.75 mi
| Address | Dist | Beds/Ba | Sqft | Sold | Price | $/sf | Match |
|---|---|---|---|---|---|---|---|
| 311 Franklin St | 0.07mi | 2/2.0 (-1) | 1,215 (-4%) | 14mo | $144,900 | $119 | 73 |
| 107 Foley Ave | 0.27mi | 2/2.0 (-1) | 1,252 (-1%) | 10mo | $142,500 | $114 | 72 |
| 194 Highway 401 Hwy | 0.38mi | 3/1.5 | 1,284 (+1%) | 14mo | $35,000 | $27 | 67 |
| 120 Foley Ave | 0.29mi | 3/2.0 | 1,200 (-5%) | 21mo | $187,500 | $156 | 60 |
Match score weights: distance 35% · size 25% · config 20% · recency 20%. Top-matched comps best support the ARV.
Projected returns pro-forma
-3.0% appreciation · 3.0% rent growth · sell at horizon
- IRR
- 45.8%
- Equity multiple
- 2.99×
- Total profit
- $27,803
- Equity at exit
- $7,455
- IRR
- 51.6%
- Equity multiple
- 6.04×
- Total profit
- $70,493
- Equity at exit
- $4,323
Cash invested: $14,000 (down + closing). Projections, not guarantees.
Landlord ↔ Tenant lean methodology
- Overall (STATE)
- 90 Strongly Landlord-Friendly
- State Louisiana
- 90 Strongly Landlord-Friendly · R+12
- County
- — inherits STATE
- City
- — inherits STATE
ZIP-level market 70390
- Home prices YoY
- -20.7%
- Active inventory
- 50
- Price-to-rent
- 3.6×
Monthly cashflow live
- Estimated rent
- $1,151 medium interval (Pro) →
- Mortgage (P&I)
- −$262
- Tax est. 1.5%
- −$62 /mo · $750/yr
- Insurance
- −$21
- HOA
- −$0
- Vacancy / Maint / Mgmt
- −$242
- Net cashflow
- $563
Break-even live
UW: 25.0% down · 7.5% · 30yr · 1.5% tax · 5.0% vac · 8.0% maint · 8.0% mgmt
Financing live
Cash to close
- Down payment
- $12,500
- Closing costs
- $1,500
- Reserves months
- —
- Total cash needed
- —
Loan-product check · same deal, 3 products live
Conventional
25% down · 7.5% · 30yr
- Down + closing
- —
- Monthly P&I
- —
- Monthly cashflow
- —
- DSCR
- —
- Eligible?
- —
Personal DTI + credit; lowest rate.
DSCR
20% down · 8.5% · 30yr
- Down + closing
- —
- Monthly P&I
- —
- Monthly cashflow
- —
- DSCR
- —
- Eligible?
- —
No personal income docs; deal must DSCR.
Hard money
10% down · 12.0% · 12mo
- Down + closing
- —
- Monthly P&I
- —
- Monthly cashflow
- —
- DSCR
- —
- Eligible?
- —
Short-term bridge; refi at stabilization.
Listing history 17 events
-
2026-06-19days on market $50,000 Active 13 DOM
-
2026-06-18days on market $50,000 Active 12 DOM
-
2026-06-17days on market $50,000 Active 11 DOM
-
2026-06-16days on market $50,000 Active 10 DOM
-
2026-06-15days on market $50,000 Active 9 DOM
-
2026-06-14days on market $50,000 Active 7 DOM
-
2026-06-13days on market $50,000 Active 6 DOM
-
2026-06-10days on market $50,000 Active 4 DOM
-
2026-06-09days on market $50,000 Active 3 DOM
-
2026-06-08days on market $50,000 Active 2 DOM
-
2026-06-07remarks 25-char remark
-
2026-06-07pricestatusdays on market $50,000 Active 1 DOM
-
2024-12-11status Pending
-
2024-12-11historical
-
2023-01-19status Pending
-
2022-12-21$60,000 Active
-
2022-12-21$60,000
ⓘ Source: listings_history table (triggers on properties + properties_extension) + one-shot
backfill from property_details.listing_events for pre-trigger history.
Climate risk First Street
- Flood 1/10 Low FEMA zone X · 0% chance over 30 yrs
- Wildfire 1/10 Low
- Heat 9/10 Extreme 7 d/yr ≥107°F today · 22 d/yr by 30 yrs out
- Wind 9/10 Extreme 99% chance of damaging wind over 30 yrs
- Air quality 1/10 Low 0 unhealthy d/yr today · 0 by 30 yrs out
Nearby sold comps map
Loading sold comps map…
Walkable amenities ~0.75 mi
Loading nearby amenities…
Taxation est. · year 1
- Rental income
- $13,808
- − Mortgage interest
- −$2,801
- − Property taxes
- −$750
- − Insurance
- −$250
- − Repairs & maintenance
- −$1,105
- − Management
- −$1,105
- − Depreciation
- −$1,455
- Taxable income
- $6,343
- Est. tax owed @ 24.0%
- −$1,522
- After-tax cash flow
- $5,239/yr
For passive investors: Depreciation is non-cash, so a rental often shows a tax loss while cash-flowing — sheltering income. Rental losses are passive: they offset passive income freely, and up to $25,000/yr can offset ordinary (W-2) income if you actively participate and your MAGI is under $100k (phasing out to $0 by $150k); unused losses carry forward. On sale, claimed depreciation is recaptured at up to 25%, and gains may owe capital-gains tax (a 1031 exchange can defer both). Figures are a year-1 estimate at your 24.0% rate — not tax advice; consult a CPA.
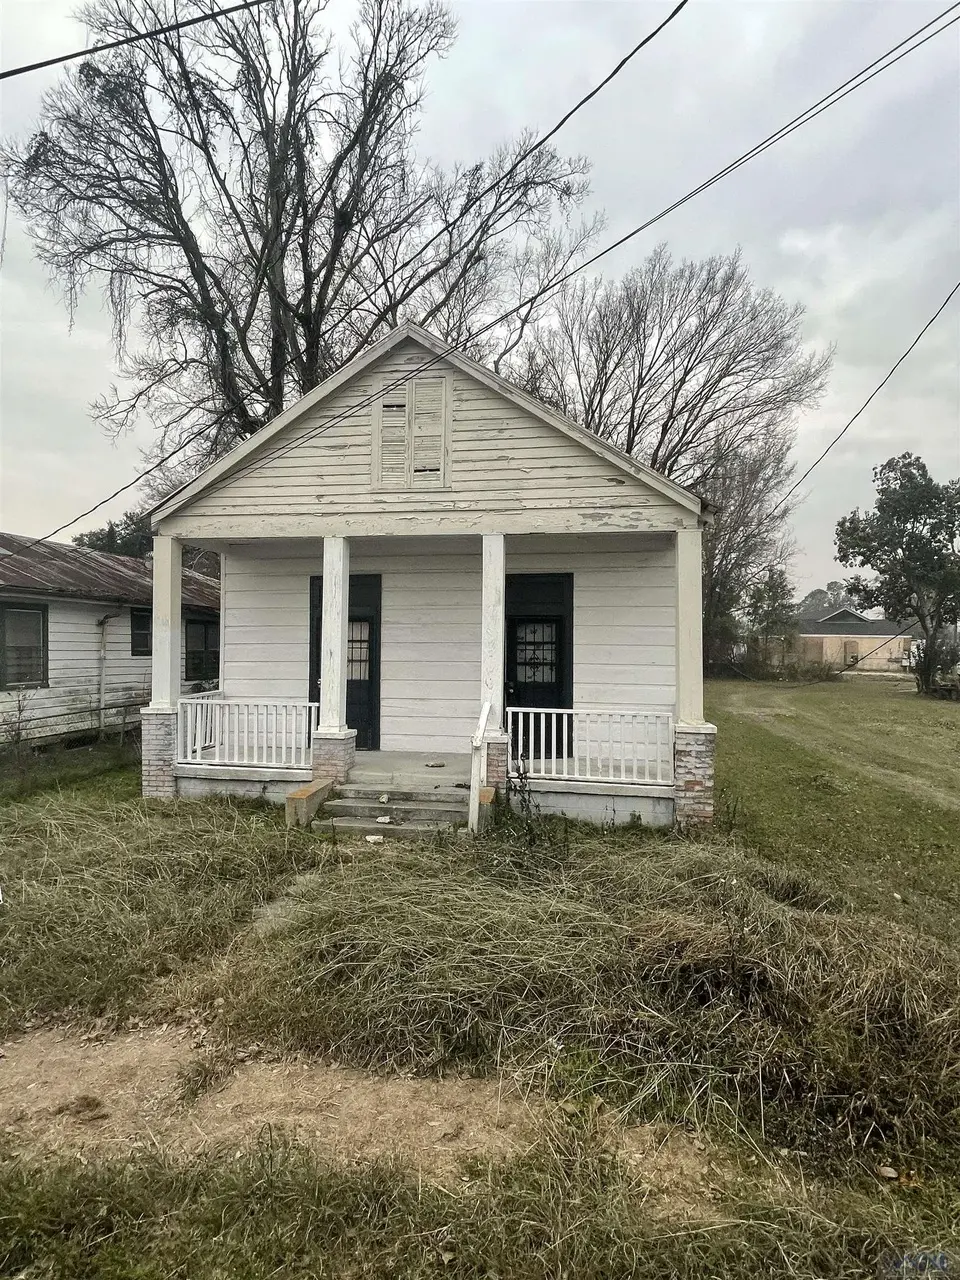
Condition & rehab AI · 3 photos
This property requires significant exterior repairs and painting to improve its curb appeal and value.
Repairs flagged
- Major siding — Severe weathering and peeling
- Major roof — Significant wear
Value-add opportunities
- Both painting the exterior — Enhances curb appeal and value
- Both repairing the roof — Critical for structural integrity and longevity
Renovation cost estimate screening
| Repair item | Severity | Est. cost |
|---|---|---|
| siding · Severe weathering and peeling | Major | $15,000–50,000 |
| roof · Significant wear | Major | $15,000–50,000 |
| Total estimated repair cost · 2 items | $30,000–100,000 |
Value-add ROI direction
- Both painting the exterior — Enhances curb appeal and value ↑
- Both repairing the roof — Critical for structural integrity and longevity ↑
ⓘ Cost ranges are severity-bucket heuristics (US national rule-of-thumb). Get contractor quotes + a written scope before underwriting a rehab budget.
Schools (NCES district)
- District
- Assumption Parish
- NCES district ID
- 2200120
- Math proficiency
- 30% ▼ -34.00%
- Reading proficiency
- 35% ▼ -35.00%
- Median HH income
- $45,552
- Composite
- 27.84/100
- National rank
- #6882
- State rank
- #39 of 98 in LA
Livability — Napoleonville
- Score
- 60/100
- State rank
- #249
- US rank
- #18807
Category grades
Schools grade is shown separately in the Schools card above.
Census & demographics
- Census place
- Napoleonville, LA
- Population (ZIP)
- 7,397
Population outlook (Assumption County) Hauer SSP2
- Today (2025)
- 22,270 people
- By 2030
- 21,696 · -2.6%
- By 2040
- 20,325 · -8.7%
- By 2050
- 18,921 · -15.0%
- By 2075
- 16,597 · -25.5%
- By 2100
- 15,429 · -30.7%
Race, ethnicity, and origin ACS 2023
- Neighborhood character
- Diverse neighborhood (Simpson 0.60)
- Race & ethnicity
- White 49% Black 39% Hispanic / Latino 8% Two or more races 7% Asian 2%
- Hispanic origin (detail)
- Mexican 4%
- Common ancestry
- Lithuanian 12%
- Foreign-born
- 5% · Canada, Vietnam
- Languages at home
- 91% English-only · Spanish 5% Vietnamese 2% French/Haitian/Cajun 2%
Political lean MEDSL · Assumption
- 2024 margin
- Solid R (+35.6) · D 31.6% · R 67.2% · Other 1.3%
- 2008→2024 swing
- -24.4pp toward R · 2008: -11.2pp · 2024: -35.6pp
- All cycles
- 2024: R+35.6 2020: R+30.6 2016: R+25.5 2012: R+12.1 2008: R+11.2
Not yet ingested
- Civics
- —
Market trends
- HPI YoY
- ▼ -43.69%
- Current HPI
- 167.5956
- Rent YoY
- —
- Metro
- —
- State GDP YoY
- ▲ 3.29%
- F500 in state
- 10
Industry mix (Fortune 500 HQ in LA)
| Industry | F500 HQs | Revenue |
|---|---|---|
| Telecommunications | 2 | $23B |
|
||
| Utilities | 1 | $12B |
|
||
| Wholesale / Distribution | 1 | $5B |
|
||
| Advertising | 1 | $2B |
|
||
Price history
+0.0% since first listed5 events — show timeline
- 2024-12-11 Pending — GBRMLS
- 2024-12-11 Delisted — GBRMLS
- 2023-01-19 Pending — GBRMLS
- 2022-12-21 Listed $60,000 AcadianaMLS
- 2022-12-21 Listed $60,000 GBRMLS
Cash-flow waterfall
monthlySold comps — $/sqft
last 12 mo · ≤1 miLoading sold comps…