6122 Fourmile Canyon Dr · Mountain Meadows, CO
Flood risk 10/10 · Severe
- FEMA flood zone
- X (unshaded)
- Chance of flooding over 30 yrs
- 0.99%
- Est. flood insurance / yr
- $507 – $1,088
Fire risk 9/10 · Severe
- Est. fire insurance / yr
- $939 – $1,743
Heat risk 1/10 · Minimal
- Hot days now (above 87°F)
- 7 days/yr
- Hot days in 30 yrs
- 20 days/yr
Wind risk 1/10 · Minimal
- Chance of severe wind over 30 yrs
- —
Air-quality risk 2/10 · Minimal
- Unhealthy air days now
- 1 days/yr
- Unhealthy air days in 30 yrs
- 2 days/yr
Risk factors via First Street. Map © Google.
Why this score? — see what drove the D+ grade
The composite is a weighted blend of 9 inputs, each scored 0–100. Each bar is that input's sub-score; the figure is the points it added to the 100-point composite (weight × sub-score).
- Cash flow +15.9/30.0
- ARV discount +7.5/15.0
- Schools +5.1/10.0
- DSCR +4.9/10.0
- Rent growth +3.9/5.0
- 1% rule +3.3/10.0
- Livability +2.8/5.0
- Condition / age +2.5/5.0
- Appreciation +0.0/10.0
$275,000
🖨 Deal sheet (PDF) 📄 Offer letter ✓ Due diligence
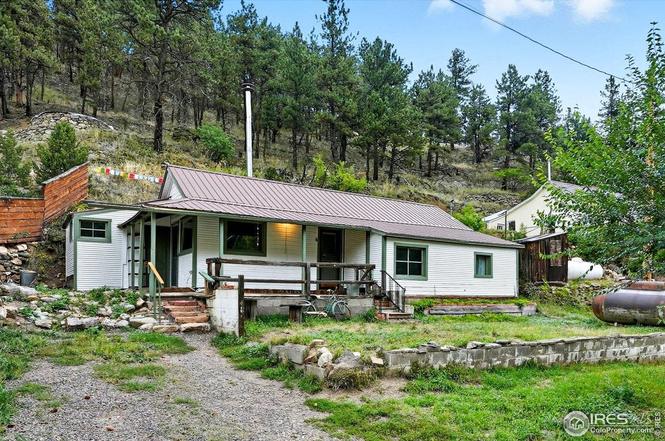
Listing remarks
Located in historic Fourmile Canyon just 20 minutes from downtown Boulder, this property offers a rare opportunity for investors, contractors, builders, or buyers seeking a mountain renovation project with strong upside potential. Set along a scenic stretch of canyon road with a creek across the street and true mountain living, the property combines a private mountain setting with convenient access to Boulder. The turn-of-the-century home features 2 bedrooms and 1 bathroom and is being sold strictly as-is. The property will likely require significant renovation or redevelopment, making it well suited for buyers looking for a fixer-upper, investment property, restoration project, or future c
Key facts
- 5,662 sq ft lot
- Garage
- Built 1900
Property features AI
Finance
- Other: Property type: Single-family use permitted; Cabin property sub-type; Directions: Google Maps will take you directly to the cabin, but there is no service — map ahead of time
- HOA & community: No association fees
Exterior
- Parking: Off-street parking; 1 garage space
- Utilities: Well water (meter installed); No water rights; Electricity available; Propane gas
- Home design: One-story cabin (residential); Not new — previously owned; Zoning: F
- Construction: Frame construction; Metal roof
- Exterior features: Patio; Paved lot; Asphalt road frontage; County-maintained road access; Located in a 500-year floodplain or B/X flood zone
Interior
- Kitchen: Electric range; Refrigerator
- Bedrooms: 2 bedrooms (all bedrooms conform)
- Bathrooms: 1 full bathroom
- Heating & cooling: Forced air heating; Wood stove (secondary heat source)
- Interior features: Eat-in kitchen; Beamed ceilings; Wood stove
Neighborhood map
What this means for you Summary
Snapshot
- This is a 2-bed/1.0-bath single-family listed at $275k.
Deal economics
- At list price, monthly cash flow is $66 ($794/yr) — positive.
- The deal already cash-flows at list — no discount required.
- To meet the 1% rule (rent ≥ 1% of price), the offer needs to be $230k (16.5% below list).
- Recommended offer: $230k (16.5% below list) — sets the bar for 1% rule.
Location & tenants
- Location reads 56/100 on livability (#329 in CO) — a working-class tenant base; expect higher turnover. Strengths: employment A+, housing A+, crime A-; Watch: amenities F, commute F, cost of living F.
- Boulder Valley School District No. Re2 (urban): math 49% / reading 67% proficiency, ranked #6 of 86 in CO (top 7%) — acceptable for families but not a draw, mixed tenant base, ~2y average lease; only 16% free/reduced lunch — higher-income household profile.
- Zoned schools: Flatirons Elementary School (math 70% / reading 77%, grade A, #23 of 966 statewide, top 2%, 182 students, 15% FRL); Casey Middle School (math 34% / reading 47%, grade F, #76 of 270 statewide, top 28%, 452 students, 57% FRL); Boulder High School (math 64% / reading 81%, grade B+, #18 of 381 statewide, top 4%, 2,074 students, 28% FRL) — zoned schools average 33% FRL vs 16% district-wide (17 pts higher); higher-poverty schools than district average — tighter screening recommended.
- Market conditions: Rents rising fast (+5.6%/yr); 253 active listings in the ZIP; 1,688 units permitted in Boulder County in 2024 (1,136 in 5+ unit buildings).
- This rent runs 45% of the median local income ($62k/yr) — at the standard rent-burdened threshold; future hikes will face affordability resistance.
Forward outlook
- Local home prices are declining (-3.0%/yr); year-one equity from $2k of loan paydown is wiped out by about $8k of value loss. Plan a longer hold.
- Boulder County population projected at +40% by 2050 — long-run rental-demand tailwind backs the buy-and-hold thesis.
Negotiation context
- It's been on market 281 days — a 12% lower offer ($242k) is reasonable based on typical stale-listing flexibility.
- Current owner paid $7k; list at $275k implies a 3829% gain — meaningful room to come down on a strong offer.
Risks & watch-outs
- Watch-outs: flood insurance adds $66/mo; built in 1900 — expect roof / HVAC / electrical / plumbing capex.
- Climate carrying-cost: severe flood risk; severe wildfire risk — expect insurance premiums to compound above CPI over the hold.
Questions for the listing agent
- It's been on market 281 days. Have you received any prior offers? Is the seller open to a 17% concession, seller financing, or rate buy-down credit?
- Built in 1900 — when were the roof, HVAC, electrical panel, plumbing, and water heater last replaced?
- What's the actual annual flood-insurance premium (NFIP or private), and is the property in a SFHA with mandatory coverage?
- Why hasn't it sold? Are there any deal-killer items the seller is aware of (foundation, flood, title, zoning, code violations)?
- Is there a deadline driving the sale (1031 exchange, divorce, estate, relocation)? That informs how much negotiation room exists.
- The area grade is low — what's the realistic commute time and amenity access for the typical tenant pool here? Any planned neighborhood developments (good or bad) we should know about?
- What's the average days-on-market for RENTAL listings here right now (not sales)? A rising rental-DOM trend means longer vacancies and softer asking-rent achievability than the comps imply.
- What's the recent tenant-quality profile in this submarket — average credit score on applications, eviction rate, late-payment / NSF rate, and stable-employment percentage? A property-management company in the area should have these aggregated.
- How much new for-sale + rental construction is in the pipeline within 1–3 miles? Heavy new supply typically softens prices + rents 12–24 months out; constrained supply supports both.
Investment metrics
- 1% rule
- 0.83% ✗
- Cap rate
- 6.87%
- Cash-on-cash
- 2.07%
- DSCR
- 1.09
- GRM
- 10.0
CMA / ARV
No comps found within radius.
Projected returns pro-forma
-3.0% appreciation · 5.61% rent growth · sell at horizon
- IRR
- -12.0%
- Equity multiple
- 0.56×
- Total profit
- $-34,220
- Equity at exit
- $41,003
- IRR
- 0.4%
- Equity multiple
- 1.03×
- Total profit
- $2,167
- Equity at exit
- $23,777
Cash invested: $77,000 (down + closing). Projections, not guarantees.
Landlord ↔ Tenant lean methodology
- Overall (STATE)
- 38 Tenant-Leaning
- State Colorado
- 38 Tenant-Leaning · D+4
- County
- — inherits STATE
- City
- — inherits STATE
ZIP-level market 80302
- Rents YoY
- 5.6%
- Active inventory
- 253
- Price-to-rent
- 10.0×
Monthly cashflow live
- Estimated rent
- $2,296 medium interval (Pro) →
- Mortgage (P&I)
- −$1,442
- Tax from tax record
- −$124 /mo · $1,491/yr
- Insurance
- −$115
- Flood insurance flood zone
- −$66 /mo · $798/yr
- HOA
- −$0
- Vacancy / Maint / Mgmt
- −$482
- Net cashflow
- $66
Break-even live
Sensitivity live
| Price | -10% $222 | -5% $144 | +0% $66 | +5% $-12 | +10% $-89 |
|---|---|---|---|---|---|
| Rent | -10% $-115 | -5% $-24 | +0% $66 | +5% $157 | +10% $248 |
| Rate | -1.0pp $205 | -0.5pp $136 | base $66 | +0.5pp $-5 | +1.0pp $-78 |
UW: 25.0% down · 7.5% · 30yr · 1.5% tax · 5.0% vac · 8.0% maint · 8.0% mgmt
Financing live
Cash to close
- Down payment
- $68,750
- Closing costs
- $8,250
- Reserves months
- —
- Total cash needed
- —
Loan-product check · same deal, 3 products live
Conventional
25% down · 7.5% · 30yr
- Down + closing
- —
- Monthly P&I
- —
- Monthly cashflow
- —
- DSCR
- —
- Eligible?
- —
Personal DTI + credit; lowest rate.
DSCR
20% down · 8.5% · 30yr
- Down + closing
- —
- Monthly P&I
- —
- Monthly cashflow
- —
- DSCR
- —
- Eligible?
- —
No personal income docs; deal must DSCR.
Hard money
10% down · 12.0% · 12mo
- Down + closing
- —
- Monthly P&I
- —
- Monthly cashflow
- —
- DSCR
- —
- Eligible?
- —
Short-term bridge; refi at stabilization.
Listing history 24 events
-
2026-06-21days on market $275,000 Active 281 DOM
-
2026-06-18days on market $275,000 Active 278 DOM
-
2026-06-17days on market $275,000 Active 277 DOM
-
2026-06-16days on market $275,000 Active 276 DOM
-
2026-06-15days on market $275,000 Active 275 DOM
-
2026-06-14days on market $275,000 Active 273 DOM
-
2026-06-13days on market $275,000 Active 272 DOM
-
2026-06-10days on market $275,000 Active 270 DOM
-
2026-06-09days on market $275,000 Active 269 DOM
-
2026-06-09days on market $275,000 Active 268 DOM
-
2026-06-07days on market $275,000 Active 267 DOM
-
2026-06-05days on market $275,000 Active 264 DOM
-
2026-06-03days on market $275,000 Active 263 DOM
-
2026-06-02days on market $275,000 Active 262 DOM
-
2026-06-01days on market $275,000 Active 261 DOM
-
2026-05-31days on market $275,000 Active 260 DOM
-
2026-05-30days on market $275,000 Active 259 DOM
-
2026-04-14price $300,000
-
2026-03-26price $350,000
-
2026-03-16price $355,000
-
2026-02-16price $360,000
-
2025-10-06price $395,000
-
2025-09-13$400,000 Active
-
1971-07-14soldstatus $7,000
ⓘ Source: listings_history table (triggers on properties + properties_extension) + one-shot
backfill from property_details.listing_events for pre-trigger history.
Tax reassessment forecast CO · Resets to sale price
- Current annual tax
- $1,491 · $124/mo
- Projected year-2 tax
- $1,512 · $126/mo
- Expected delta
- +$22/yr (+$2/mo · 1.5%)
ⓘ Screening estimate from a state-policy table — verify with the county assessor before closing.
Climate risk First Street
- Flood 10/10 Extreme FEMA zone X (unshaded) · 99% chance over 30 yrs
- Wildfire 9/10 Extreme
- Heat 1/10 Low 7 d/yr ≥87°F today · 20 d/yr by 30 yrs out
- Wind 1/10 Low
- Air quality 2/10 Low 1 unhealthy d/yr today · 2 by 30 yrs out
Nearby sold comps map
Loading sold comps map…
Walkable amenities ~0.75 mi
Loading nearby amenities…
Taxation est. · year 1
- Rental income
- $27,548
- − Mortgage interest
- −$15,404
- − Property taxes
- −$1,491
- − Insurance
- −$2,172
- − Repairs & maintenance
- −$2,204
- − Management
- −$2,204
- − Depreciation
- −$8,000
- Taxable loss
- −$3,927
- Est. tax savings @ 24.0%
- +$943
- After-tax cash flow
- $1,737/yr
For passive investors: Depreciation is non-cash, so a rental often shows a tax loss while cash-flowing — sheltering income. Rental losses are passive: they offset passive income freely, and up to $25,000/yr can offset ordinary (W-2) income if you actively participate and your MAGI is under $100k (phasing out to $0 by $150k); unused losses carry forward. On sale, claimed depreciation is recaptured at up to 25%, and gains may owe capital-gains tax (a 1031 exchange can defer both). Figures are a year-1 estimate at your 24.0% rate — not tax advice; consult a CPA.
Schools (NCES district)
- District
- Boulder Valley School District No. Re2
- NCES district ID
- 0802490
- Math proficiency
- 49% ▼ -3.00%
- Reading proficiency
- 67% ▲ 4.00%
- Median HH income
- $70,395
- Composite
- 51.3/100
- National rank
- #1747
- State rank
- #6 of 86 in CO
Livability — Mountain Meadows
- Score
- 56/100
- State rank
- #329
- US rank
- #22318
Category grades
Schools grade is shown separately in the Schools card above.
Census & demographics
- County
- Boulder County · 271,666 people
- Metro
- Boulder, CO
- Population (ZIP)
- 29,569
- Household income
- $61,698
- Rent vs Own
- Severe rent burden
- 4261.0
Population outlook (Boulder County) Hauer SSP2
- Today (2025)
- 380,833 people
- By 2030
- 412,028 · +8.2%
- By 2040
- 472,764 · +24.1%
- By 2050
- 532,029 · +39.7%
- By 2075
- 679,723 · +78.5%
- By 2100
- 766,278 · +101.2%
Race, ethnicity, and origin ACS 2023
- Neighborhood character
- Predominantly White (83%)
- Race & ethnicity
- White 83% Hispanic / Latino 7% Two or more races 7% Asian 5% Black 1%
- Hispanic origin (detail)
- Mexican 3%
- Common ancestry
- Italian 3% Lithuanian 3% Romanian 3%
- Foreign-born
- 9% · China, Canada
- Languages at home
- 87% English-only · Spanish 4% Other Indo-European 2% Chinese 2%
Political lean MEDSL · Boulder
- 2024 margin
- Solid D (+55.8) · D 76.5% · R 20.8% · Other 2.7%
- 2008→2024 swing
- +9.6pp toward D · 2008: 46.1pp · 2024: 55.8pp
- All cycles
- 2024: D+55.8 2020: D+56.6 2016: D+48.6 2012: D+41.5 2008: D+46.1
Not yet ingested
- Civics
- —
Market trends
- HPI YoY
- ▼ -458.42%
- Current HPI
- 285.6506
- Rent YoY
- ▲ 5.61%
- Metro
- Boulder, CO
- State GDP YoY
- ▲ 1.95%
- F500 in state
- 14
Industry mix (Fortune 500 HQ in CO)
| Industry | F500 HQs | Revenue |
|---|---|---|
| Technology Distribution | 1 | $31B |
|
||
| Food / Agriculture | 1 | $18B |
|
||
| Packaging | 1 | $14B |
|
||
| Healthcare | 1 | $13B |
|
||
| Energy | 1 | $10B |
|
||
| Technology | 1 | $4B |
|
||
Price history
+4185.7% since first listed7 events — show timeline
- 2026-04-14 Price Changed $300,000 IRES
- 2026-03-26 Price Changed $350,000 IRES
- 2026-03-16 Price Changed $355,000 IRES
- 2026-02-16 Price Changed $360,000 IRES
- 2025-10-06 Price Changed $395,000 IRES
- 2025-09-13 Listed $400,000 IRES
- 1971-07-14 Sold (Public Records) $7,000 Public Records
Property tax history
+3.9%/yrLatest (2025): $1,491 · +54.2% YoY. Source: county tax records.
Cash-flow waterfall
monthlySold comps — $/sqft
last 12 mo · ≤1 miLoading sold comps…