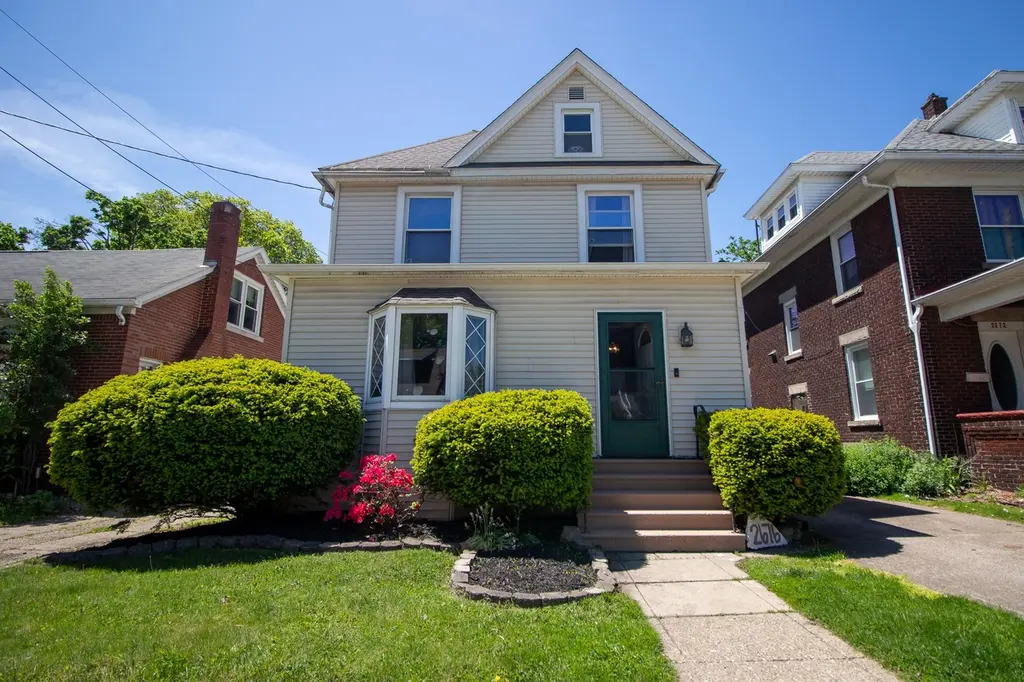
2676 Poplar St · Erie, PA
Flood risk 4/10 · Minor
- FEMA flood zone
- X (unshaded)
- Chance of flooding over 30 yrs
- 0.22%
- Est. flood insurance / yr
- $473 – $860
Fire risk 1/10 · Minimal
- Est. fire insurance / yr
- $511 – $949
Heat risk 2/10 · Minimal
- Hot days now (above 89°F)
- 7 days/yr
- Hot days in 30 yrs
- 17 days/yr
Wind risk 1/10 · Minimal
- Chance of severe wind over 30 yrs
- —
Air-quality risk 2/10 · Minimal
- Unhealthy air days now
- 1 days/yr
- Unhealthy air days in 30 yrs
- 3 days/yr
Risk factors via First Street. Map © Google.
Why this score? — see what drove the C- grade
The composite is a weighted blend of 9 inputs, each scored 0–100. Each bar is that input's sub-score; the figure is the points it added to the 100-point composite (weight × sub-score).
- Cash flow +25.0/30.0
- DSCR +8.1/10.0
- 1% rule +6.7/10.0
- ARV discount +4.7/15.0
- Livability +4.2/5.0
- Rent growth +2.5/5.0
- Condition / age +2.5/5.0
- Schools +1.3/10.0
- Appreciation +0.0/10.0
$149,900
🖨 Deal sheet (PDF) 📄 Offer letter ✓ Due diligence
Listing remarks MLS
Sharp two story home with first floor laundry and half bath. Beautiful original trim throughout. Newer roof, windows and flooring. Sizeable rooms and expandable attic space. Private back yard. Priced to Sell!
Key facts
- First floor laundry
- Original woodwork
- Fenced-in backyard
Tags
Property features AI
Finance
- HOA & community: Sidewalks
Exterior
- Parking: Paved detached garage; Total 2 parking spaces (1 garage space)
- Utilities: Public water; Public sewer; Cable available
- Home design: Single-family residence; Two levels; Residential property; R-1 zoning
- Construction: Aluminum siding; Vinyl siding; Composition roof; Full unfinished basement
- Exterior features: Deck; Patio; Level lot; Paved road
Interior
- Kitchen: Dishwasher; Disposal; Gas oven; Gas range; Refrigerator
- Flooring: Carpet; Laminate; Vinyl
- Bathrooms: 1 full bathroom; 1 half bathroom
- Heating & cooling: Forced air heating; Central air; Ceiling fans
- Interior features: Ceiling fans; Decorative fireplace (1)
Neighborhood map
What this means for you Summary
Snapshot
- This is a 4-bed/1.0-bath single-family listed at $150k.
Deal economics
- At list price, monthly cash flow is $325 ($4k/yr) — positive.
- The deal already cash-flows at list — no discount required.
- Meets the 1% rule at list price ($2k rent vs $150k).
- Cap rate 8.9% vs local median 5.1% in Erie — top-decile yield for the area; either an underpriced asset or a hidden risk that comps aren't pricing in. Stress-test before assuming the spread holds.
Location & tenants
- Location reads 83/100 on livability (#109 in PA, #840 nationally) — a professional / high-income tenant draw. Strengths: amenities A+, commute A+, cost of living A+; Watch: crime D+, employment F.
- Erie City SD (urban): math 12% / reading 19% proficiency, ranked #510 of 539 in PA (top 95%) — low school quality limits family demand, transient renter base, plan for 1-2y turnover; 81% free/reduced lunch — lower-income household profile, screen leases tightly.
- Zoned schools: Perry El Sch (math 8% / reading 17%, grade F, #1,362 of 1,518 statewide, top 92%, 462 students, 100% FRL); Northwest Pa Collegiate Academy (math 82%, 753 students, 100% FRL) — zoned schools average 100% FRL vs 81% district-wide (19 pts higher); higher-poverty schools than district average — tighter screening recommended.
- Market conditions: 76 active listings in the ZIP; 6 comparable units currently listed for rent nearby; rentals lingering (median 46d on market — plan ~5-8 weeks vacancy on turnover, expect pricing pressure); 100% of comp listings sitting > 30 days — soft ceiling on asking rent; 364 units permitted in Erie County in 2024 (188 in 5+ unit buildings).
- This rent runs 37% of the median local income ($56k/yr) — at the standard rent-burdened threshold; future hikes will face affordability resistance.
Forward outlook
- Local home prices are declining (-3.0%/yr); year-one equity from $1k of loan paydown is wiped out by about $4k of value loss. Plan a longer hold.
- Erie County population projected at -14% by 2050 — secular population decline; favor cash flow + early exit over multi-decade hold.
Negotiation context
- Only 2 days on market — expect competitive offers; lowballing is unlikely to land.
- 3 sale attempts since 11y ago with the ask held roughly flat each time — persistent listings suggest the price (not the market) is what's stuck; bring a comps-based counter.
- Current owner paid $87k; list at $150k implies a 72% gain — meaningful room to come down on a strong offer.
Risks & watch-outs
- Watch-outs: built in 1916 — expect roof / HVAC / electrical / plumbing capex.
Questions for the listing agent
- Built in 1916 — when were the roof, HVAC, electrical panel, plumbing, and water heater last replaced?
- Is there a deadline driving the sale (1031 exchange, divorce, estate, relocation)? That informs how much negotiation room exists.
- Crime grade is D in this area — have there been break-ins, vandalism, or insurance claims at this property in the last 3 years? What carrier currently insures it and at what premium?
- What's the average days-on-market for RENTAL listings here right now (not sales)? A rising rental-DOM trend means longer vacancies and softer asking-rent achievability than the comps imply.
- What's the recent tenant-quality profile in this submarket — average credit score on applications, eviction rate, late-payment / NSF rate, and stable-employment percentage? A property-management company in the area should have these aggregated.
- How much new for-sale + rental construction is in the pipeline within 1–3 miles? Heavy new supply typically softens prices + rents 12–24 months out; constrained supply supports both.
Investment metrics
- 1% rule
- 1.17% ✓
- Cap rate
- 8.90%
- Cash-on-cash
- 9.30%
- DSCR
- 1.41
- GRM
- 7.1
CMA / ARV
- ARV (on-the-fly)
- $141,120
- Comps found
- 12
Show comp detail 12 sales within ~0.75 mi
| Address | Dist | Beds/Ba | Sqft | Sold | Price | $/sf | Match |
|---|---|---|---|---|---|---|---|
| 2946 Poplar St | 0.13mi | 3/1.0 (-1) | 1,254 (-13%) | 1mo | $172,000 | $137 | 67 |
| 2618 Hazel St | 0.13mi | 3/1.0 (-1) | 1,226 (-15%) | 1mo | $123,450 | $101 | 64 |
| 942 W 25th St | 0.31mi | 4/1.0 | 1,625 (+13%) | 1mo | $185,000 | $114 | 63 |
| 434 Stafford Ave | 0.38mi | 3/1.0 (-1) | 1,320 (-8%) | 1mo | $127,094 | $96 | 63 |
| 518 W 19th St | 0.66mi | 3/1.0 (-1) | 1,472 (+2%) | 1mo | $109,900 | $75 | 59 |
| 2684 Chestnut St | 0.43mi | 3/1.0 (-1) | 1,572 (+9%) | 1mo | $139,900 | $89 | 59 |
| 1021 W 29th St | 0.31mi | 3/2.0 (-1) | 1,254 (-13%) | 1mo | $145,000 | $116 | 54 |
| 333 W 31 St | 0.52mi | 3/1.0 (-1) | 1,584 (+10%) | 1mo | $95,000 | $60 | 53 |
| 1053 W 20th St | 0.64mi | 3/2.0 (-1) | 1,526 (+6%) | 1mo | $150,000 | $98 | 51 |
| 1617 Liberty St | 0.74mi | 3/1.0 (-1) | 1,332 (-8%) | 1mo | $76,000 | $57 | 47 |
| 3322 Glenwood Park Ave | 0.65mi | 3/1.0 (-1) | 1,248 (-13%) | 1mo | $140,000 | $112 | 42 |
| 1117 W 21st St | 0.65mi | 3/1.0 (-1) | 1,246 (-14%) | 1mo | $118,900 | $95 | 41 |
Match score weights: distance 35% · size 25% · config 20% · recency 20%. Top-matched comps best support the ARV.
Projected returns pro-forma
-3.0% appreciation · 3.0% rent growth · sell at horizon
- IRR
- -2.2%
- Equity multiple
- 0.92×
- Total profit
- $-3,537
- Equity at exit
- $22,351
- IRR
- 7.5%
- Equity multiple
- 1.57×
- Total profit
- $23,751
- Equity at exit
- $12,961
Cash invested: $41,972 (down + closing). Projections, not guarantees.
Landlord ↔ Tenant lean methodology
- Overall (STATE)
- 62 Landlord-Friendly
- State Pennsylvania
- 62 Landlord-Friendly · EVEN
- County
- — inherits STATE
- City
- — inherits STATE
ZIP-level market 16508
- Home prices YoY
- -22.8%
- Active inventory
- 76
- Price-to-rent
- 7.1×
Monthly cashflow live
- Estimated rent
- $1,749 high interval (Pro) →
- Mortgage (P&I)
- −$786
- Tax from tax record
- −$208 /mo · $2,491/yr
- Insurance
- −$62
- HOA
- −$0
- Vacancy / Maint / Mgmt
- −$367
- Net cashflow
- $325
Break-even live
Sensitivity live
| Price | -10% $410 | -5% $368 | +0% $325 | +5% $283 | +10% $240 |
|---|---|---|---|---|---|
| Rent | -10% $187 | -5% $256 | +0% $325 | +5% $394 | +10% $463 |
| Rate | -1.0pp $401 | -0.5pp $363 | base $325 | +0.5pp $286 | +1.0pp $247 |
UW: 25.0% down · 7.5% · 30yr · 1.5% tax · 5.0% vac · 8.0% maint · 8.0% mgmt
Financing live
Cash to close
- Down payment
- $37,475
- Closing costs
- $4,497
- Reserves months
- —
- Total cash needed
- —
Loan-product check · same deal, 3 products live
Conventional
25% down · 7.5% · 30yr
- Down + closing
- —
- Monthly P&I
- —
- Monthly cashflow
- —
- DSCR
- —
- Eligible?
- —
Personal DTI + credit; lowest rate.
DSCR
20% down · 8.5% · 30yr
- Down + closing
- —
- Monthly P&I
- —
- Monthly cashflow
- —
- DSCR
- —
- Eligible?
- —
No personal income docs; deal must DSCR.
Hard money
10% down · 12.0% · 12mo
- Down + closing
- —
- Monthly P&I
- —
- Monthly cashflow
- —
- DSCR
- —
- Eligible?
- —
Short-term bridge; refi at stabilization.
Rent comps 6 comps
| Address | Beds | Baths | Sqft | Rent | $/sqft | DOM | Units | Dist |
|---|---|---|---|---|---|---|---|---|
| 504 W 29th St Unit 2 Erie, PA | 3.0 | 1.0 | 1200 | $1,500 | $1.25 | 45d | 1 | 0.26mi |
| 1610 Poplar St Unit Downstairs Erie, PA | 3.0 | 1.0 | 1200 | $875 | $0.73 | 45d | 1 | 0.77mi |
| 115 W 32nd St Erie, PA | 3.0 | 2.0 | 1844 | $1,050 | $0.57 | 45d | 1 | 0.84mi |
| 126 W 38th St Erie, PA | 4.0 | 2.0 | 1850 | $4,000 | $2.16 | 45d | 1 | 0.97mi |
| 729 W 9th St Erie, PA | 4.0 | 2.0 | 1782 | $3,000 | $1.68 | 45d | 1 | 1.28mi |
| 923 Chestnut St Unit 2 Erie, PA | 4.0 | 2.0 | 1100 | $1,150 | $1.05 | 45d | 1 | 1.31mi |
Listing history 9 events
-
2026-05-26$149,900 Active
-
2019-09-27soldstatus $87,000
-
2019-09-26soldstatus $87,000 208-char remark
Show marketing remark (208 chars)
Sharp two story home with first floor laundry and half bath. Beautiful original trim throughout. Newer roof, windows and flooring. Sizeable rooms and expandable attic space. Private back yard. Priced to Sell!
-
2019-06-10$85,000 208-char remark
Show marketing remark (208 chars)
Sharp two story home with first floor laundry and half bath. Beautiful original trim throughout. Newer roof, windows and flooring. Sizeable rooms and expandable attic space. Private back yard. Priced to Sell!
-
2015-07-16soldstatus $65,000
-
2015-07-15soldstatus $65,000 260-char remark
Show marketing remark (260 chars)
Truly A Beautiful Home Featuring Well Maintained Original Wood Trim With Pocket Doors Between Formal Dining Room And Living Room, Enclosed 21X6 Front Porch And Many Updates Including Roof, Windows, Flooring And Appliances. Lovely Landscaped Private Back Yard.
-
2015-05-29$68,500 260-char remark
Show marketing remark (260 chars)
Truly A Beautiful Home Featuring Well Maintained Original Wood Trim With Pocket Doors Between Formal Dining Room And Living Room, Enclosed 21X6 Front Porch And Many Updates Including Roof, Windows, Flooring And Appliances. Lovely Landscaped Private Back Yard.
-
2001-06-08soldstatus $55,000
-
1979-01-25soldstatus $39,000
ⓘ Source: listings_history table (triggers on properties + properties_extension) + one-shot
backfill from property_details.listing_events for pre-trigger history.
Tax reassessment forecast PA · Partial reset (capped growth)
- Current annual tax
- $2,491 · $208/mo
- Projected year-2 tax
- $2,491 · $208/mo
- Expected delta
- $0/yr ($0/mo · 0.0%)
ⓘ Screening estimate from a state-policy table — verify with the county assessor before closing.
Climate risk First Street
- Flood 4/10 Moderate FEMA zone X (unshaded) · 22% chance over 30 yrs
- Wildfire 1/10 Low
- Heat 2/10 Low 7 d/yr ≥89°F today · 17 d/yr by 30 yrs out
- Wind 1/10 Low
- Air quality 2/10 Low 1 unhealthy d/yr today · 3 by 30 yrs out
Nearby sold comps map
Loading sold comps map…
Walkable amenities ~0.75 mi
Loading nearby amenities…
Taxation est. · year 1
- Rental income
- $20,983
- − Mortgage interest
- −$8,397
- − Property taxes
- −$2,491
- − Insurance
- −$750
- − Repairs & maintenance
- −$1,679
- − Management
- −$1,679
- − Depreciation
- −$4,361
- Taxable income
- $1,628
- Est. tax owed @ 24.0%
- −$391
- After-tax cash flow
- $3,512/yr
For passive investors: Depreciation is non-cash, so a rental often shows a tax loss while cash-flowing — sheltering income. Rental losses are passive: they offset passive income freely, and up to $25,000/yr can offset ordinary (W-2) income if you actively participate and your MAGI is under $100k (phasing out to $0 by $150k); unused losses carry forward. On sale, claimed depreciation is recaptured at up to 25%, and gains may owe capital-gains tax (a 1031 exchange can defer both). Figures are a year-1 estimate at your 24.0% rate — not tax advice; consult a CPA.
Schools (NCES district)
- District
- Erie City SD
- NCES district ID
- 4209300
- Math proficiency
- 12% ▼ -11.00%
- Reading proficiency
- 19% ▼ -16.00%
- Median HH income
- $33,625
- Composite
- 12.59/100
- National rank
- #9617
- State rank
- #510 of 539 in PA
Livability — Erie
- Score
- 83/100
- State rank
- #109
- US rank
- #840
Category grades
Schools grade is shown separately in the Schools card above.
Census & demographics
- Census place
- Erie, PA
- County
- Erie County · 92,215 people
- City population
- 92,215
- Metro
- Erie, PA
- Population (ZIP)
- 14,958
- Household income
- $56,391
- Rent vs Own
- Severe rent burden
- 420.0
Population outlook (Erie County) Hauer SSP2
- Today (2025)
- 272,159 people
- By 2030
- 266,299 · -2.2%
- By 2040
- 250,987 · -7.8%
- By 2050
- 234,925 · -13.7%
- By 2075
- 199,164 · -26.8%
- By 2100
- 162,985 · -40.1%
Race, ethnicity, and origin ACS 2023
- Neighborhood character
- Predominantly White (80%)
- Race & ethnicity
- White 80% Two or more races 12% Black 5% Hispanic / Latino 4% Asian 1%
- Common ancestry
- Romanian 13% Lithuanian 2% Scotch-Irish 2%
- Foreign-born
- 3% · Canada
- Languages at home
- 95% English-only · Spanish 2% Russian/Polish/Slavic 1% Other Indo-European 1%
Political lean MEDSL · Erie
- 2024 margin
- Toss-up / Even · D 49.0% · R 50.0%
- 2008→2024 swing
- -20.9pp toward R · 2008: 19.9pp · 2024: -1.0pp
- All cycles
- 2024: R+1.0 2020: D+1.0 2016: R+2.0 2012: D+16.9 2008: D+19.9
Not yet ingested
- Civics
- —
Market trends
- HPI YoY
- ▼ -74.05%
- Current HPI
- 250.759
- Rent YoY
- —
- Metro
- Erie, PA
- State GDP YoY
- ▲ 1.68%
- F500 in state
- 34
Industry mix (Fortune 500 HQ in PA)
| Industry | F500 HQs | Revenue |
|---|---|---|
| Healthcare | 2 | $309B |
|
||
| Insurance | 2 | $27B |
|
||
| Telecommunications / Media | 1 | $124B |
|
||
| Industrial Distribution | 1 | $22B |
|
||
| Financial Services | 1 | $20B |
|
||
| Chemicals / Materials | 1 | $18B |
|
||
Price history
+284.4% since first listed9 events — show timeline
- 2026-05-26 Listed $149,900 GEBOR
- 2019-09-27 Sold (Public Records) $87,000 Public Records
- 2019-09-26 Sold (MLS) $87,000 GEBOR
- 2019-06-10 Listed $85,000 GEBOR
- 2015-07-16 Sold (Public Records) $65,000 Public Records
- 2015-07-15 Sold (MLS) $65,000 GEBOR
- 2015-05-29 Listed $68,500 GEBOR
- 2001-06-08 Sold (Public Records) $55,000 Public Records
- 1979-01-25 Sold (Public Records) $39,000 Public Records
Property tax history
+1.9%/yrLatest (2026): $2,491 · +3.4% YoY. Source: county tax records.
Cash-flow waterfall
monthlySold comps — $/sqft
last 12 mo · ≤1 miLoading sold comps…