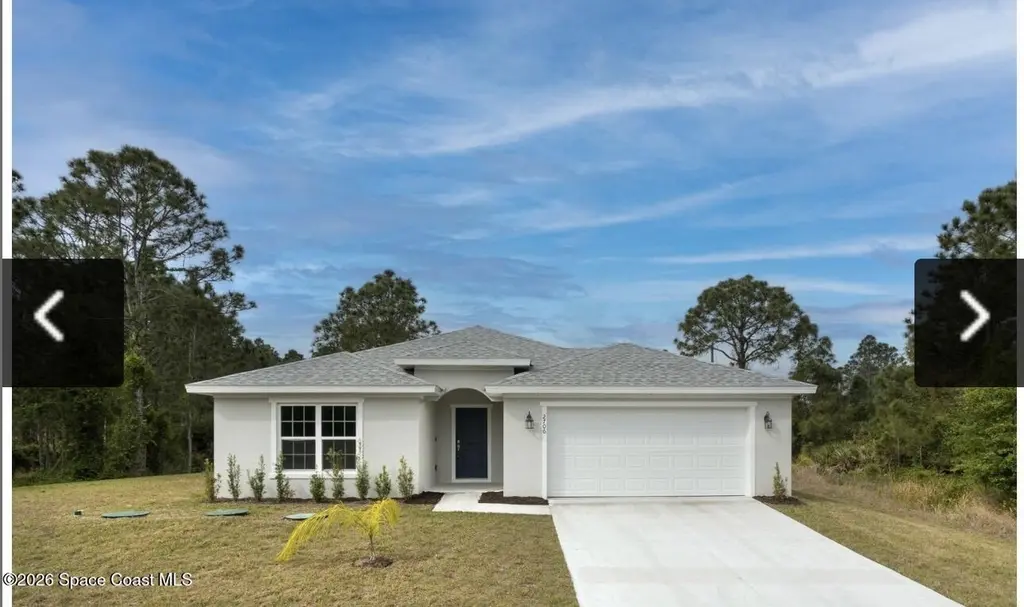
901 Brickell St SE · Palm Bay, FL
Flood risk 1/10 · Minimal
- FEMA flood zone
- X (unshaded)
- Chance of flooding over 30 yrs
- 0.0%
- Est. flood insurance / yr
- $507 – $1,088
Fire risk 1/10 · Minimal
- Est. fire insurance / yr
- $947 – $1,759
Heat risk 9/10 · Severe
- Hot days now (above 106°F)
- 7 days/yr
- Hot days in 30 yrs
- 22 days/yr
Wind risk 10/10 · Severe
- Chance of severe wind over 30 yrs
- 99.0%
Air-quality risk 1/10 · Minimal
- Unhealthy air days now
- 0 days/yr
- Unhealthy air days in 30 yrs
- 0 days/yr
Risk factors via First Street. Map © Google.
Why this score? — see what drove the B grade
The composite is a weighted blend of 9 inputs, each scored 0–100. Each bar is that input's sub-score; the figure is the points it added to the 100-point composite (weight × sub-score).
- Cash flow +25.1/30.0
- Appreciation +10.0/10.0
- DSCR +8.2/10.0
- ARV discount +7.5/15.0
- 1% rule +5.3/10.0
- Schools +4.7/10.0
- Livability +3.6/5.0
- Rent growth +3.4/5.0
- Condition / age +2.5/5.0
$225,000
🖨 Deal sheet 📄 Offer letter ✓ Due diligence
Listing remarks
INVESTORS OPPORTUNITY!!! This house is at the final stages of construction, all permit has expired, buyers or buyers agent to do diligence. Beautiful 4/2, Vinyl floors through the house quartz top counter and more to see it.
Key facts
- 0.24 acre lot
- 2 garage spots
- Built 2026
Property features AI
Exterior
- Parking: Attached garage with space for 2 cars
- Utilities: Aerobic septic system; Cable available; Electricity available; Water available
- Home design: Single Family Residence; New construction
- Construction: Built with concrete and stucco
- Exterior features: Lot with other/unspecified features; Lot size approximately 0.24 acres; Property faces south
Interior
- Kitchen: Kitchen located on the main level
- Bedrooms: 4 bedrooms, all on the main level
- Bathrooms: 2 full bathrooms
- Heating & cooling: Central heating (electric); Central air conditioning
- Interior features: 9 total rooms; Main-level layout for primary rooms
- Laundry & utility: Unfurnished (no built-in washer/dryer listed)
Neighborhood map
What this means for you Summary
Snapshot
- This is a 4-bed/2.0-bath land listed at $225k.
Deal economics
- At list price, monthly cash flow is $496 ($6k/yr) — positive.
- The deal already cash-flows at list — no discount required.
- Meets the 1% rule at list price ($2k rent vs $225k).
Location & tenants
- Location reads 72/100 on livability (#366 in FL) — a middle-class / working-renter tenant base. Strengths: cost of living A+, housing A+; Watch: employment D+, amenities F, health & safety D-.
- Brevard (suburban): math 53% / reading 57% proficiency, ranked #19 of 73 in FL (top 26%) — acceptable for families but not a draw, mixed tenant base, ~2y average lease.
- Zoned schools: John F. Turner Senior Elementary School (math 38% / reading 43%, grade F, #1,471 of 2,144 statewide, top 69%, 543 students, 69% FRL); Southwest Middle School (math 40% / reading 39%, grade F, #373 of 571 statewide, top 66%, 920 students, 58% FRL); Palm Bay Magnet Senior High School (math 25% / reading 37%, grade F, #429 of 667 statewide, top 65%, 1,486 students, 63% FRL) — zoned schools average 63% FRL vs 43% district-wide (20 pts higher); higher-poverty schools than district average — tighter screening recommended.
- Zoned-school proficiency averages 37% at this address vs 55% district-wide (-18 pts) — the specific schools serving this property underperform the Brevard average; the district grade overstates school quality for this exact location.
- Market conditions: Rents rising (+3.7%/yr); 1111 active listings in the ZIP; 26 comparable units currently listed for rent nearby; rentals at typical pace (median 21d on market — plan ~3-4 weeks tenant-placement turnaround); solid renter incomes; 4,602 units permitted in Brevard County in 2024 (702 in 5+ unit buildings).
- This rent runs 35% of the median local income ($80k/yr) — at the standard rent-burdened threshold; future hikes will face affordability resistance.
Forward outlook
- In year one you build about $24k of equity ($2k loan paydown + $22k appreciation (10.0% local appreciation)).
- Brevard County population projected at +15% by 2050 — modest demand growth; plan on rents tracking national, not racing it.
- At projected returns (10.0% appreciation + 3.7% rent growth), your $63k cash investment doubles in ~2 years — after that, you're playing with house money.
- By year 2, paydown + projected appreciation supports a ~$39k cash-out refi (75% LTV) — recoverable capital for the next deal without selling this one.
Negotiation context
- Only 1 days on market — expect competitive offers; lowballing is unlikely to land.
- 8 sale attempts since 2y ago with the ask held roughly flat each time — persistent listings suggest the price (not the market) is what's stuck; bring a comps-based counter.
- Current owner paid $34k; list at $225k implies a 562% gain — meaningful room to come down on a strong offer.
Risks & watch-outs
- Climate carrying-cost: severe wind risk, 99% chance of damaging wind over 30y; extreme-heat days projected 7→22/yr by 2055 (HVAC capex compounding) — expect insurance premiums to compound above CPI over the hold.
Questions for the listing agent
- Is there a deadline driving the sale (1031 exchange, divorce, estate, relocation)? That informs how much negotiation room exists.
- What's the average days-on-market for RENTAL listings here right now (not sales)? A rising rental-DOM trend means longer vacancies and softer asking-rent achievability than the comps imply.
- What's the recent tenant-quality profile in this submarket — average credit score on applications, eviction rate, late-payment / NSF rate, and stable-employment percentage? A property-management company in the area should have these aggregated.
- How much new for-sale + rental construction is in the pipeline within 1–3 miles? Heavy new supply typically softens prices + rents 12–24 months out; constrained supply supports both.
Investment metrics
- 1% rule
- 1.03% ✓
- Cap rate
- 8.94%
- Cash-on-cash
- 9.44%
- DSCR
- 1.42
- GRM
- 8.1
CMA / ARV
No comps found within radius.
Projected returns pro-forma
10.0% appreciation · 3.67% rent growth · sell at horizon
- IRR
- 31.4%
- Equity multiple
- 3.47×
- Total profit
- $155,577
- Equity at exit
- $202,698
- IRR
- 27.3%
- Equity multiple
- 7.93×
- Total profit
- $436,387
- Equity at exit
- $437,126
Cash invested: $63,000 (down + closing). Projections, not guarantees.
Landlord ↔ Tenant lean methodology
- Overall (STATE)
- 87 Strongly Landlord-Friendly
- State Florida
- 87 Strongly Landlord-Friendly · R+3
- County
- — inherits STATE
- City
- — inherits STATE
ZIP-level market 32909
- Home prices YoY
- 6.0%
- Rents YoY
- 3.7%
- Active inventory
- 1111
- Price-to-rent
- 8.1×
Monthly cashflow live
- Estimated rent
- $2,311 high interval (Pro) →
- Mortgage (P&I)
- −$1,180
- Tax from tax record
- −$56 /mo · $676/yr
- Insurance
- −$94
- HOA
- −$0
- Vacancy / Maint / Mgmt
- −$485
- Net cashflow
- $496
Break-even live
UW: 25.0% down · 7.5% · 30yr · 1.5% tax · 5.0% vac · 8.0% maint · 8.0% mgmt
Financing live
Cash to close
- Down payment
- $56,250
- Closing costs
- $6,750
- Reserves months
- —
- Total cash needed
- —
Loan-product check · same deal, 3 products live
Conventional
25% down · 7.5% · 30yr
- Down + closing
- —
- Monthly P&I
- —
- Monthly cashflow
- —
- DSCR
- —
- Eligible?
- —
Personal DTI + credit; lowest rate.
DSCR
20% down · 8.5% · 30yr
- Down + closing
- —
- Monthly P&I
- —
- Monthly cashflow
- —
- DSCR
- —
- Eligible?
- —
No personal income docs; deal must DSCR.
Hard money
10% down · 12.0% · 12mo
- Down + closing
- —
- Monthly P&I
- —
- Monthly cashflow
- —
- DSCR
- —
- Eligible?
- —
Short-term bridge; refi at stabilization.
Rent comps 26 comps
| Address | Beds | Baths | Sqft | Rent | $/sqft | DOM | Units | Dist |
|---|---|---|---|---|---|---|---|---|
| 907 Algardi St SE Palm Bay, FL | 4.0 | 2.0 | 1943 | $2,330 | $1.20 | 23d | 1 | 0.13mi |
| 743 Andrew St SE Palm Bay, FL | 3.0 | 2.0 | 1252 | $1,895 | $1.51 | 23d | 1 | 0.33mi |
| 1205 Jaslo St SE Palm Bay, FL | 1.0–3.0 | 1.0–2.0 | 992 | $2,245 | $2.26 | 14d | 8 | 0.64mi |
| 84 San Filippo Dr SE Palm Bay, FL | 1.0–3.0 | 1.0–2.0 | 1052 | $2,044 | $1.94 | 14d | 30 | 0.70mi |
| 721 Taluga Ave SE Palm Bay, FL | 3.0 | 2.0 | 1556 | $1,800 | $1.16 | 23d | 1 | 0.75mi |
| 896 Talmadge Ave SE Palm Bay, FL | 3.0 | 2.0 | 1263 | $1,900 | $1.50 | 14d | 1 | 0.76mi |
| 885 Talmadge Ave SE Palm Bay, FL | 3.0 | 2.0 | 1787 | $2,300 | $1.29 | 21d | 1 | 0.78mi |
| 710 Avalon St SE Palm Bay, FL | 3.0 | 2.0 | 1378 | $1,995 | $1.45 | 23d | 1 | 0.79mi |
| 829 Tampa Ave SE Palm Bay, FL | 3.0 | 2.0 | 1303 | $1,740 | $1.34 | 23d | 1 | 0.91mi |
| 490 Hatcher St SE Palm Bay, FL | 4.0 | 2.0 | 1833 | $2,150 | $1.17 | 21d | 1 | 0.95mi |
| 647 Airoso Rd SE Palm Bay, FL | 4.0 | 3.0 | 2365 | $2,900 | $1.23 | 13d | 1 | 0.96mi |
| 431 Brantley St SE Palm Bay, FL | 3.0 | 2.0 | 1326 | $2,050 | $1.55 | 18d | 1 | 0.98mi |
| 1129 Colonial Ave SE Palm Bay, FL | 4.0 | 3.0 | 2008 | $2,500 | $1.25 | 18d | 1 | 1.02mi |
| 1255 Wadsworth St SE Unit 1255 Palm Bay, FL | 3.0 | 3.0 | 1747 | $2,350 | $1.35 | 18d | 1 | 1.10mi |
| 309 Cactus St SE Palm Bay, FL | 4.0 | 2.0 | 1846 | $2,195 | $1.19 | 14d | 1 | 1.10mi |
| 272 Aquarius Ave SE Palm Bay, FL | 4.0 | 2.0 | 1650 | $1,995 | $1.21 | 23d | 1 | 1.11mi |
| 857 Buchanan Ave SE Palm Bay, FL | 3.0 | 2.0 | 1257 | $1,950 | $1.55 | 23d | 1 | 1.17mi |
| 320 Algiers Ave SE Palm Bay, FL | 3.0 | 2.0 | 1306 | $1,825 | $1.40 | 23d | 1 | 1.17mi |
| 1290 Sail Ct SE Palm Bay, FL | 3.0 | 2.0 | 1509 | $1,945 | $1.29 | 23d | 1 | 1.30mi |
| 914 Caligula Ave SE Palm Bay, FL | 3.0 | 2.0 | 1371 | $1,841 | $1.34 | 13d | 1 | 1.32mi |
| 1224 Buffing Cir SE Palm Bay, FL | 4.0 | 2.0 | 2233 | $2,395 | $1.07 | 14d | 1 | 1.33mi |
| 1210 Vandalia Ave SE Palm Bay, FL | 4.0 | 2.0 | 1833 | $2,050 | $1.12 | 14d | 1 | 1.33mi |
| 171 Okeefe St SE Palm Bay, FL | 3.0 | 2.0 | 1288 | $1,855 | $1.44 | 14d | 1 | 1.34mi |
| 822 Seven Gables Cir SE Palm Bay, FL | 3.0 | 2.0 | 1474 | $1,835 | $1.24 | 23d | 1 | 1.36mi |
| 818 Seven Gables Cir SE Palm Bay, FL | 3.0 | 2.0 | 1490 | $1,795 | $1.20 | 23d | 1 | 1.38mi |
| 334 Bordeaux Ave NE Palm Bay, FL | 4.0 | 2.0 | 2083 | $2,250 | $1.08 | 14d | 1 | 1.45mi |
Listing history 23 events
-
2026-05-19status Pending
-
2026-05-19$225,000 Active
-
2025-12-18historical
-
2025-10-28status Active
-
2025-10-28status Active
-
2025-10-28status Active
-
2025-09-19status Pending
-
2025-09-19historical Active Under Contract
-
2025-09-19status Pending
-
2025-09-19historical
-
2025-07-03price $336,900
-
2025-07-03price $336,900
-
2025-07-03price $336,900
-
2025-06-18$349,900 Active
-
2025-06-18$349,900 Active
-
2025-06-18$349,900 Active
-
2025-02-25historical
-
2024-10-14price $359,900
-
2024-09-20price $339,900
-
2024-03-10$349,900 Active
-
2022-03-11soldstatus $34,000
-
2005-06-09soldstatus $45,000
-
2004-07-06soldstatus $9,500
ⓘ Source: listings_history table (triggers on properties + properties_extension) + one-shot
backfill from property_details.listing_events for pre-trigger history.
Tax reassessment forecast FL · Resets to sale price
- Current annual tax
- $676 · $56/mo
- Projected year-2 tax
- $1,868 · $156/mo
- Expected delta
- +$1,191/yr (+$99/mo · 176.1%)
ⓘ Screening estimate from a state-policy table — verify with the county assessor before closing.
Climate risk First Street
- Flood 1/10 Low FEMA zone X (unshaded) · 0% chance over 30 yrs
- Wildfire 1/10 Low
- Heat 9/10 Extreme 7 d/yr ≥106°F today · 22 d/yr by 30 yrs out
- Wind 10/10 Extreme 99% chance of damaging wind over 30 yrs
- Air quality 1/10 Low 0 unhealthy d/yr today · 0 by 30 yrs out
Nearby sold comps map
Loading sold comps map…
Walkable amenities ~0.75 mi
Loading nearby amenities…
Taxation est. · year 1
- Rental income
- $27,733
- − Mortgage interest
- −$12,603
- − Property taxes
- −$676
- − Insurance
- −$1,125
- − Repairs & maintenance
- −$2,219
- − Management
- −$2,219
- − Depreciation
- −$6,545
- Taxable income
- $2,345
- Est. tax owed @ 24.0%
- −$563
- After-tax cash flow
- $5,386/yr
For passive investors: Depreciation is non-cash, so a rental often shows a tax loss while cash-flowing — sheltering income. Rental losses are passive: they offset passive income freely, and up to $25,000/yr can offset ordinary (W-2) income if you actively participate and your MAGI is under $100k (phasing out to $0 by $150k); unused losses carry forward. On sale, claimed depreciation is recaptured at up to 25%, and gains may owe capital-gains tax (a 1031 exchange can defer both). Figures are a year-1 estimate at your 24.0% rate — not tax advice; consult a CPA.
Schools (NCES district)
- District
- Brevard
- NCES district ID
- 1200150
- Math proficiency
- 53% ▼ -9.00%
- Reading proficiency
- 57% ▼ -4.00%
- Median HH income
- $49,426
- Composite
- 46.86/100
- National rank
- #2370
- State rank
- #19 of 73 in FL
Livability — Palm Bay
- Score
- 72/100
- State rank
- #366
- US rank
- #6458
Category grades
Schools grade is shown separately in the Schools card above.
Census & demographics
- Census place
- Palm Bay, FL
- County
- Brevard County · 602,871 people
- City population
- 132,211
- Metro
- Palm Bay-Melbourne-Titusville, FL
- Population (ZIP)
- 41,804
- Household income
- $79,977
- Rent vs Own
- Severe rent burden
- 697.0
Population outlook (Brevard County) Hauer SSP2
- Today (2025)
- 623,254 people
- By 2030
- 648,420 · +4.0%
- By 2040
- 690,009 · +10.7%
- By 2050
- 715,669 · +14.8%
- By 2075
- 775,744 · +24.5%
- By 2100
- 776,687 · +24.6%
Race, ethnicity, and origin ACS 2023
- Neighborhood character
- Diverse neighborhood (Simpson 0.70)
- Race & ethnicity
- White 46% Black 21% Hispanic / Latino 20% Two or more races 16% Asian 4%
- Hispanic origin (detail)
- Mexican 2% Puerto Rican 8% Cuban 5%
- Common ancestry
- Hispanic 3% Slovak 2% Lithuanian 2%
- Foreign-born
- 17% · Canada, China, Jamaica
- Languages at home
- 84% English-only · Spanish 9% French/Haitian/Cajun 4% Chinese 1%
Political lean MEDSL · Brevard
- 2024 margin
- Strong R (+20.8) · D 39.1% · R 59.9% · Other 1.0%
- 2008→2024 swing
- -10.4pp toward R · 2008: -10.4pp · 2024: -20.8pp
- All cycles
- 2024: R+20.8 2020: R+16.4 2016: R+19.8 2012: R+12.7 2008: R+10.4
Not yet ingested
- Civics
- —
Market trends
- HPI YoY
- ▲ 18.81%
- Current HPI
- 330.8595
- Rent YoY
- ▲ 3.67%
- Metro
- Palm Bay-Melbourne-Titusville, FL
- State GDP YoY
- ▲ 3.28%
- F500 in state
- 36
Industry mix (Fortune 500 HQ in FL)
| Industry | F500 HQs | Revenue |
|---|---|---|
| Industrial Technology | 2 | $29B |
|
||
| Insurance | 2 | $17B |
|
||
| Retail | 1 | $60B |
|
||
| Technology Distribution | 1 | $58B |
|
||
| Homebuilding | 1 | $35B |
|
||
| Technology Manufacturing | 1 | $35B |
|
||
Price history
+2268.4% since first listed23 events — show timeline
- 2026-05-19 Pending — SCMLS
- 2026-05-19 Listed $225,000 SCMLS
- 2025-12-18 Listing Removed — MARMLS
- 2025-10-28 Relisted — MARMLS
- 2025-10-28 Relisted — SCMLS
- 2025-10-28 Relisted — RAIRCMLS
- 2025-09-19 Pending — MARMLS
- 2025-09-19 Contingent — RAIRCMLS
- 2025-09-19 Pending — SCMLS
- 2025-09-19 Listing Removed — SCMLS
- 2025-07-03 Price Changed $336,900 MARMLS
- 2025-07-03 Price Changed $336,900 SCMLS
- 2025-07-03 Price Changed $336,900 RAIRCMLS
- 2025-06-18 Listed $349,900 SCMLS
- 2025-06-18 Listed $349,900 MARMLS
- 2025-06-18 Listed $349,900 RAIRCMLS
- 2025-02-25 Listing Removed — SCMLS
- 2024-10-14 Price Changed $359,900 SCMLS
- 2024-09-20 Price Changed $339,900 SCMLS
- 2024-03-10 Listed $349,900 SCMLS
- 2022-03-11 Sold (Public Records) $34,000 Public Records
- 2005-06-09 Sold (Public Records) $45,000 Public Records
- 2004-07-06 Sold (Public Records) $9,500 Public Records
Property tax history
+19.4%/yrLatest (2025): $676 · +11.7% YoY. Source: county tax records.
Cash-flow waterfall
monthlySold comps — $/sqft
last 12 mo · ≤1 miLoading sold comps…