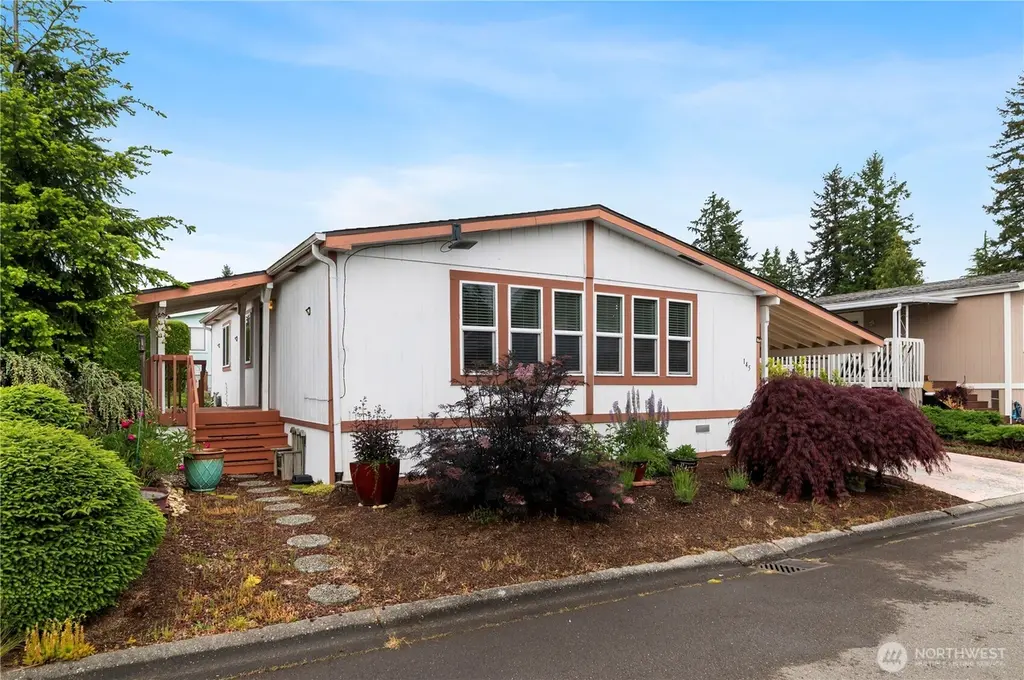
1427 100th St SW #145 · Everett, WA
Flood risk No data
- FEMA flood zone
- —
- Chance of flooding over 30 yrs
- —
- Est. flood insurance / yr
- —
Fire risk No data
- Est. fire insurance / yr
- —
Heat risk No data
- Hot days now (above threshold)
- —
- Hot days in 30 yrs
- —
Wind risk No data
- Chance of severe wind over 30 yrs
- —
Air-quality risk No data
- Unhealthy air days now
- —
- Unhealthy air days in 30 yrs
- —
Risk factors via First Street. Map © Google.
Why this score? — see what drove the B+ grade
The composite is a weighted blend of 9 inputs, each scored 0–100. Each bar is that input's sub-score; the figure is the points it added to the 100-point composite (weight × sub-score).
- Cash flow +30.0/30.0
- ARV discount +13.5/15.0
- 1% rule +10.0/10.0
- DSCR +10.0/10.0
- Schools +4.8/10.0
- Livability +3.7/5.0
- Condition / age +2.5/5.0
- Rent growth +2.1/5.0
- Appreciation +0.0/10.0
$130,000
🖨 Deal sheet 📄 Offer letter ✓ Due diligence
Listing remarks
SELLER IS OFFERING 3 FREE MONTHS AND SO IS THE PARK!!! Come check this bright and beautifully maintained home in a quiet & friendly 55+ park community! Featuring an open layout filled with a ton of natural light, offering stylish & durable LVP flooring throughout. The spacious layout is perfect for everyday living & entertaining. The primary bedroom offers an en-suite bath for an added bonus as well as lots of storage space. Fully equipped with A/C as well as new water heater, garbage disposal & microwave. Enjoy outdoor relaxation in your private oasis w/ plush greenery surrounding you while relaxing outside on your patio. Conveniently located near shopping, dining a
Key facts
- A/c
- New water heater
- Open layout
Tags
Neighborhood map
What this means for you Summary
Snapshot
- This is a 3-bed/2.0-bath manufactured listed at $130k.
Deal economics
- At list price, monthly cash flow is $971 ($12k/yr) — positive.
- The deal already cash-flows at list — no discount required.
- Meets the 1% rule at list price ($2k rent vs $130k).
- Recommended offer: $114k (12.0% below list) — sets the bar for market timing.
- Cap rate 15.3% vs local median 2.5% in Everett — top-decile yield for the area; either an underpriced asset or a hidden risk that comps aren't pricing in. Stress-test before assuming the spread holds.
Location & tenants
- Location reads 73/100 on livability (#199 in WA) — a middle-class / working-renter tenant base. Strengths: commute A+, housing A, health & safety A; Watch: schools C-, crime D+, amenities F.
- Mukilteo School District (suburban): math 47% / reading 59% proficiency, ranked #111 of 291 in WA (top 38%) — acceptable for families but not a draw, mixed tenant base, ~2y average lease.
- Market conditions: Rents soft (-1.7%/yr); 167 active listings in the ZIP; 39 comparable units currently listed for rent nearby; rentals leasing fast (median 5d on market — plan ~1-2 weeks tenant-placement turnaround); 3,982 units permitted in Snohomish County in 2024 (1,492 in 5+ unit buildings).
- This rent runs 39% of the median local income ($69k/yr) — at the standard rent-burdened threshold; future hikes will face affordability resistance.
Forward outlook
- Local home prices are declining (-3.0%/yr); year-one equity from $899 of loan paydown is wiped out by about $4k of value loss. Plan a longer hold.
- Snohomish County population projected at +30% by 2050 — long-run rental-demand tailwind backs the buy-and-hold thesis.
- At projected returns (-3.0% appreciation + 0.0% rent growth), your $36k cash investment doubles in ~5 years — after that, you're playing with house money.
Negotiation context
- It's been on market 380 days — a 12% lower offer ($114k) is reasonable based on typical stale-listing flexibility.
- 7 sale attempts since 15y ago; this cycle's ask has dropped $70k (35%) from the opening price — seller is motivated, your offer sets the floor, not the list.
Questions for the listing agent
- It's been on market 380 days. Have you received any prior offers? Is the seller open to a 12% concession, seller financing, or rate buy-down credit?
- Why hasn't it sold? Are there any deal-killer items the seller is aware of (foundation, flood, title, zoning, code violations)?
- Is there a deadline driving the sale (1031 exchange, divorce, estate, relocation)? That informs how much negotiation room exists.
- Crime grade is D in this area — have there been break-ins, vandalism, or insurance claims at this property in the last 3 years? What carrier currently insures it and at what premium?
- What's the average days-on-market for RENTAL listings here right now (not sales)? A rising rental-DOM trend means longer vacancies and softer asking-rent achievability than the comps imply.
- What's the recent tenant-quality profile in this submarket — average credit score on applications, eviction rate, late-payment / NSF rate, and stable-employment percentage? A property-management company in the area should have these aggregated.
- How much new for-sale + rental construction is in the pipeline within 1–3 miles? Heavy new supply typically softens prices + rents 12–24 months out; constrained supply supports both.
Investment metrics
- 1% rule
- 1.72% ✓
- Cap rate
- 15.26%
- Cash-on-cash
- 32.02%
- DSCR
- 2.42
- GRM
- 4.8
CMA / ARV
- ARV (median comp)
- $150,000
- List price
- $130,000
- Delta
- -13.33%
- Verdict
- UNDERPRICED
- Comps
- 11 within 1.0 mi
Show comp detail 8 sales within ~0.75 mi
| Address | Dist | Beds/Ba | Sqft | Sold | Price | $/sf | Match |
|---|---|---|---|---|---|---|---|
| 1427 100th St SW #2 | 0.00mi | 2/2.0 (-1) | 1,080 (0%) | 9mo | $45,000 | $42 | 87 |
| 9931 18th Ave W #3 | 0.20mi | 2/2.0 (-1) | 1,060 (-2%) | 8mo | $175,000 | $165 | 76 |
| 1427 100th St SW #91 | 0.00mi | 2/2.0 (-1) | 1,172 (+8%) | 12mo | $65,000 | $55 | 71 |
| 10112 Holly Dr | 0.33mi | 3/2.0 | 1,080 (0%) | 17mo | $546,000 | $506 | 71 |
| 1427 100th St SW #105 | 0.00mi | 2/2.0 (-1) | 1,215 (+12%) | 19mo | $145,000 | $119 | 58 |
| 9931 18th Ave W #37 | 0.20mi | 2/2.0 (-1) | 924 (-14%) | 12mo | $144,400 | $156 | 52 |
| 1531 108th St SW | 0.68mi | 3/2.0 | 1,146 (+6%) | 20mo | $370,000 | $323 | 41 |
| 1632 107th St SW | 0.56mi | 2/1.5 (-1) | 945 (-12%) | 12mo | $490,000 | $519 | 36 |
Match score weights: distance 35% · size 25% · config 20% · recency 20%. Top-matched comps best support the ARV.
Projected returns pro-forma
-3.0% appreciation · 0.0% rent growth · sell at horizon
- IRR
- 23.7%
- Equity multiple
- 1.94×
- Total profit
- $34,201
- Equity at exit
- $19,383
- IRR
- 29.7%
- Equity multiple
- 3.31×
- Total profit
- $83,955
- Equity at exit
- $11,240
Cash invested: $36,400 (down + closing). Projections, not guarantees.
Landlord ↔ Tenant lean methodology
- Overall (STATE)
- 28 Tenant-Leaning
- State Washington
- 28 Tenant-Leaning · D+8
- County
- — inherits STATE
- City
- — inherits STATE
ZIP-level market 98204
- Rents YoY
- -1.7%
- Active inventory
- 167
- Price-to-rent
- 4.8×
Monthly cashflow live
- Estimated rent
- $2,240 high interval (Pro) →
- Mortgage (P&I)
- −$682
- Tax from tax record
- −$62 /mo · $745/yr
- Insurance
- −$54
- HOA
- −$0
- Vacancy / Maint / Mgmt
- −$470
- Net cashflow
- $971
Break-even live
UW: 25.0% down · 7.5% · 30yr · 1.5% tax · 5.0% vac · 8.0% maint · 8.0% mgmt
Financing live
Cash to close
- Down payment
- $32,500
- Closing costs
- $3,900
- Reserves months
- —
- Total cash needed
- —
Loan-product check · same deal, 3 products live
Conventional
25% down · 7.5% · 30yr
- Down + closing
- —
- Monthly P&I
- —
- Monthly cashflow
- —
- DSCR
- —
- Eligible?
- —
Personal DTI + credit; lowest rate.
DSCR
20% down · 8.5% · 30yr
- Down + closing
- —
- Monthly P&I
- —
- Monthly cashflow
- —
- DSCR
- —
- Eligible?
- —
No personal income docs; deal must DSCR.
Hard money
10% down · 12.0% · 12mo
- Down + closing
- —
- Monthly P&I
- —
- Monthly cashflow
- —
- DSCR
- —
- Eligible?
- —
Short-term bridge; refi at stabilization.
Rent comps 39 comps
| Address | Beds | Baths | Sqft | Rent | $/sqft | DOM | Units | Dist |
|---|---|---|---|---|---|---|---|---|
| 9727 18th Ave W Unit B103 Everett, WA | 2.0 | 2.0 | 797 | $1,795 | $2.25 | 5d | 1 | 0.13mi |
| 9900 12th Ave W Everett, WA | 1.0–3.0 | 1.0–2.0 | 1033 | $2,892 | $2.80 | 2d | 15 | 0.16mi |
| 1826 98th Pl SW Unit B Everett, WA | 3.0 | 2.5 | 1467 | $2,650 | $1.81 | 2d | 1 | 0.25mi |
| 1826 98th Pl SW Unit B Everett, WA | 3.0 | 2.5 | 1467 | $2,650 | $1.81 | 5d | 1 | 0.25mi |
| 10115 Holly Dr Everett, WA | 1.0–3.0 | 1.0–2.0 | 1003 | $2,720 | $2.71 | 10d | 22 | 0.39mi |
| 10115 Holly Dr Everett, WA | 1.0–3.0 | 1.0–2.0 | 1003 | $2,720 | $2.71 | 2d | 24 | 0.39mi |
| 10111 9th Ave W Everett, WA | 1.0–2.0 | 1.0–2.5 | 1098 | $2,550 | $2.32 | 5d | 4 | 0.48mi |
| 9615 Holly Dr Everett, WA | 1.0–2.0 | 1.0 | 645 | $2,220 | $3.44 | 5d | 1 | 0.59mi |
| 10720 Washington Way Everett, WA | 2.0 | 1.0 | 700 | $2,200 | $3.14 | 2d | 1 | 0.66mi |
| 8600 18th Ave W Everett, WA | 1.0–3.0 | 1.0–2.0 | 871 | $2,446 | $2.81 | 2d | 11 | 0.67mi |
| 1926 W Casino Rd Everett, WA | 1.0–2.0 | 1.0–2.0 | 747 | $1,950 | $2.61 | 2d | 23 | 0.69mi |
| 9925 4th Ave W Apt 6 Everett, WA | 2.0 | 2.0 | 1000 | $1,445 | $1.45 | 2d | 1 | 0.74mi |
| 1126 W Casino Rd Everett, WA | 1.0–2.0 | 1.0–2.0 | 827 | $1,850 | $2.24 | 43d | 5 | 0.77mi |
| 222 W Marilyn Ave Everett, WA | 3.0 | 1.0 | 1000 | $2,400 | $2.40 | 16d | 1 | 0.78mi |
| 215 100th St SW Everett, WA | 2.0 | 2.0 | 856 | $1,845 | $2.16 | 5d | 1 | 0.78mi |
| 1906 W Casino Rd Unit 11 Everett, WA | 2.0 | 1.0 | 800 | $1,700 | $2.12 | 43d | 1 | 0.82mi |
| 1020 W Casino Rd Everett, WA | 1.0–2.0 | 1.0 | 880 | $1,825 | $2.07 | 5d | 20 | 0.82mi |
| 8710 5th Ave W Everett, WA | 2.0 | 2.0 | 950 | $2,050 | $2.16 | 2d | 11 | 0.85mi |
| 702 W Casino Rd Everett, WA | 1.0–2.0 | 1.0–1.5 | 850 | $1,749 | $2.06 | 5d | 21 | 0.85mi |
| 1305 W Casino Rd Everett, WA | 1.0–2.0 | 1.0–2.0 | 881 | $1,800 | $2.04 | 5d | 5 | 0.88mi |
| 8530 5th Ave W Everett, WA | 1.0–2.0 | 1.0 | 808 | $1,595 | $1.97 | 5d | 2 | 0.90mi |
| 1001 W Casino Rd Unit A306 Everett, WA | 2.0 | 2.0 | 921 | $2,150 | $2.33 | 5d | 1 | 0.91mi |
| 8225 11th Dr W Everett, WA | 2.0 | 1.0 | 850 | $1,722 | $2.03 | 5d | 2 | 0.91mi |
| 923 112th St SW Everett, WA | 1.0–3.0 | 1.0–2.0 | 858 | $2,305 | $2.69 | 2d | 24 | 0.98mi |
| 11207 9th Pl W Everett, WA | 2.0 | 1.0 | 995 | $1,899 | $1.91 | 20d | 7 | 1.01mi |
| 1730 112th St SW Everett, WA | 1.0–2.0 | 1.0–2.0 | 805 | $2,100 | $2.61 | 1d | 6 | 1.04mi |
| 1020 112th St SW Everett, WA | 1.0–2.0 | 1.0–2.0 | 853 | $1,752 | $2.05 | 2d | 7 | 1.06mi |
| 8920 Evergreen Way Everett, WA | 2.0 | 1.0 | 567 | $1,750 | $3.08 | 2d | 5 | 1.09mi |
| 120 W Casino Rd Everett, WA | 1.0–2.0 | 1.0–1.5 | 818 | $1,993 | $2.43 | 2d | 13 | 1.11mi |
| 120 SE Everett Mall Way Everett, WA | 1.0–2.0 | 1.0–2.0 | 813 | $2,172 | $2.67 | 2d | 43 | 1.16mi |
| 115 Dorn Ave Everett, WA | 2.0 | 1.0–2.0 | 946 | $1,738 | $1.84 | 16d | 1 | 1.16mi |
| 207 Dorn Ave Unit 2H Everett, WA | 2.0 | 1.0 | 780 | $1,795 | $2.30 | 15d | 1 | 1.20mi |
| 2301 116th St SW Unit E Everett, WA | 3.0 | 2.5 | 1400 | $2,595 | $1.85 | 43d | 1 | 1.21mi |
| 233 Dorn Ave Unit 1 Everett, WA | 2.0 | 1.0 | 944 | $1,950 | $2.07 | 11d | 1 | 1.22mi |
| 1108 Center Rd Everett, WA | 2.0 | 2.0 | 1200 | $2,150 | $1.79 | 15d | 1 | 1.31mi |
| 11715 Center Rd Unit A Everett, WA | 2.0 | 1.0 | 750 | $1,700 | $2.27 | 43d | 1 | 1.33mi |
| 11812 E Gibson Rd Everett, WA | 2.0 | 2.0 | 956 | $1,810 | $1.89 | 2d | 7 | 1.36mi |
| 12121 Admiralty Way Everett, WA | 1.0–3.0 | 1.0–2.0 | 1116 | $2,855 | $2.56 | 3d | 18 | 1.48mi |
| 12118 Highway 99 Everett, WA | 1.0–5.0 | 1.0–3.0 | 1117 | $2,236 | $2.00 | 2d | 5 | 1.48mi |
Listing history 41 events
-
2026-06-18days on market $130,000 Active 380 DOM
-
2026-06-17days on market $130,000 Active 379 DOM
-
2026-06-16days on market $130,000 Active 378 DOM
-
2026-06-15days on market $130,000 Active 377 DOM
-
2026-06-13days on market $130,000 Active 375 DOM
-
2026-06-09days on market $130,000 Active 371 DOM
-
2026-06-08days on market $130,000 Active 370 DOM
-
2026-06-07pricedays on market $130,000 Active 369 DOM
-
2026-06-04days on market $140,000 Active 366 DOM
-
2026-06-03days on market $140,000 Active 365 DOM
-
2026-06-02days on market $140,000 Active 364 DOM
-
2026-06-01days on market $140,000 Active 363 DOM
-
2026-05-31days on market $140,000 Active 362 DOM
-
2026-05-08price $140,000
-
2026-01-01price $150,000
-
2025-11-22price $165,000
-
2025-11-03price $175,000
-
2025-08-05price $185,000
-
2025-06-03$200,000 Active
-
2021-11-05soldstatus $178,500 Closed
-
2021-10-02status Pending
-
2021-09-20status Active
-
2021-08-05price $178,500
-
2021-07-14$189,500 Active
-
2013-10-07soldstatus $79,500 Sold
-
2013-09-14status Pending Inspection
-
2013-09-05$79,500 Active
-
2012-09-21historical
-
2012-09-21soldstatus $65,000 Sold
-
2012-09-18status Pending
-
2012-09-03price $65,000
-
2012-08-19status Active
-
2012-08-16historical Expired
-
2012-07-27price $75,000
-
2012-02-13price $85,000
-
2012-02-12$84,000 Active
-
2011-09-07historical
-
2011-09-07soldstatus $20,000 Sold
-
2011-09-06status Pending
-
2011-08-26status Pending Inspection
-
2011-08-18$25,000 Active
ⓘ Source: listings_history table (triggers on properties + properties_extension) + one-shot
backfill from property_details.listing_events for pre-trigger history.
Tax reassessment forecast WA · Resets to sale price
- Current annual tax
- $745 · $62/mo
- Projected year-2 tax
- $1,274 · $106/mo
- Expected delta
- +$529/yr (+$44/mo · 71.0%)
ⓘ Screening estimate from a state-policy table — verify with the county assessor before closing.
Nearby sold comps map
Loading sold comps map…
Walkable amenities ~0.75 mi
Loading nearby amenities…
Taxation est. · year 1
- Rental income
- $26,874
- − Mortgage interest
- −$7,282
- − Property taxes
- −$745
- − Insurance
- −$650
- − Repairs & maintenance
- −$2,150
- − Management
- −$2,150
- − Depreciation
- −$3,782
- Taxable income
- $10,115
- Est. tax owed @ 24.0%
- −$2,428
- After-tax cash flow
- $9,227/yr
For passive investors: Depreciation is non-cash, so a rental often shows a tax loss while cash-flowing — sheltering income. Rental losses are passive: they offset passive income freely, and up to $25,000/yr can offset ordinary (W-2) income if you actively participate and your MAGI is under $100k (phasing out to $0 by $150k); unused losses carry forward. On sale, claimed depreciation is recaptured at up to 25%, and gains may owe capital-gains tax (a 1031 exchange can defer both). Figures are a year-1 estimate at your 24.0% rate — not tax advice; consult a CPA.
Schools (NCES district)
- District
- Mukilteo School District
- NCES district ID
- 5305430
- Math proficiency
- 47% ▼ -2.00%
- Reading proficiency
- 59% ▬ 0.00%
- Median HH income
- $60,807
- Composite
- 48.17/100
- National rank
- #4733
- State rank
- #111 of 291 in WA
Livability — Everett
- Score
- 73/100
- State rank
- #199
- US rank
- #5489
Category grades
Schools grade is shown separately in the Schools card above.
Census & demographics
- Census place
- Everett, WA
- County
- Snohomish County · 786,756 people
- City population
- 173,457
- Metro
- Seattle-Tacoma-Bellevue, WA
- Population (ZIP)
- 45,130
- Household income
- $68,513
- Rent vs Own
- Severe rent burden
- 2874.0
Population outlook (Snohomish County) Hauer SSP2
- Today (2025)
- 899,800 people
- By 2030
- 960,975 · +6.8%
- By 2040
- 1,074,447 · +19.4%
- By 2050
- 1,171,954 · +30.2%
- By 2075
- 1,384,849 · +53.9%
- By 2100
- 1,497,296 · +66.4%
Race, ethnicity, and origin ACS 2023
- Neighborhood character
- Highly diverse neighborhood (Simpson 0.71)
- Race & ethnicity
- White 46% Hispanic / Latino 22% Asian 14% Two or more races 11% Black 9% Pacific Islander 2%
- Hispanic origin (detail)
- Mexican 17%
- Common ancestry
- Subsaharan African 4% Italian 2% Portuguese 2%
- Foreign-born
- 31% · Canada, Vietnam, South Korea
- Languages at home
- 58% English-only · Spanish 18% Russian/Polish/Slavic 6% Vietnamese 5%
Political lean MEDSL · Snohomish
- 2024 margin
- D (+19.0) · D 57.8% · R 38.9% · Other 3.3%
- 2008→2024 swing
- +0.1pp no change · 2008: 18.9pp · 2024: 19.0pp
- All cycles
- 2024: D+19.0 2020: D+20.6 2016: D+16.6 2012: D+16.2 2008: D+18.9
Not yet ingested
- Civics
- —
Market trends
- HPI YoY
- ▼ -540.03%
- Current HPI
- 321.7923
- Rent YoY
- ▼ -1.70%
- Metro
- Seattle-Tacoma-Bellevue, WA
- State GDP YoY
- ▲ 4.65%
- F500 in state
- 22
Industry mix (Fortune 500 HQ in WA)
| Industry | F500 HQs | Revenue |
|---|---|---|
| Retail | 2 | $269B |
|
||
| Technology / Retail | 1 | $638B |
|
||
| Technology | 1 | $245B |
|
||
| Telecommunications | 1 | $38B |
|
||
| Food / Beverage | 1 | $36B |
|
||
| Automotive / Trucks | 1 | $34B |
|
||
Price history
+460.0% since first listed28 events — show timeline
- 2026-05-08 Price Changed $140,000 NWMLS as Distributed by MLS Grid
- 2026-01-01 Price Changed $150,000 NWMLS as Distributed by MLS Grid
- 2025-11-22 Price Changed $165,000 NWMLS as Distributed by MLS Grid
- 2025-11-03 Price Changed $175,000 NWMLS as Distributed by MLS Grid
- 2025-08-05 Price Changed $185,000 NWMLS as Distributed by MLS Grid
- 2025-06-03 Listed $200,000 NWMLS as Distributed by MLS Grid
- 2021-11-05 Sold (MLS) $178,500 NWMLS as Distributed by MLS Grid
- 2021-10-02 Pending — NWMLS as Distributed by MLS Grid
- 2021-09-20 Relisted — NWMLS as Distributed by MLS Grid
- 2021-08-05 Price Changed $178,500 NWMLS as Distributed by MLS Grid
- 2021-07-14 Listed $189,500 NWMLS as Distributed by MLS Grid
- 2013-10-07 Sold (MLS) $79,500 NWMLS as Distributed by MLS Grid
- 2013-09-14 Pending — NWMLS as Distributed by MLS Grid
- 2013-09-05 Listed $79,500 NWMLS as Distributed by MLS Grid
- 2012-09-21 Delisted — NWMLS as Distributed by MLS Grid
- 2012-09-21 Sold (MLS) $65,000 NWMLS as Distributed by MLS Grid
- 2012-09-18 Pending — NWMLS as Distributed by MLS Grid
- 2012-09-03 Price Changed $65,000 NWMLS as Distributed by MLS Grid
- 2012-08-19 Relisted — NWMLS as Distributed by MLS Grid
- 2012-08-16 Delisted — NWMLS as Distributed by MLS Grid
- 2012-07-27 Price Changed $75,000 NWMLS as Distributed by MLS Grid
- 2012-02-13 Price Changed $85,000 NWMLS as Distributed by MLS Grid
- 2012-02-12 Listed $84,000 NWMLS as Distributed by MLS Grid
- 2011-09-07 Delisted — NWMLS as Distributed by MLS Grid
- 2011-09-07 Sold (MLS) $20,000 NWMLS as Distributed by MLS Grid
- 2011-09-06 Pending — NWMLS as Distributed by MLS Grid
- 2011-08-26 Pending — NWMLS as Distributed by MLS Grid
- 2011-08-18 Listed $25,000 NWMLS as Distributed by MLS Grid
Property tax history
+1.8%/yrLatest (2026): $745 · -10.3% YoY. Source: county tax records.
Cash-flow waterfall
monthlySold comps — $/sqft
last 12 mo · ≤1 miLoading sold comps…