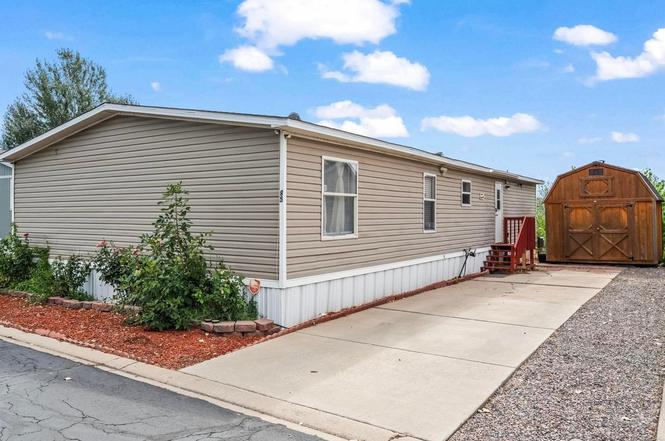
860 W 132nd Ave #85 · Westminster, CO
Flood risk 1/10 · Minimal
- FEMA flood zone
- X (unshaded)
- Chance of flooding over 30 yrs
- 0.0%
- Est. flood insurance / yr
- $507 – $1,088
Fire risk 4/10 · Minor
- Est. fire insurance / yr
- $939 – $1,743
Heat risk 3/10 · Minor
- Hot days now (above 93°F)
- 7 days/yr
- Hot days in 30 yrs
- 18 days/yr
Wind risk 2/10 · Minimal
- Chance of severe wind over 30 yrs
- —
Air-quality risk 4/10 · Minor
- Unhealthy air days now
- 6 days/yr
- Unhealthy air days in 30 yrs
- 8 days/yr
Risk factors via First Street. Map © Google.
Why this score? — see what drove the B- grade
The composite is a weighted blend of 9 inputs, each scored 0–100. Each bar is that input's sub-score; the figure is the points it added to the 100-point composite (weight × sub-score).
- Cash flow +30.0/30.0
- 1% rule +10.0/10.0
- DSCR +10.0/10.0
- ARV discount +7.5/15.0
- Schools +3.5/10.0
- Livability +3.5/5.0
- Condition / age +2.5/5.0
- Rent growth +1.7/5.0
- Appreciation +0.0/10.0
$135,000
🖨 Deal sheet 📄 Offer letter ✓ Due diligence
Listing remarks
Spacious 2014 Home - 1,456 Sq Ft of Modern Comfort!Step into this beautifully maintained and generously sized 3-bedroom, 2-bath of living space! You'll love the open-concept layout, featuring a large kitchen with updated countertops and appliances, plenty of cabinet storage, and a spacious living area perfect for entertaining. Highlights: Fresh modern finishes throughout Oversized primary suite with private bath and walk-in closet Separate laundry room and abundant natural light Central heating and cooling for year-round comfort Backing to peaceful open space. Located in a well-kept community with easy access to shopping, dining, and transit. Whether you're upsizing or looking for a low-mai
Key facts
- Large kitchen
- Updated countertops
- Peaceful open space
Tags
Property features AI
Finance
- HOA & community: No association fees
Exterior
- Parking: No garage; No designated parking features
- Utilities: City water with meter installed; Natural gas available (Xcel); Trash service: Casa Estates
- Home design: Manufactured in park (mobile home)
- Construction: Vinyl siding; Composition roof
- Exterior features: Paved lot; Street lighting; Storage structure; Level lot
Interior
- Kitchen: Gas range; Dishwasher; Refrigerator; Disposal
- Bedrooms: 3 bedrooms
- Bathrooms: 2 full bathrooms
- Heating & cooling: Forced air heating; Central air conditioning
- Interior features: Open floorplan; Walk-in closet(s); Kitchen island; Window coverings; Fire alarm
- Laundry & utility: Washer; Dryer
Neighborhood map
What this means for you Summary
Snapshot
- This is a 3-bed/2.0-bath manufactured listed at $135k.
Deal economics
- At list price, monthly cash flow is $1k ($13k/yr) — positive.
- The deal already cash-flows at list — no discount required.
- Meets the 1% rule at list price ($2k rent vs $135k).
- Recommended offer: $119k (12.0% below list) — sets the bar for market timing.
- Cap rate 15.9% vs local median 2.8% in Westminster — top-decile yield for the area; either an underpriced asset or a hidden risk that comps aren't pricing in. Stress-test before assuming the spread holds.
Location & tenants
- Location reads 70/100 on livability (#81 in CO) — a middle-class / working-renter tenant base. Strengths: employment A+, housing A+; Watch: health & safety D, crime D-, amenities F.
- Adams 12 Five Star Schools (suburban): math 31% / reading 46% proficiency, ranked #26 of 86 in CO (top 30%) — families likely to look elsewhere, expect single-tenant / working-renter base with shorter leases.
- Zoned schools: Centennial Elementary School (math 15% / reading 32%, grade F, #634 of 966 statewide, top 67%, 384 students, 71% FRL); Legacy High School (math 59% / reading 73%, grade B, #30 of 381 statewide, top 8%, 2,230 students, 22% FRL).
- Market conditions: Rents falling (-3.0%/yr); 142 active listings in the ZIP; 18 comparable units currently listed for rent nearby; rentals at typical pace (median 17d on market — plan ~3-4 weeks tenant-placement turnaround); solid renter incomes; 2,299 units permitted in Adams County in 2024 (343 in 5+ unit buildings).
- This rent runs 31% of the median local income ($93k/yr) — at the standard rent-burdened threshold; future hikes will face affordability resistance.
Forward outlook
- Local home prices are declining (-3.0%/yr); year-one equity from $933 of loan paydown is wiped out by about $4k of value loss. Plan a longer hold.
- Adams County population projected at +44% by 2050 — long-run rental-demand tailwind backs the buy-and-hold thesis.
- At projected returns (-3.0% appreciation + 0.0% rent growth), your $38k cash investment doubles in ~4 years — after that, you're playing with house money.
Negotiation context
- It's been on market 243 days — a 12% lower offer ($119k) is reasonable based on typical stale-listing flexibility.
- 5 sale attempts since 3y ago with the ask held roughly flat each time — persistent listings suggest the price (not the market) is what's stuck; bring a comps-based counter.
Questions for the listing agent
- It's been on market 243 days. Have you received any prior offers? Is the seller open to a 12% concession, seller financing, or rate buy-down credit?
- Why hasn't it sold? Are there any deal-killer items the seller is aware of (foundation, flood, title, zoning, code violations)?
- Is there a deadline driving the sale (1031 exchange, divorce, estate, relocation)? That informs how much negotiation room exists.
- Crime grade is D in this area — have there been break-ins, vandalism, or insurance claims at this property in the last 3 years? What carrier currently insures it and at what premium?
- What's the average days-on-market for RENTAL listings here right now (not sales)? A rising rental-DOM trend means longer vacancies and softer asking-rent achievability than the comps imply.
- What's the recent tenant-quality profile in this submarket — average credit score on applications, eviction rate, late-payment / NSF rate, and stable-employment percentage? A property-management company in the area should have these aggregated.
- How much new for-sale + rental construction is in the pipeline within 1–3 miles? Heavy new supply typically softens prices + rents 12–24 months out; constrained supply supports both.
Investment metrics
- 1% rule
- 1.78% ✓
- Cap rate
- 15.90%
- Cash-on-cash
- 34.31%
- DSCR
- 2.53
- GRM
- 4.7
CMA / ARV
- ARV (on-the-fly)
- $59,696
- Comps found
- 1
Show comp detail 1 sale within ~0.75 mi
| Address | Dist | Beds/Ba | Sqft | Sold | Price | $/sf | Match |
|---|---|---|---|---|---|---|---|
| 860 W 132nd Ave #195 | 0.00mi | 3/2.0 | 1,344 (-8%) | 11mo | $55,000 | $41 | 78 |
Match score weights: distance 35% · size 25% · config 20% · recency 20%. Top-matched comps best support the ARV.
Projected returns pro-forma
-3.0% appreciation · 0.0% rent growth · sell at horizon
- IRR
- 26.4%
- Equity multiple
- 2.05×
- Total profit
- $39,869
- Equity at exit
- $20,129
- IRR
- 32.3%
- Equity multiple
- 3.54×
- Total profit
- $95,951
- Equity at exit
- $11,672
Cash invested: $37,800 (down + closing). Projections, not guarantees.
Landlord ↔ Tenant lean methodology
- Overall (STATE)
- 38 Tenant-Leaning
- State Colorado
- 38 Tenant-Leaning · D+4
- County
- — inherits STATE
- City
- — inherits STATE
ZIP-level market 80234
- Rents YoY
- -3.0%
- Active inventory
- 142
- Price-to-rent
- 4.7×
Monthly cashflow live
- Estimated rent
- $2,408 high interval (Pro) →
- Mortgage (P&I)
- −$708
- Tax from tax record
- −$57 /mo · $685/yr
- Insurance
- −$56
- HOA
- −$0
- Vacancy / Maint / Mgmt
- −$506
- Net cashflow
- $1,081
Break-even live
UW: 25.0% down · 7.5% · 30yr · 1.5% tax · 5.0% vac · 8.0% maint · 8.0% mgmt
Financing live
Cash to close
- Down payment
- $33,750
- Closing costs
- $4,050
- Reserves months
- —
- Total cash needed
- —
Loan-product check · same deal, 3 products live
Conventional
25% down · 7.5% · 30yr
- Down + closing
- —
- Monthly P&I
- —
- Monthly cashflow
- —
- DSCR
- —
- Eligible?
- —
Personal DTI + credit; lowest rate.
DSCR
20% down · 8.5% · 30yr
- Down + closing
- —
- Monthly P&I
- —
- Monthly cashflow
- —
- DSCR
- —
- Eligible?
- —
No personal income docs; deal must DSCR.
Hard money
10% down · 12.0% · 12mo
- Down + closing
- —
- Monthly P&I
- —
- Monthly cashflow
- —
- DSCR
- —
- Eligible?
- —
Short-term bridge; refi at stabilization.
Rent comps 18 comps
| Address | Beds | Baths | Sqft | Rent | $/sqft | DOM | Units | Dist |
|---|---|---|---|---|---|---|---|---|
| 1331 W 132nd Pl Denver, CO | 3.0 | 2.0 | 1351 | $2,575 | $1.91 | 11d | 1 | 0.26mi |
| 13140 Raritan Ct Denver, CO | 3.0 | 2.5 | 1682 | $2,765 | $1.64 | 11d | 1 | 0.34mi |
| 13131 Raritan Ct Denver, CO | 4.0 | 3.0 | 1688 | $3,130 | $1.85 | 24d | 1 | 0.35mi |
| 2885 E Midway Blvd Unit PWS FR 1505 Broomfield, CO | 3.0 | 2.0 | 1024 | $2,238 | $2.19 | 24d | 1 | 0.80mi |
| 12621 Zuni St Broomfield, CO | 1.0–3.0 | 1.0–2.0 | 1053 | $2,701 | $2.56 | 2d | 15 | 0.82mi |
| 2885 E Midway Blvd #1505 Denver, CO | 3.0 | 2.0 | 1024 | $2,238 | $2.19 | 16d | 1 | 0.98mi |
| 2885 E Midway Blvd #422 Denver, CO | 3.0 | 2.0 | 1152 | $2,258 | $1.96 | 24d | 1 | 0.98mi |
| 581 W 123rd Ave Westminster, CO | 1.0–2.0 | 1.0–2.0 | 962 | $2,294 | $2.38 | 2d | 24 | 1.07mi |
| 400 W 123rd Ave Denver, CO | 1.0–2.0 | 1.0–2.0 | 818 | $1,969 | $2.41 | 2d | 35 | 1.15mi |
| 2311 Park Centre Dr Westminster, CO | 1.0–3.0 | 1.0–2.0 | 1095 | $2,347 | $2.14 | 2d | 28 | 1.17mi |
| 13900 Lake Song Ln Broomfield, CO | 2.0 | 2.5 | 1800 | $2,400 | $1.33 | 13d | 1 | 1.18mi |
| 13900 Lake Song Ln Unit L3 Broomfield, CO | 2.0 | 1.5 | 1129 | $2,550 | $2.26 | 24d | 1 | 1.18mi |
| 12141 Melody Dr Westminster, CO | 2.0 | 1.0 | 945 | $1,740 | $1.84 | 24d | 1 | 1.21mi |
| 12133 Melody Dr #303 Denver, CO | 2.0 | 1.0 | 900 | $1,475 | $1.64 | 24d | 1 | 1.22mi |
| 12103 N Melody Dr Unit 16-304 Westminster, CO | 2.0 | 1.0 | 900 | $1,400 | $1.56 | 24d | 1 | 1.26mi |
| 12141 Bannock St Westminster, CO | 2.0 | 1.0 | 1107 | $1,900 | $1.72 | 3d | 1 | 1.33mi |
| 12929 Washington St Thornton, CO | 3.0 | 1.0–2.0 | 1025 | $2,833 | $2.76 | 3d | 26 | 1.33mi |
| 12232 Bannock Cir Unit D Denver, CO | 3.0 | 2.0 | 1460 | $2,145 | $1.47 | 24d | 1 | 1.38mi |
Listing history 24 events
-
2026-06-18days on market $135,000 Active 243 DOM
-
2026-06-17days on market $135,000 Active 242 DOM
-
2026-06-16days on market $135,000 Active 241 DOM
-
2026-06-15days on market $135,000 Active 240 DOM
-
2026-06-13days on market $135,000 Active 238 DOM
-
2026-06-13days on market $135,000 Active 237 DOM
-
2026-06-09days on market $135,000 Active 234 DOM
-
2026-06-08days on market $135,000 Active 233 DOM
-
2026-06-07days on market $135,000 Active 232 DOM
-
2026-06-04days on market $135,000 Active 229 DOM
-
2026-06-03days on market $135,000 Active 228 DOM
-
2026-06-02days on market $135,000 Active 227 DOM
-
2026-06-01days on market $135,000 Active 226 DOM
-
2026-05-31days on market $135,000 Active 225 DOM
-
2026-03-05status Active
-
2026-02-28historical
-
2025-10-13$135,000 Active
-
2025-10-08historical
-
2025-09-01price $135,000
-
2025-07-31$139,000 Active
-
2023-09-21historical
-
2023-09-21historical
-
2023-08-07$100,000 Active
-
2023-08-07$100,000 Active
ⓘ Source: listings_history table (triggers on properties + properties_extension) + one-shot
backfill from property_details.listing_events for pre-trigger history.
Tax reassessment forecast CO · Resets to sale price
- Current annual tax
- $685 · $57/mo
- Projected year-2 tax
- $742 · $62/mo
- Expected delta
- +$57/yr (+$5/mo · 8.4%)
ⓘ Screening estimate from a state-policy table — verify with the county assessor before closing.
Climate risk First Street
- Flood 1/10 Low FEMA zone X (unshaded) · 0% chance over 30 yrs
- Wildfire 4/10 Moderate
- Heat 3/10 Moderate 7 d/yr ≥93°F today · 18 d/yr by 30 yrs out
- Wind 2/10 Low
- Air quality 4/10 Moderate 6 unhealthy d/yr today · 8 by 30 yrs out
Nearby sold comps map
Loading sold comps map…
Walkable amenities ~0.75 mi
Loading nearby amenities…
Taxation est. · year 1
- Rental income
- $28,892
- − Mortgage interest
- −$7,562
- − Property taxes
- −$685
- − Insurance
- −$675
- − Repairs & maintenance
- −$2,311
- − Management
- −$2,311
- − Depreciation
- −$3,927
- Taxable income
- $11,419
- Est. tax owed @ 24.0%
- −$2,741
- After-tax cash flow
- $10,228/yr
For passive investors: Depreciation is non-cash, so a rental often shows a tax loss while cash-flowing — sheltering income. Rental losses are passive: they offset passive income freely, and up to $25,000/yr can offset ordinary (W-2) income if you actively participate and your MAGI is under $100k (phasing out to $0 by $150k); unused losses carry forward. On sale, claimed depreciation is recaptured at up to 25%, and gains may owe capital-gains tax (a 1031 exchange can defer both). Figures are a year-1 estimate at your 24.0% rate — not tax advice; consult a CPA.
Schools (NCES district)
- District
- Adams 12 Five Star Schools
- NCES district ID
- 0806900
- Math proficiency
- 31% ▼ -4.00%
- Reading proficiency
- 46% ▬ 0.00%
- Median HH income
- $67,478
- Composite
- 34.87/100
- National rank
- #5086
- State rank
- #26 of 86 in CO
Livability — Westminster
- Score
- 70/100
- State rank
- #81
- US rank
- #7330
Category grades
Schools grade is shown separately in the Schools card above.
Census & demographics
- Census place
- Westminster, CO
- County
- Adams County · 464,133 people
- City population
- 152,898
- Metro
- Denver-Aurora-Lakewood, CO
- Population (ZIP)
- 29,356
- Household income
- $92,563
- Rent vs Own
- Severe rent burden
- 1240.0
Population outlook (Adams County) Hauer SSP2
- Today (2025)
- 598,184 people
- By 2030
- 651,880 · +9.0%
- By 2040
- 759,778 · +27.0%
- By 2050
- 862,889 · +44.3%
- By 2075
- 1,085,994 · +81.5%
- By 2100
- 1,211,318 · +102.5%
Race, ethnicity, and origin ACS 2023
- Neighborhood character
- Diverse neighborhood (Simpson 0.55)
- Race & ethnicity
- White 61% Hispanic / Latino 26% Two or more races 14% Asian 6% Native American 1% Black 1%
- Hispanic origin (detail)
- Mexican 19%
- Common ancestry
- Romanian 3% Italian 3% Slovak 3%
- Foreign-born
- 9% · Canada, Vietnam, South Korea
- Languages at home
- 83% English-only · Spanish 10% Vietnamese 2% Other Asian/Pacific 1%
Political lean MEDSL · Adams
- 2024 margin
- Lean D (+9.0) · D 53.2% · R 44.1% · Other 2.7%
- 2008→2024 swing
- -9.3pp toward R · 2008: 18.4pp · 2024: 9.0pp
- All cycles
- 2024: D+9.0 2020: D+16.3 2016: D+7.2 2012: D+15.1 2008: D+18.4
Not yet ingested
- Civics
- —
Market trends
- HPI YoY
- ▼ -220.65%
- Current HPI
- 238.0118
- Rent YoY
- ▼ -3.05%
- Metro
- Denver-Aurora-Lakewood, CO
- State GDP YoY
- ▲ 1.95%
- F500 in state
- 14
Industry mix (Fortune 500 HQ in CO)
| Industry | F500 HQs | Revenue |
|---|---|---|
| Technology Distribution | 1 | $31B |
|
||
| Food / Agriculture | 1 | $18B |
|
||
| Packaging | 1 | $14B |
|
||
| Healthcare | 1 | $13B |
|
||
| Energy | 1 | $10B |
|
||
| Technology | 1 | $4B |
|
||
Price history
+35.0% since first listed10 events — show timeline
- 2026-03-05 Relisted — IRES
- 2026-02-28 Listing Removed — IRES
- 2025-10-13 Listed $135,000 IRES
- 2025-10-08 Listing Removed — IRES
- 2025-09-01 Price Changed $135,000 IRES
- 2025-07-31 Listed $139,000 IRES
- 2023-09-21 Listing Removed — REColorado as Distributed by MLS Grid
- 2023-09-21 Listing Removed — IRES
- 2023-08-07 Listed $100,000 REColorado as Distributed by MLS Grid
- 2023-08-07 Listed $100,000 IRES
Property tax history
+13.7%/yrLatest (2025): $685 · +310.4% YoY. Source: county tax records.
Cash-flow waterfall
monthlySold comps — $/sqft
last 12 mo · ≤1 miLoading sold comps…