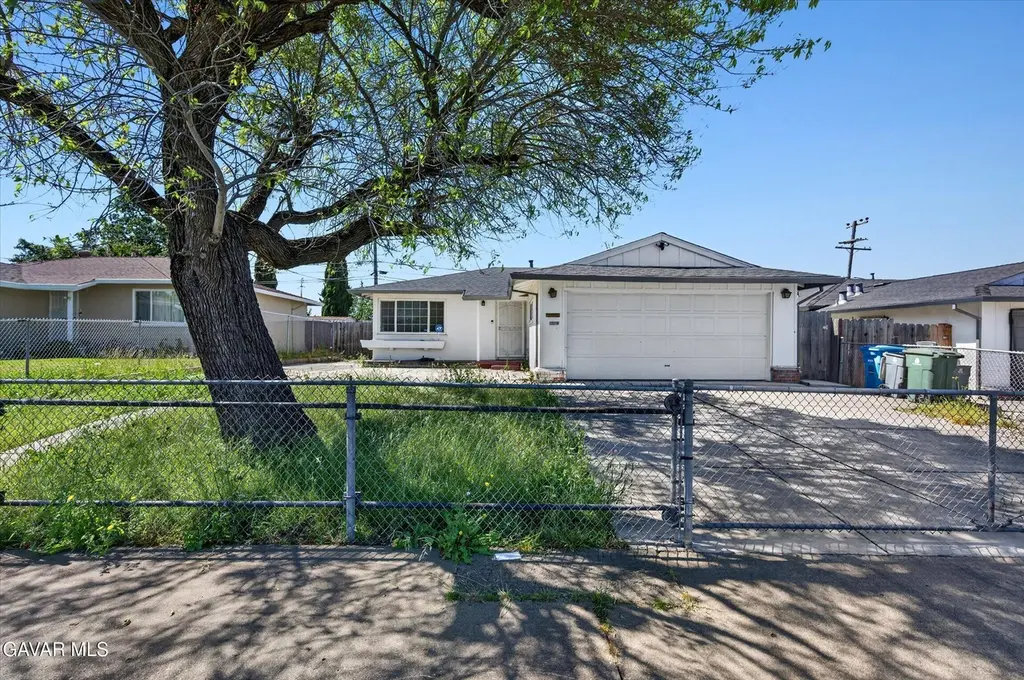
1213 Griffin Dr · Vallejo, CA
Flood risk 6/10 · Moderate
- FEMA flood zone
- X (unshaded)
- Chance of flooding over 30 yrs
- 0.68%
- Est. flood insurance / yr
- $507 – $1,088
Fire risk 6/10 · Moderate
- Est. fire insurance / yr
- $659 – $1,223
Heat risk 5/10 · Moderate
- Hot days now (above 93°F)
- 7 days/yr
- Hot days in 30 yrs
- 14 days/yr
Wind risk 1/10 · Minimal
- Chance of severe wind over 30 yrs
- —
Air-quality risk 9/10 · Severe
- Unhealthy air days now
- 16 days/yr
- Unhealthy air days in 30 yrs
- 17 days/yr
Risk factors via First Street. Map © Google.
Why this score? — see what drove the C grade
The composite is a weighted blend of 9 inputs, each scored 0–100. Each bar is that input's sub-score; the figure is the points it added to the 100-point composite (weight × sub-score).
- Cash flow +16.5/30.0
- ARV discount +15.0/15.0
- Appreciation +8.1/10.0
- DSCR +5.1/10.0
- 1% rule +3.6/10.0
- Livability +3.4/5.0
- Schools +2.6/10.0
- Condition / age +2.5/5.0
- Rent growth +2.4/5.0
$399,900
🖨 Deal sheet 📄 Offer letter ✓ Due diligence
Listing remarks
Welcome to 1213 Griffin Drive, a charming home filled with character and original appeal. This property offers a wonderful opportunity to update and personalize while enjoying a functional layout, attached garage, and spacious backyard with plenty of room to relax, entertain, or expand your outdoor vision. The generous driveway may also offer potential space for RV parking or additional vehicles. Conveniently located near shopping, dining, parks, schools, and commuter routes, this home combines classic charm with exciting possibilities for its next owner.
Key facts
- Spacious backyard
- Attached garage
- Generous driveway
Tags
Property features AI
Finance
- Other: No ADU
Exterior
- Parking: 2-car garage
- Utilities: Public water; Sewer connected; Natural gas available; Internet service available; Paved streets
- Home design: Traditional style; 1 story
- Construction: Stucco exterior; Shingle roof; Concrete slab foundation; Built on residential-zoned lot
- Exterior features: Chain link fencing; Front lawn; Rear lawn; RV access possible
Interior
- Kitchen: Gas range; Refrigerator
- Flooring: Carpet; Vinyl/Linoleum
- Bathrooms: 1 full bathroom
- Interior features: Dining area
- Laundry & utility: Laundry area in garage
Neighborhood map
What this means for you Summary
Snapshot
- This is a 3-bed/1.0-bath single-family listed at $400k.
Deal economics
- At list price, monthly cash flow is $235 ($3k/yr) — positive.
- The deal already cash-flows at list — no discount required.
- To meet the 1% rule (rent ≥ 1% of price), the offer needs to be $342k (14.4% below list).
- Recommended offer: $342k (14.4% below list) — sets the bar for 1% rule.
- Cap rate 7.0% vs local median 3.1% in Vallejo — top-decile yield for the area; either an underpriced asset or a hidden risk that comps aren't pricing in. Stress-test before assuming the spread holds.
Location & tenants
- Location reads 67/100 on livability (#304 in CA) — a middle-class / working-renter tenant base. Strengths: commute A+, housing A+, health & safety A+; Watch: schools D-, crime F, cost of living F.
- Vallejo City Unified (urban): math 20% / reading 30% proficiency, ranked #1,124 of 1,400 in CA (top 80%) — low school quality limits family demand, transient renter base, plan for 1-2y turnover; 62% free/reduced lunch — lower-income household profile, screen leases tightly.
- Market conditions: Rents soft (-0.2%/yr); 221 active listings in the ZIP; 16 comparable units currently listed for rent nearby; rentals at typical pace (median 21d on market — plan ~3-4 weeks tenant-placement turnaround); high-income renter base; 1,472 units permitted in Solano County in 2024 (131 in 5+ unit buildings).
Forward outlook
- In year one you build about $28k of equity ($3k loan paydown + $25k appreciation (6.2% local appreciation)).
- Solano County population projected at +15% by 2050 — modest demand growth; plan on rents tracking national, not racing it.
- At projected returns (6.2% appreciation + 0.0% rent growth), your $112k cash investment doubles in ~4 years — after that, you're playing with house money.
- By year 2, paydown + projected appreciation supports a ~$44k cash-out refi (75% LTV) — recoverable capital for the next deal without selling this one.
Negotiation context
- It's been on market 27 days — a 2% lower offer ($394k) is reasonable based on typical stale-listing flexibility.
- Current owner paid $57k; list at $400k implies a 602% gain — meaningful room to come down on a strong offer.
Risks & watch-outs
- Watch-outs: built in 1956 — expect roof / HVAC / electrical / plumbing capex.
- Climate carrying-cost: major flood risk; major wildfire risk; extreme-heat days projected 7→14/yr by 2055 (HVAC capex compounding) — expect insurance premiums to compound above CPI over the hold.
Questions for the listing agent
- Built in 1956 — when were the roof, HVAC, electrical panel, plumbing, and water heater last replaced?
- Is there a deadline driving the sale (1031 exchange, divorce, estate, relocation)? That informs how much negotiation room exists.
- Schools are D-rated, which usually means shorter tenancies and higher turnover. Who's the typical renter profile here, and what's been the actual vacancy rate?
- Crime grade is F in this area — have there been break-ins, vandalism, or insurance claims at this property in the last 3 years? What carrier currently insures it and at what premium?
- What's the average days-on-market for RENTAL listings here right now (not sales)? A rising rental-DOM trend means longer vacancies and softer asking-rent achievability than the comps imply.
- What's the recent tenant-quality profile in this submarket — average credit score on applications, eviction rate, late-payment / NSF rate, and stable-employment percentage? A property-management company in the area should have these aggregated.
- How much new for-sale + rental construction is in the pipeline within 1–3 miles? Heavy new supply typically softens prices + rents 12–24 months out; constrained supply supports both.
Investment metrics
- 1% rule
- 0.86% ✗
- Cap rate
- 7.00%
- Cash-on-cash
- 2.52%
- DSCR
- 1.11
- GRM
- 9.7
CMA / ARV
- ARV (on-the-fly)
- $516,792
- Comps found
- 12
Show comp detail 12 sales within ~0.75 mi
| Address | Dist | Beds/Ba | Sqft | Sold | Price | $/sf | Match |
|---|---|---|---|---|---|---|---|
| 121 Exposition Dr | 0.18mi | 3/2.0 | 1,292 (-12%) | 7mo | $475,000 | $368 | 62 |
| 163 Kemper St | 0.43mi | 4/2.0 (+1) | 1,440 (-2%) | 10mo | $470,000 | $326 | 60 |
| 204 Haviture Way | 0.43mi | 3/2.5 | 1,509 (+3%) | 14mo | $565,000 | $374 | 57 |
| 221 Mark Ave | 0.48mi | 3/2.0 | 1,530 (+4%) | 14mo | $397,000 | $259 | 54 |
| 245 Pumice Ct | 0.54mi | 4/2.0 (+1) | 1,529 (+4%) | 7mo | $540,000 | $353 | 53 |
| 256 Exposition Dr | 0.32mi | 3/2.0 | 1,310 (-10%) | 14mo | $545,000 | $416 | 52 |
| 448 Mcgrue Cir | 0.66mi | 3/2.5 | 1,498 (+2%) | 12mo | $556,000 | $371 | 50 |
| 436 Mcgrue Cir | 0.68mi | 3/2.5 | 1,498 (+2%) | 13mo | $570,000 | $381 | 48 |
| 138 Nicole Way | 0.43mi | 3/2.5 | 1,614 (+10%) | 11mo | $565,000 | $350 | 48 |
| 238 Genoa Ct | 0.50mi | 3/2.5 | 1,614 (+10%) | 12mo | $547,000 | $339 | 44 |
| 415 Taper Ave | 0.56mi | 3/2.0 | 1,618 (+10%) | 14mo | $524,500 | $324 | 41 |
| 236 Evelyn Cir | 0.71mi | 3/2.0 | 1,304 (-11%) | 11mo | $460,000 | $353 | 36 |
Match score weights: distance 35% · size 25% · config 20% · recency 20%. Top-matched comps best support the ARV.
Projected returns pro-forma
6.19% appreciation · 0.0% rent growth · sell at horizon
- IRR
- 16.7%
- Equity multiple
- 2.11×
- Total profit
- $124,830
- Equity at exit
- $256,239
- IRR
- 15.6%
- Equity multiple
- 4.00×
- Total profit
- $336,047
- Equity at exit
- $468,918
Cash invested: $111,972 (down + closing). Projections, not guarantees.
Landlord ↔ Tenant lean methodology
- Overall (STATE)
- 18 Strongly Tenant-Friendly
- State California
- 18 Strongly Tenant-Friendly · D+13
- County
- — inherits STATE
- City
- — inherits STATE
ZIP-level market 92651
- Home prices YoY
- 1.6%
- Rents YoY
- -0.2%
- Active inventory
- 221
- Price-to-rent
- 9.7×
Monthly cashflow live
- Estimated rent
- $3,422 high interval (Pro) →
- Mortgage (P&I)
- −$2,097
- Tax from tax record
- −$204 /mo · $2,450/yr
- Insurance
- −$167
- HOA
- −$0
- Vacancy / Maint / Mgmt
- −$719
- Net cashflow
- $235
Break-even live
UW: 25.0% down · 7.5% · 30yr · 1.5% tax · 5.0% vac · 8.0% maint · 8.0% mgmt
Financing live
Cash to close
- Down payment
- $99,975
- Closing costs
- $11,997
- Reserves months
- —
- Total cash needed
- —
Loan-product check · same deal, 3 products live
Conventional
25% down · 7.5% · 30yr
- Down + closing
- —
- Monthly P&I
- —
- Monthly cashflow
- —
- DSCR
- —
- Eligible?
- —
Personal DTI + credit; lowest rate.
DSCR
20% down · 8.5% · 30yr
- Down + closing
- —
- Monthly P&I
- —
- Monthly cashflow
- —
- DSCR
- —
- Eligible?
- —
No personal income docs; deal must DSCR.
Hard money
10% down · 12.0% · 12mo
- Down + closing
- —
- Monthly P&I
- —
- Monthly cashflow
- —
- DSCR
- —
- Eligible?
- —
Short-term bridge; refi at stabilization.
Rent comps 16 comps
| Address | Beds | Baths | Sqft | Rent | $/sqft | DOM | Units | Dist |
|---|---|---|---|---|---|---|---|---|
| 771 Quartz Ln Vallejo, CA | 3.0 | 2.0 | 1176 | $2,900 | $2.47 | 43d | 1 | 0.55mi |
| 125 Serpentine Dr Vallejo, CA | 4.0 | 2.5 | 1256 | $2,999 | $2.39 | 23d | 1 | 0.81mi |
| 1457 N Camino Alto Vallejo, CA | 2.0 | 2.0 | 1000 | $2,200 | $2.20 | 43d | 1 | 0.99mi |
| 355 Parkview Ter Apt H5 Vallejo, CA | 2.0 | 1.0 | 918 | $1,800 | $1.96 | 21d | 1 | 0.99mi |
| 137 Chapman Ct Vallejo, CA | 4.0 | 2.0 | 1304 | $2,900 | $2.22 | 43d | 1 | 1.02mi |
| 1240 Sonata Dr Vallejo, CA | 2.0 | 2.0 | 1238 | $2,400 | $1.94 | 43d | 1 | 1.19mi |
| 1114 Sonata Dr Vallejo, CA | 2.0 | 2.0 | 1120 | $2,850 | $2.54 | 13d | 1 | 1.20mi |
| 165 Oddstad Dr #2 Vallejo, CA | 2.0 | 1.5 | 1180 | $2,300 | $1.95 | 13d | 1 | 1.21mi |
| 165 Oddstad Dr Vallejo, CA | 2.0 | 1.5 | 1140 | $2,280 | $2.00 | 13d | 2 | 1.26mi |
| 19 Panorama Dr Vallejo, CA | 2.0 | 1.0 | 862 | $2,045 | $2.37 | 13d | 7 | 1.30mi |
| 2525 Flosden Rd #16 American Canyon, CA | 3.0 | 2.0 | 1244 | $2,795 | $2.25 | 13d | 1 | 1.33mi |
| 24 Panorama Dr Apt B Vallejo, CA | 2.0 | 1.0 | 980 | $1,900 | $1.94 | 43d | 1 | 1.35mi |
| 424 Corcoran Ave Vallejo, CA | 2.0 | 1.0 | 1200 | $2,300 | $1.92 | 13d | 1 | 1.37mi |
| 1101 N Camino Alto Vallejo, CA | 1.0–2.0 | 1.0–2.0 | 910 | $2,469 | $2.71 | 13d | 8 | 1.40mi |
| 2230 Redwood St Vallejo, CA | 3.0 | 2.0 | 1365 | $2,850 | $2.09 | 23d | 1 | 1.45mi |
| 325 Falcon Dr Vallejo, CA | 3.0 | 2.0 | 1600 | $2,900 | $1.81 | 13d | 1 | 1.49mi |
Listing history 16 events
-
2026-06-18price $399,900 Active 27 DOM
-
2026-06-18days on market $425,000 Active 27 DOM
-
2026-06-17days on market $425,000 Active 26 DOM
-
2026-06-16days on market $425,000 Active 25 DOM
-
2026-06-15days on market $425,000 Active 24 DOM
-
2026-06-14days on market $425,000 Active 22 DOM
-
2026-06-10days on market $425,000 Active 19 DOM
-
2026-06-09days on market $425,000 Active 18 DOM
-
2026-06-08days on market $425,000 Active 17 DOM
-
2026-06-07days on market $425,000 Active 16 DOM
-
2026-06-05days on market $425,000 Active 13 DOM
-
2026-06-03days on market $425,000 Active 12 DOM
-
2026-06-02days on market $425,000 Active 11 DOM
-
2026-06-01days on market $425,000 Active 10 DOM
-
2026-05-31days on market $425,000 Active 9 DOM
-
2026-05-30days on market $425,000 Active 8 DOM
ⓘ Source: listings_history table (triggers on properties + properties_extension) + one-shot
backfill from property_details.listing_events for pre-trigger history.
Tax reassessment forecast CA · Resets to sale price
- Current annual tax
- $2,450 · $204/mo
- Projected year-2 tax
- $3,039 · $253/mo
- Expected delta
- +$589/yr (+$49/mo · 24.1%)
ⓘ Screening estimate from a state-policy table — verify with the county assessor before closing.
Climate risk First Street
- Flood 6/10 Major FEMA zone X (unshaded) · 68% chance over 30 yrs
- Wildfire 6/10 Major
- Heat 5/10 Major 7 d/yr ≥93°F today · 14 d/yr by 30 yrs out
- Wind 1/10 Low
- Air quality 9/10 Extreme 16 unhealthy d/yr today · 17 by 30 yrs out
Nearby sold comps map
Loading sold comps map…
Walkable amenities ~0.75 mi
Loading nearby amenities…
Taxation est. · year 1
- Rental income
- $41,058
- − Mortgage interest
- −$22,401
- − Property taxes
- −$2,450
- − Insurance
- −$2,000
- − Repairs & maintenance
- −$3,285
- − Management
- −$3,285
- − Depreciation
- −$11,633
- Taxable loss
- −$3,995
- Est. tax savings @ 24.0%
- +$959
- After-tax cash flow
- $3,780/yr
For passive investors: Depreciation is non-cash, so a rental often shows a tax loss while cash-flowing — sheltering income. Rental losses are passive: they offset passive income freely, and up to $25,000/yr can offset ordinary (W-2) income if you actively participate and your MAGI is under $100k (phasing out to $0 by $150k); unused losses carry forward. On sale, claimed depreciation is recaptured at up to 25%, and gains may owe capital-gains tax (a 1031 exchange can defer both). Figures are a year-1 estimate at your 24.0% rate — not tax advice; consult a CPA.
Schools (NCES district)
- District
- Vallejo City Unified
- NCES district ID
- 0640740
- Math proficiency
- 20% ▬ 0.00%
- Reading proficiency
- 30% ▬ 0.00%
- Median HH income
- $59,919
- Composite
- 26.02/100
- National rank
- #12743
- State rank
- #1124 of 1400 in CA
Livability — Vallejo
- Score
- 67/100
- State rank
- #304
- US rank
- #10215
Category grades
Schools grade is shown separately in the Schools card above.
Census & demographics
- Census place
- Vallejo, CA
- County
- Orange County · 3,096,323 people
- City population
- 125,311
- Metro
- Los Angeles-Long Beach-Anaheim, CA
- Population (ZIP)
- 23,557
- Household income
- $146,604
- Rent vs Own
- Severe rent burden
- 1265.0
Population outlook (Solano County) Hauer SSP2
- Today (2025)
- 478,685 people
- By 2030
- 497,974 · +4.0%
- By 2040
- 528,515 · +10.4%
- By 2050
- 549,115 · +14.7%
- By 2075
- 587,229 · +22.7%
- By 2100
- 571,378 · +19.4%
Race, ethnicity, and origin ACS 2023
- Neighborhood character
- Predominantly White (81%)
- Race & ethnicity
- White 81% Hispanic / Latino 9% Two or more races 9% Asian 4%
- Hispanic origin (detail)
- Mexican 6%
- Common ancestry
- Slovak 5% Lithuanian 4% Italian 3%
- Foreign-born
- 11% · Canada, South Korea
- Languages at home
- 86% English-only · Spanish 6% Other Indo-European 3% German/W. Germanic 2%
Political lean MEDSL · Solano
- 2024 margin
- Strong D (+23.0) · D 60.0% · R 37.1% · Other 2.9%
- 2008→2024 swing
- -5.6pp toward R · 2008: 28.6pp · 2024: 23.0pp
- All cycles
- 2024: D+23.0 2020: D+30.3 2016: D+30.5 2012: D+28.1 2008: D+28.6
Not yet ingested
- Civics
- —
Market trends
- HPI YoY
- ▲ 6.19%
- Current HPI
- 397.9008
- Rent YoY
- ▼ -0.21%
- Metro
- Los Angeles-Long Beach-Anaheim, CA
- State GDP YoY
- ▲ 3.21%
- F500 in state
- 116
Industry mix (Fortune 500 HQ in CA)
| Industry | F500 HQs | Revenue |
|---|---|---|
| Technology | 27 | $1,492B |
|
||
| Financial Services | 3 | $174B |
|
||
| Retail | 3 | $44B |
|
||
| Insurance | 3 | $26B |
|
||
| Media / Entertainment | 2 | $115B |
|
||
| Pharmaceuticals / Biotech | 2 | $62B |
|
||
Price history
+645.6% since first listed2 events — show timeline
- 2026-05-22 Listed $425,000 AVMLS
- 1987-06-29 Sold (Public Records) $57,000 Public Records
Property tax history
+6.3%/yrLatest (2025): $2,450 · +7.3% YoY. Source: county tax records.
Cash-flow waterfall
monthlySold comps — $/sqft
last 12 mo · ≤1 miLoading sold comps…