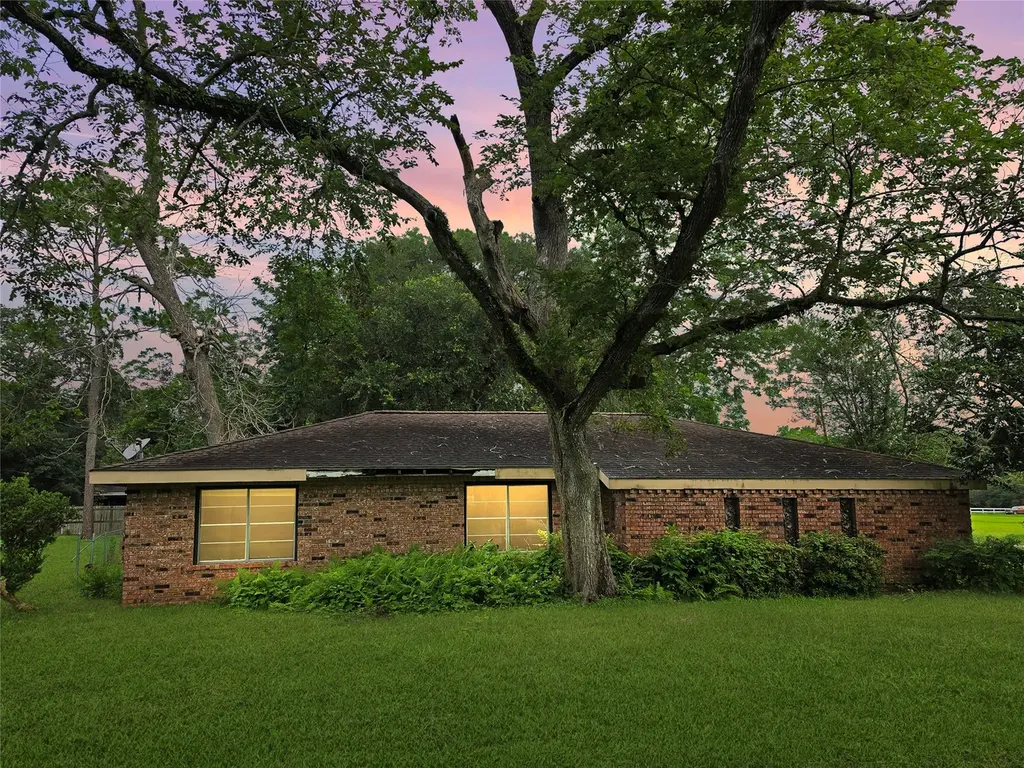
803 Avenue C · Sweeny, TX
Flood risk 4/10 · Minor
- FEMA flood zone
- X (unshaded)
- Chance of flooding over 30 yrs
- 0.22%
- Est. flood insurance / yr
- $507 – $1,088
Fire risk 4/10 · Minor
- Est. fire insurance / yr
- $1,222 – $2,270
Heat risk 10/10 · Severe
- Hot days now (above 110°F)
- 7 days/yr
- Hot days in 30 yrs
- 24 days/yr
Wind risk 9/10 · Severe
- Chance of severe wind over 30 yrs
- 99.0%
Air-quality risk 2/10 · Minimal
- Unhealthy air days now
- 1 days/yr
- Unhealthy air days in 30 yrs
- 2 days/yr
Risk factors via First Street. Map © Google.
Why this score? — see what drove the B+ grade
The composite is a weighted blend of 9 inputs, each scored 0–100. Each bar is that input's sub-score; the figure is the points it added to the 100-point composite (weight × sub-score).
- Cash flow +24.1/30.0
- ARV discount +15.0/15.0
- Appreciation +10.0/10.0
- DSCR +7.8/10.0
- 1% rule +7.5/10.0
- Livability +3.6/5.0
- Schools +3.1/10.0
- Rent growth +2.5/5.0
- Condition / age +2.5/5.0
$149,900
🖨 Deal sheet 📄 Offer letter ✓ Due diligence
Listing remarks
Welcome to 803 Ave C, a 3-bedroom, 2-bath home that blends comfort and functionality at every turn. Step inside to an open kitchen layout with ample cabinet and pantry space — perfect for cooking, hosting, and everyday living. The oversized primary bedroom is a true retreat, complete with a private sitting room ideal for a home office, reading nook, or quiet escape. Out back, the large garage offers serious versatility, easily converting into a workshop for hobbies, projects, or extra storage. With room to spread out inside and out, this one checks all the boxes. Schedule your private showing today!
Key facts
- Private sitting room
- Large garage
- Ample cabinet space
Tags
Property features AI
Finance
- Financial info: Lease not considered
Exterior
- Parking: No designated parking listed
- Utilities: Public water; Public sewer
- Home design: Residential property; Built in 1965; Slab foundation
- Construction: Brick construction; Composition roof
- Exterior features: Located in a subdivision; Lot size about 0.32 acre
Interior
- Bedrooms: Primary bedroom on the first floor (approx. 26'10" x 12'0"); Bedroom on the first floor (approx. 14'0" x 19'8"); Bedroom on the first floor (approx. 11'11" x 12'8")
- Bathrooms: 2 full bathrooms
- Heating & cooling: Central heating (gas); Central electric air conditioning
- Interior features: One fireplace; Total of 3 rooms
Neighborhood map
What this means for you Summary
Snapshot
- This is a 3-bed/2.0-bath single-family listed at $150k.
Deal economics
- At list price, monthly cash flow is $297 ($4k/yr) — positive.
- The deal already cash-flows at list — no discount required.
- Meets the 1% rule at list price ($2k rent vs $150k).
- Cap rate 8.7% vs local median 3.7% in Sweeny — top-decile yield for the area; either an underpriced asset or a hidden risk that comps aren't pricing in. Stress-test before assuming the spread holds.
Location & tenants
- Location reads 71/100 on livability (#306 in TX) — a middle-class / working-renter tenant base. Strengths: cost of living A+, housing A+, crime A; Watch: amenities F, commute F.
- Sweeny ISD (town): math 32% / reading 40% proficiency, ranked #480 of 826 in TX (top 58%) — families likely to look elsewhere, expect single-tenant / working-renter base with shorter leases.
- Zoned schools: Sweeny H S (math 37% / reading 47%, grade F, #730 of 1,632 statewide, top 47%, 589 students, 51% FRL) — zoned schools at 51% FRL track the district average.
- Market conditions: 113 active listings in the ZIP; 3 comparable units currently listed for rent nearby; rentals lingering (median 44d on market — plan ~5-8 weeks vacancy on turnover, expect pricing pressure); 67% of comp listings sitting > 30 days — soft ceiling on asking rent; 3,960 units permitted in Brazoria County in 2024 (593 in 5+ unit buildings).
Forward outlook
- In year one you build about $16k of equity ($1k loan paydown + $15k appreciation (10.0% local appreciation)).
- Brazoria County population projected at +44% by 2050 — long-run rental-demand tailwind backs the buy-and-hold thesis.
- At projected returns (10.0% appreciation + 3.0% rent growth), your $42k cash investment doubles in ~3 years — after that, you're playing with house money.
- By year 3, paydown + projected appreciation supports a ~$41k cash-out refi (75% LTV) — recoverable capital for the next deal without selling this one.
Negotiation context
- Only 7 days on market — expect competitive offers; lowballing is unlikely to land.
Risks & watch-outs
- Watch-outs: property tax is 2.7% of price.
- Climate carrying-cost: severe wind risk, 99% chance of damaging wind over 30y; extreme-heat days projected 7→24/yr by 2055 (HVAC capex compounding) — expect insurance premiums to compound above CPI over the hold.
Questions for the listing agent
- Built in 1965 — when were the roof, HVAC, electrical panel, plumbing, and water heater last replaced?
- Property tax is high relative to price — has the assessment been appealed recently, and will the sale trigger a re-assessment?
- Is there a deadline driving the sale (1031 exchange, divorce, estate, relocation)? That informs how much negotiation room exists.
- What's the average days-on-market for RENTAL listings here right now (not sales)? A rising rental-DOM trend means longer vacancies and softer asking-rent achievability than the comps imply.
- What's the recent tenant-quality profile in this submarket — average credit score on applications, eviction rate, late-payment / NSF rate, and stable-employment percentage? A property-management company in the area should have these aggregated.
- How much new for-sale + rental construction is in the pipeline within 1–3 miles? Heavy new supply typically softens prices + rents 12–24 months out; constrained supply supports both.
Investment metrics
- 1% rule
- 1.25% ✓
- Cap rate
- 8.67%
- Cash-on-cash
- 8.51%
- DSCR
- 1.38
- GRM
- 6.7
CMA / ARV
- ARV (on-the-fly)
- $229,620
- Comps found
- 12
Show comp detail 12 sales within ~0.75 mi
| Address | Dist | Beds/Ba | Sqft | Sold | Price | $/sf | Match |
|---|---|---|---|---|---|---|---|
| 501 Avenue B | 0.21mi | 3/2.0 | 1,854 (+4%) | 7mo | $240,000 | $129 | 77 |
| 111 N Holly St | 0.39mi | 4/2.0 (+1) | 1,790 (+1%) | 3mo | $79,900 | $45 | 73 |
| 904 Avenue C | 0.10mi | 3/2.0 | 1,520 (-15%) | 3mo | $224,500 | $148 | 69 |
| 312 N Orange St | 0.45mi | 4/2.5 (+1) | 1,770 (-1%) | 3mo | $199,900 | $113 | 68 |
| 401 S Fig St | 0.14mi | 3/2.0 | 1,592 (-11%) | 10mo | $199,900 | $126 | 68 |
| 1008 Brockman St | 0.42mi | 3/1.5 | 1,858 (+4%) | 6mo | $125,000 | $67 | 66 |
| 206 N Orange St | 0.37mi | 4/2.0 (+1) | 1,900 (+7%) | 4mo | $229,000 | $121 | 63 |
| 703 N Elm St | 0.70mi | 4/2.0 (+1) | 1,764 (-1%) | 2mo | $230,000 | $130 | 59 |
| 902 Brockman St | 0.37mi | 4/2.0 (+1) | 1,608 (-10%) | 4mo | $215,000 | $134 | 58 |
| 1103 E 7th St | 0.68mi | 3/2.0 | 1,667 (-6%) | 12mo | $283,500 | $170 | 48 |
| 304 N Orange St | 0.42mi | 4/2.5 (+1) | 1,549 (-13%) | 6mo | $199,900 | $129 | 47 |
| 310 N Orange St | 0.44mi | 4/2.5 (+1) | 1,549 (-13%) | 7mo | $199,900 | $129 | 45 |
Match score weights: distance 35% · size 25% · config 20% · recency 20%. Top-matched comps best support the ARV.
Projected returns pro-forma
10.0% appreciation · 3.0% rent growth · sell at horizon
- IRR
- 30.5%
- Equity multiple
- 3.40×
- Total profit
- $100,707
- Equity at exit
- $135,042
- IRR
- 26.4%
- Equity multiple
- 7.72×
- Total profit
- $281,902
- Equity at exit
- $291,223
Cash invested: $41,972 (down + closing). Projections, not guarantees.
Landlord ↔ Tenant lean methodology
- Overall (STATE)
- 87 Strongly Landlord-Friendly
- State Texas
- 87 Strongly Landlord-Friendly · R+5
- County
- — inherits STATE
- City
- — inherits STATE
ZIP-level market 77480
- Home prices YoY
- 12.0%
- Active inventory
- 113
- Price-to-rent
- 6.7×
Monthly cashflow live
- Estimated rent
- $1,876 medium interval (Pro) →
- Mortgage (P&I)
- −$786
- Tax from tax record
- −$336 /mo · $4,032/yr
- Insurance
- −$62
- HOA
- −$0
- Vacancy / Maint / Mgmt
- −$394
- Net cashflow
- $297
Break-even live
UW: 25.0% down · 7.5% · 30yr · 1.5% tax · 5.0% vac · 8.0% maint · 8.0% mgmt
Financing live
Cash to close
- Down payment
- $37,475
- Closing costs
- $4,497
- Reserves months
- —
- Total cash needed
- —
Loan-product check · same deal, 3 products live
Conventional
25% down · 7.5% · 30yr
- Down + closing
- —
- Monthly P&I
- —
- Monthly cashflow
- —
- DSCR
- —
- Eligible?
- —
Personal DTI + credit; lowest rate.
DSCR
20% down · 8.5% · 30yr
- Down + closing
- —
- Monthly P&I
- —
- Monthly cashflow
- —
- DSCR
- —
- Eligible?
- —
No personal income docs; deal must DSCR.
Hard money
10% down · 12.0% · 12mo
- Down + closing
- —
- Monthly P&I
- —
- Monthly cashflow
- —
- DSCR
- —
- Eligible?
- —
Short-term bridge; refi at stabilization.
Rent comps 3 comps
| Address | Beds | Baths | Sqft | Rent | $/sqft | DOM | Units | Dist |
|---|---|---|---|---|---|---|---|---|
| 1102 Avenue C Unit C Sweeny, TX | 3.0 | 2.0 | 1691 | $1,700 | $1.01 | 1d | 1 | 0.18mi |
| 303 Yaupon St Sweeny, TX | 3.0 | 2.0 | 1642 | $1,850 | $1.13 | 43d | 1 | 0.30mi |
| 208 Silver Leaf St Sweeny, TX | 3.0 | 2.0 | 1984 | $2,400 | $1.21 | 43d | 1 | 0.47mi |
Listing history 7 events
-
2026-06-19days on market $149,900 Active 7 DOM
-
2026-06-18days on market $149,900 Active 6 DOM
-
2026-06-17days on market $149,900 Active 5 DOM
-
2026-06-16days on market $149,900 Active 4 DOM
-
2026-06-15days on market $149,900 Active 3 DOM
-
2026-06-12remarks 606-char remark
-
2026-06-12$149,900 Active 1 DOM
ⓘ Source: listings_history table (triggers on properties + properties_extension) + one-shot
backfill from property_details.listing_events for pre-trigger history.
Tax reassessment forecast TX · Resets to sale price
- Current annual tax
- $4,032 · $336/mo
- Projected year-2 tax
- $4,032 · $336/mo
- Expected delta
- $0/yr ($0/mo · 0.0%)
ⓘ Screening estimate from a state-policy table — verify with the county assessor before closing.
Climate risk First Street
- Flood 4/10 Moderate FEMA zone X (unshaded) · 22% chance over 30 yrs
- Wildfire 4/10 Moderate
- Heat 10/10 Extreme 7 d/yr ≥110°F today · 24 d/yr by 30 yrs out
- Wind 9/10 Extreme 99% chance of damaging wind over 30 yrs
- Air quality 2/10 Low 1 unhealthy d/yr today · 2 by 30 yrs out
Nearby sold comps map
Loading sold comps map…
Walkable amenities ~0.75 mi
Loading nearby amenities…
Taxation est. · year 1
- Rental income
- $22,512
- − Mortgage interest
- −$8,397
- − Property taxes
- −$4,032
- − Insurance
- −$750
- − Repairs & maintenance
- −$1,801
- − Management
- −$1,801
- − Depreciation
- −$4,361
- Taxable income
- $1,371
- Est. tax owed @ 24.0%
- −$329
- After-tax cash flow
- $3,241/yr
For passive investors: Depreciation is non-cash, so a rental often shows a tax loss while cash-flowing — sheltering income. Rental losses are passive: they offset passive income freely, and up to $25,000/yr can offset ordinary (W-2) income if you actively participate and your MAGI is under $100k (phasing out to $0 by $150k); unused losses carry forward. On sale, claimed depreciation is recaptured at up to 25%, and gains may owe capital-gains tax (a 1031 exchange can defer both). Figures are a year-1 estimate at your 24.0% rate — not tax advice; consult a CPA.
Schools (NCES district)
- District
- Sweeny ISD
- NCES district ID
- 4841970
- Math proficiency
- 32% ▼ -12.00%
- Reading proficiency
- 40% ▼ -1.00%
- Median HH income
- $53,607
- Composite
- 31.49/100
- National rank
- #5975
- State rank
- #480 of 826 in TX
Livability — Sweeny
- Score
- 71/100
- State rank
- #306
- US rank
- #6914
Category grades
Schools grade is shown separately in the Schools card above.
Census & demographics
- Census place
- Sweeny, TX
- Population (ZIP)
- 8,252
Population outlook (Brazoria County) Hauer SSP2
- Today (2025)
- 420,414 people
- By 2030
- 457,585 · +8.8%
- By 2040
- 532,232 · +26.6%
- By 2050
- 605,399 · +44.0%
- By 2075
- 779,358 · +85.4%
- By 2100
- 883,759 · +110.2%
Race, ethnicity, and origin ACS 2023
- Neighborhood character
- Predominantly White (71%)
- Race & ethnicity
- White 71% Hispanic / Latino 17% Black 8% Two or more races 7% Asian 1%
- Hispanic origin (detail)
- Mexican 16%
- Common ancestry
- Italian 3% Slovak 3% Iranian 1%
- Foreign-born
- 4% · Canada, China
- Languages at home
- 90% English-only · Spanish 9% Tagalog/Filipino 1%
Political lean MEDSL · Brazoria
- 2024 margin
- R (+19.7) · D 39.5% · R 59.2% · Other 1.3%
- 2008→2024 swing
- +9.9pp toward D · 2008: -29.6pp · 2024: -19.7pp
- All cycles
- 2024: R+19.7 2020: R+18.2 2016: R+24.6 2012: R+34.2 2008: R+29.6
Not yet ingested
- Civics
- —
Market trends
- HPI YoY
- ▲ 35.27%
- Current HPI
- 328.8657
- Rent YoY
- —
- Metro
- —
- State GDP YoY
- ▲ 3.95%
- F500 in state
- 110
Industry mix (Fortune 500 HQ in TX)
| Industry | F500 HQs | Revenue |
|---|---|---|
| Energy | 16 | $1,198B |
|
||
| Technology | 5 | $198B |
|
||
| Engineering / Construction | 4 | $72B |
|
||
| Energy Services | 3 | $60B |
|
||
| Utilities | 3 | $41B |
|
||
| Healthcare | 2 | $330B |
|
||
Price history
1 event — show timeline
- 2026-06-12 Listed $149,900 HARMLS
Property tax history
+4.0%/yrLatest (2025): $4,032 · +13.4% YoY. Source: county tax records.
Cash-flow waterfall
monthlySold comps — $/sqft
last 12 mo · ≤1 miLoading sold comps…