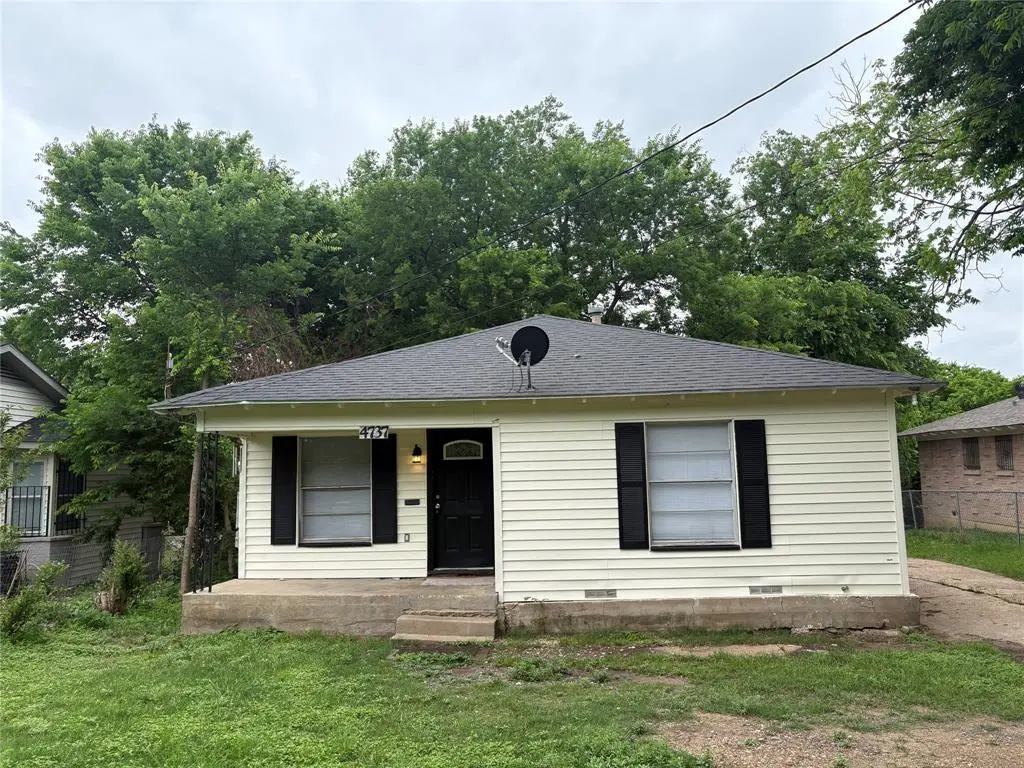
4737 Kildare Ave · Dallas, TX
Flood risk 1/10 · Minimal
- FEMA flood zone
- X (unshaded)
- Chance of flooding over 30 yrs
- 0.0%
- Est. flood insurance / yr
- $507 – $1,088
Fire risk 1/10 · Minimal
- Est. fire insurance / yr
- $1,222 – $2,270
Heat risk 7/10 · Major
- Hot days now (above 110°F)
- 7 days/yr
- Hot days in 30 yrs
- 23 days/yr
Wind risk 6/10 · Moderate
- Chance of severe wind over 30 yrs
- 27.0%
Air-quality risk 2/10 · Minimal
- Unhealthy air days now
- 1 days/yr
- Unhealthy air days in 30 yrs
- 2 days/yr
Risk factors via First Street. Map © Google.
Why this score? — see what drove the B- grade
The composite is a weighted blend of 9 inputs, each scored 0–100. Each bar is that input's sub-score; the figure is the points it added to the 100-point composite (weight × sub-score).
- Cash flow +25.0/30.0
- ARV discount +15.0/15.0
- DSCR +8.1/10.0
- 1% rule +7.8/10.0
- Livability +4.0/5.0
- Rent growth +3.6/5.0
- Schools +2.8/10.0
- Condition / age +2.5/5.0
- Appreciation +0.0/10.0
$129,500
🖨 Deal sheet 📄 Offer letter ✓ Due diligence
Listing remarks
Ideal for investors looking to expand their portfolio or first-time homebuyers seeking a great starter home. This renovated 2-bedroom, 1-bath property features fresh paint and carpet throughout. Kitchen with granite countertops, white cabinetry with chrome handles, detached garage, a spacious backyard, and is full of endless potential. Appliances will be installed prior to closing. Sold as-is, no repairs. Don't miss the opportunity to own a turnkey property just minutes from the heart of downtown Dallas close to dining, entertainment, major highways with easy access to public transportation.
Key facts
- Turnkey property
- Spacious backyard
- Granite countertops
Tags
Property features AI
Finance
- Other: Not in a municipal utility district
- Financial info: Treat as clear loan type; No second mortgage
- HOA & community: No homeowners association
Exterior
- Parking: Driveway; Garage (1-car; approx. 10' x 10'); Carport spaces: 0; Covered spaces: 0
- Utilities: City water; City sewer; Electricity available; Individual gas meter; Individual water meter
- Home design: Single-family residence; Residential property; One story; Preowned home (built 1945); Subdivision: Glendale Acres
- Construction: Siding exterior; Composition roof; Pillar/post/pier foundation; Year built 1945
- Exterior features: Lot approximately 52 x 150 (about 0.176 acres); Concrete, curbs, and sidewalk on property
Interior
- Kitchen: Electric cooktop; Refrigerator
- Bedrooms: Primary bedroom (1st floor) — approximately 12 x 12; Second bedroom (1st floor) — approximately 12 x 10
- Flooring: Carpet
- Bathrooms: One full bathroom (primary bath ~7 x 7)
- Interior features: Decorative lighting; Tile counters; One living area; Five total rooms; One-level layout
Neighborhood map
What this means for you Summary
Snapshot
- This is a 2-bed/1.0-bath single-family listed at $130k.
Deal economics
- At list price, monthly cash flow is $281 ($3k/yr) — positive.
- The deal already cash-flows at list — no discount required.
- Meets the 1% rule at list price ($2k rent vs $130k).
- Recommended offer: $126k (3.0% below list) — sets the bar for market timing.
- Cap rate 8.9% vs local median 2.3% in Dallas — top-decile yield for the area; either an underpriced asset or a hidden risk that comps aren't pricing in. Stress-test before assuming the spread holds.
Location & tenants
- Location reads 81/100 on livability (#24 in TX, #1,380 nationally) — a professional / high-income tenant draw. Strengths: amenities A+, commute A+, housing A+; Watch: crime F.
- Dallas ISD (urban): math 31% / reading 36% proficiency, ranked #559 of 826 in TX (top 68%) — families likely to look elsewhere, expect single-tenant / working-renter base with shorter leases; 83% free/reduced lunch — lower-income household profile, screen leases tightly.
- Zoned schools: H I Holland El At Lisbon (math 22% / reading 22%, grade F, #3,333 of 4,322 statewide, top 80%, 394 students, 98% FRL).
- Market conditions: Rents rising fast (+4.2%/yr); 249 active listings in the ZIP; 13 comparable units currently listed for rent nearby; rentals at typical pace (median 24d on market — plan ~3-4 weeks tenant-placement turnaround); 46% of comp listings sitting > 30 days — soft ceiling on asking rent; lower-income renter base — watch delinquency; 12,577 units permitted in Dallas County in 2024 (6,829 in 5+ unit buildings).
- At $1,659/mo this rent would consume 48% of the median local household income ($41k/yr) (locally 2465% of renters already pay >50% of income on rent) — very limited rent-growth headroom before tenants either downsize or default.
Forward outlook
- Local home prices are declining (-3.0%/yr); year-one equity from $895 of loan paydown is wiped out by about $4k of value loss. Plan a longer hold.
- Dallas County population projected at +35% by 2050 — long-run rental-demand tailwind backs the buy-and-hold thesis.
- At projected returns (-3.0% appreciation + 4.2% rent growth), your $36k cash investment doubles in ~10 years — after that, you're playing with house money.
Negotiation context
- It's been on market 56 days — a 3% lower offer ($126k) is reasonable based on typical stale-listing flexibility.
- 2 sale attempts since 12y ago; this cycle's ask has dropped $10k (7%) from the opening price — seller is motivated, your offer sets the floor, not the list.
Risks & watch-outs
- Watch-outs: property tax is 2.7% of price; built in 1945 — expect roof / HVAC / electrical / plumbing capex.
- Climate carrying-cost: major wind risk, 27% chance of damaging wind over 30y; extreme-heat days projected 7→23/yr by 2055 (HVAC capex compounding) — expect insurance premiums to compound above CPI over the hold.
Questions for the listing agent
- It's been on market 56 days. Have you received any prior offers? Is the seller open to a 3% concession, seller financing, or rate buy-down credit?
- Built in 1945 — when were the roof, HVAC, electrical panel, plumbing, and water heater last replaced?
- Property tax is high relative to price — has the assessment been appealed recently, and will the sale trigger a re-assessment?
- Is there a deadline driving the sale (1031 exchange, divorce, estate, relocation)? That informs how much negotiation room exists.
- Crime grade is F in this area — have there been break-ins, vandalism, or insurance claims at this property in the last 3 years? What carrier currently insures it and at what premium?
- What's the average days-on-market for RENTAL listings here right now (not sales)? A rising rental-DOM trend means longer vacancies and softer asking-rent achievability than the comps imply.
- What's the recent tenant-quality profile in this submarket — average credit score on applications, eviction rate, late-payment / NSF rate, and stable-employment percentage? A property-management company in the area should have these aggregated.
- How much new for-sale + rental construction is in the pipeline within 1–3 miles? Heavy new supply typically softens prices + rents 12–24 months out; constrained supply supports both.
Investment metrics
- 1% rule
- 1.28% ✓
- Cap rate
- 8.90%
- Cash-on-cash
- 9.29%
- DSCR
- 1.41
- GRM
- 6.5
CMA / ARV
- ARV (median comp)
- $165,709
- List price
- $129,500
- Delta
- -21.85%
- Verdict
- UNDERPRICED
- Comps
- 20 within 1.0 mi
Show comp detail 8 sales within ~0.75 mi
| Address | Dist | Beds/Ba | Sqft | Sold | Price | $/sf | Match |
|---|---|---|---|---|---|---|---|
| 1823 Atlas Dr | 0.10mi | 2/1.0 | 868 (+2%) | 5mo | $90,000 | $104 | 87 |
| 4727 S Denley Dr | 0.13mi | 2/2.0 | 816 (-4%) | 8mo | $198,000 | $243 | 77 |
| 4815 Bartlett Ave | 0.09mi | 3/1.0 (+1) | 914 (+8%) | 16mo | $158,000 | $173 | 64 |
| 2023 Custer Dr | 0.70mi | 2/1.0 | 860 (+2%) | 8mo | $145,000 | $169 | 58 |
| 1318 Waweenoc Ave | 0.55mi | 2/1.0 | 789 (-7%) | 8mo | $199,900 | $253 | 56 |
| 1519 Fordham Rd | 0.63mi | 3/2.0 (+1) | 847 (0%) | 22mo | $199,900 | $236 | 43 |
| 4223 Opal Ave | 0.58mi | 3/2.0 (+1) | 889 (+5%) | 20mo | $239,000 | $269 | 39 |
| 1202 Waweenoc Ave | 0.61mi | 3/1.0 (+1) | 960 (+13%) | 11mo | $249,900 | $260 | 35 |
Match score weights: distance 35% · size 25% · config 20% · recency 20%. Top-matched comps best support the ARV.
Projected returns pro-forma
-3.0% appreciation · 4.2% rent growth · sell at horizon
- IRR
- -0.7%
- Equity multiple
- 0.97×
- Total profit
- $-964
- Equity at exit
- $19,309
- IRR
- 10.4%
- Equity multiple
- 1.86×
- Total profit
- $31,151
- Equity at exit
- $11,197
Cash invested: $36,260 (down + closing). Projections, not guarantees.
Landlord ↔ Tenant lean methodology
- Overall (STATE)
- 87 Strongly Landlord-Friendly
- State Texas
- 87 Strongly Landlord-Friendly · R+5
- County
- — inherits STATE
- City
- — inherits STATE
ZIP-level market 75216
- Home prices YoY
- -29.7%
- Rents YoY
- 4.2%
- Active inventory
- 249
- Price-to-rent
- 6.5×
Monthly cashflow live
- Estimated rent
- $1,659 high interval (Pro) →
- Mortgage (P&I)
- −$679
- Tax from tax record
- −$296 /mo · $3,556/yr
- Insurance
- −$54
- HOA
- −$0
- Vacancy / Maint / Mgmt
- −$348
- Net cashflow
- $281
Break-even live
UW: 25.0% down · 7.5% · 30yr · 1.5% tax · 5.0% vac · 8.0% maint · 8.0% mgmt
Financing live
Cash to close
- Down payment
- $32,375
- Closing costs
- $3,885
- Reserves months
- —
- Total cash needed
- —
Loan-product check · same deal, 3 products live
Conventional
25% down · 7.5% · 30yr
- Down + closing
- —
- Monthly P&I
- —
- Monthly cashflow
- —
- DSCR
- —
- Eligible?
- —
Personal DTI + credit; lowest rate.
DSCR
20% down · 8.5% · 30yr
- Down + closing
- —
- Monthly P&I
- —
- Monthly cashflow
- —
- DSCR
- —
- Eligible?
- —
No personal income docs; deal must DSCR.
Hard money
10% down · 12.0% · 12mo
- Down + closing
- —
- Monthly P&I
- —
- Monthly cashflow
- —
- DSCR
- —
- Eligible?
- —
Short-term bridge; refi at stabilization.
Rent comps 13 comps
| Address | Beds | Baths | Sqft | Rent | $/sqft | DOM | Units | Dist |
|---|---|---|---|---|---|---|---|---|
| 4934 Kildare Ave Dallas, TX | 3.0 | 2.0 | 1118 | $1,595 | $1.43 | 24d | 1 | 0.23mi |
| 4417 S Lancaster Rd Dallas, TX | 2.0 | 1.0–2.0 | 874 | $1,595 | $1.82 | 2d | 1 | 0.35mi |
| 1214 Adelaide Dr Dallas, TX | 3.0 | 1.0 | 1040 | $2,350 | $2.26 | 7d | 1 | 0.70mi |
| 1435 Whispering Trl Dallas, TX | 3.0 | 1.0 | 1047 | $1,660 | $1.59 | 7d | 1 | 0.89mi |
| 1618 Marfa Ave Dallas, TX | 3.0 | 2.0 | 1100 | $1,900 | $1.73 | 43d | 1 | 0.92mi |
| 1334 Marfa Ave Dallas, TX | 3.0 | 2.0 | 1100 | $1,475 | $1.34 | 43d | 1 | 0.94mi |
| 1754 E Red Bird Ln Dallas, TX | 3.0 | 1.5 | 1115 | $1,675 | $1.50 | 7d | 1 | 0.99mi |
| 2751 E Ledbetter Dr Dallas, TX | 1.0–3.0 | 1.0–1.5 | 794 | $1,186 | $1.49 | 43d | 3 | 1.13mi |
| 3608 S Marsalis Ave Dallas, TX | 2.0 | 1.0 | 907 | $1,400 | $1.54 | 43d | 1 | 1.34mi |
| 4836 Sunnyvale St Dallas, TX | 1.0–3.0 | 1.0–2.0 | 515 | $1,330 | $2.58 | 43d | 7 | 1.41mi |
| 2111 Crouch Rd Dallas, TX | 1.0–2.0 | 1.0–2.0 | 866 | $1,277 | $1.47 | 6d | 1 | 1.44mi |
| 3015 E Ledbetter Dr Dallas, TX | 2.0–3.0 | 2.0 | 1030 | $1,100 | $1.07 | 3d | 1 | 1.49mi |
| 2503 Stovall Dr Dallas, TX | 2.0 | 2.0 | 768 | $2,300 | $2.99 | 43d | 1 | 1.50mi |
Listing history 36 events
-
2026-06-18days on market $129,500 Active 56 DOM
-
2026-06-17days on market $129,500 Active 55 DOM
-
2026-06-16days on market $129,500 Active 54 DOM
-
2026-06-15days on market $129,500 Active 53 DOM
-
2026-06-13days on market $129,500 Active 51 DOM
-
2026-06-09days on market $129,500 Active 47 DOM
-
2026-06-08days on market $129,500 Active 46 DOM
-
2026-06-07days on market $129,500 Active 45 DOM
-
2026-06-04days on market $129,500 Active 42 DOM
-
2026-06-03days on market $129,500 Active 41 DOM
-
2026-06-02days on market $129,500 Active 40 DOM
-
2026-06-01days on market $129,500 Active 39 DOM
-
2026-05-31days on market $129,500 Active 38 DOM
-
2026-05-13price $129,500 599-char remark
-
2026-04-23$139,500 Active 599-char remark
-
2014-04-04historical
-
2014-03-17price $54,900
-
2014-03-06price $59,900
-
2014-03-03$69,900 Active
-
2013-06-18soldstatus
-
2013-06-18soldstatus
-
2013-06-18soldstatus
-
2013-06-18soldstatus
-
2013-06-18soldstatus
-
2013-06-18soldstatus
-
2013-06-18soldstatus
-
2013-06-18soldstatus
-
2013-06-18soldstatus
-
2013-06-18soldstatus
-
2013-06-18soldstatus
-
2013-06-18soldstatus
-
2013-06-18soldstatus
-
2013-06-18soldstatus
-
2013-06-18soldstatus
-
2013-06-18soldstatus
-
2012-01-25soldstatus
ⓘ Source: listings_history table (triggers on properties + properties_extension) + one-shot
backfill from property_details.listing_events for pre-trigger history.
Tax reassessment forecast TX · Resets to sale price
- Current annual tax
- $3,556 · $296/mo
- Projected year-2 tax
- $3,556 · $296/mo
- Expected delta
- $0/yr ($0/mo · 0.0%)
ⓘ Screening estimate from a state-policy table — verify with the county assessor before closing.
Climate risk First Street
- Flood 1/10 Low FEMA zone X (unshaded) · 0% chance over 30 yrs
- Wildfire 1/10 Low
- Heat 7/10 Severe 7 d/yr ≥110°F today · 23 d/yr by 30 yrs out
- Wind 6/10 Major 27% chance of damaging wind over 30 yrs
- Air quality 2/10 Low 1 unhealthy d/yr today · 2 by 30 yrs out
Nearby sold comps map
Loading sold comps map…
Walkable amenities ~0.75 mi
Loading nearby amenities…
Taxation est. · year 1
- Rental income
- $19,903
- − Mortgage interest
- −$7,254
- − Property taxes
- −$3,556
- − Insurance
- −$648
- − Repairs & maintenance
- −$1,592
- − Management
- −$1,592
- − Depreciation
- −$3,767
- Taxable income
- $1,493
- Est. tax owed @ 24.0%
- −$358
- After-tax cash flow
- $3,012/yr
For passive investors: Depreciation is non-cash, so a rental often shows a tax loss while cash-flowing — sheltering income. Rental losses are passive: they offset passive income freely, and up to $25,000/yr can offset ordinary (W-2) income if you actively participate and your MAGI is under $100k (phasing out to $0 by $150k); unused losses carry forward. On sale, claimed depreciation is recaptured at up to 25%, and gains may owe capital-gains tax (a 1031 exchange can defer both). Figures are a year-1 estimate at your 24.0% rate — not tax advice; consult a CPA.
Schools (NCES district)
- District
- Dallas ISD
- NCES district ID
- 4816230
- Math proficiency
- 31% ▼ -16.00%
- Reading proficiency
- 36% ▼ -4.00%
- Median HH income
- $42,881
- Composite
- 28.41/100
- National rank
- #6763
- State rank
- #559 of 826 in TX
Livability — Dallas
- Score
- 81/100
- State rank
- #24
- US rank
- #1380
Category grades
Schools grade is shown separately in the Schools card above.
Census & demographics
- Census place
- Dallas, TX
- County
- Dallas County · 2,612,404 people
- City population
- 1,168,437
- Metro
- Dallas-Fort Worth-Arlington, TX
- Population (ZIP)
- 55,894
- Household income
- $41,386
- Rent vs Own
- Severe rent burden
- 2465.0
Population outlook (Dallas County) Hauer SSP2
- Today (2025)
- 2,979,839 people
- By 2030
- 3,191,823 · +7.1%
- By 2040
- 3,619,611 · +21.5%
- By 2050
- 4,026,915 · +35.1%
- By 2075
- 4,957,073 · +66.4%
- By 2100
- 5,508,725 · +84.9%
Race, ethnicity, and origin ACS 2023
- Neighborhood character
- Majority Black (51%)
- Race & ethnicity
- Black 51% Hispanic / Latino 44% Two or more races 14% White 3%
- Hispanic origin (detail)
- Mexican 40%
- Common ancestry
- Hispanic 1%
- Foreign-born
- 17% · Canada
- Languages at home
- 62% English-only · Spanish 37%
Political lean MEDSL · Dallas
- 2024 margin
- Strong D (+22.2) · D 60.2% · R 38.0% · Other 1.8%
- 2008→2024 swing
- +6.9pp toward D · 2008: 15.3pp · 2024: 22.2pp
- All cycles
- 2024: D+22.2 2020: D+31.6 2016: D+26.2 2012: D+15.4 2008: D+15.3
Not yet ingested
- Civics
- —
Market trends
- HPI YoY
- ▼ -126.35%
- Current HPI
- 299.1825
- Rent YoY
- ▲ 4.20%
- Metro
- Dallas-Fort Worth-Arlington, TX
- State GDP YoY
- ▲ 3.95%
- F500 in state
- 110
Industry mix (Fortune 500 HQ in TX)
| Industry | F500 HQs | Revenue |
|---|---|---|
| Energy | 16 | $1,198B |
|
||
| Technology | 5 | $198B |
|
||
| Engineering / Construction | 4 | $72B |
|
||
| Energy Services | 3 | $60B |
|
||
| Utilities | 3 | $41B |
|
||
| Healthcare | 2 | $330B |
|
||
Price history
+58.1% since first listed24 events — show timeline
- 2026-06-19 Price Changed $110,500 NTREIS
- 2026-05-13 Price Changed $129,500 NTREIS
- 2026-04-23 Listed $139,500 NTREIS
- 2014-04-04 Listing Removed — NTREIS
- 2014-03-17 Price Changed $54,900 NTREIS
- 2014-03-06 Price Changed $59,900 NTREIS
- 2014-03-03 Listed $69,900 NTREIS
- 2013-06-18 Sold (Public Records) — Public Records
- 2013-06-18 Sold (Public Records) — Public Records
- 2013-06-18 Sold (Public Records) — Public Records
- 2013-06-18 Sold (Public Records) — Public Records
- 2013-06-18 Sold (Public Records) — Public Records
- 2013-06-18 Sold (Public Records) — Public Records
- 2013-06-18 Sold (Public Records) — Public Records
- 2013-06-18 Sold (Public Records) — Public Records
- 2013-06-18 Sold (Public Records) — Public Records
- 2013-06-18 Sold (Public Records) — Public Records
- 2013-06-18 Sold (Public Records) — Public Records
- 2013-06-18 Sold (Public Records) — Public Records
- 2013-06-18 Sold (Public Records) — Public Records
- 2013-06-18 Sold (Public Records) — Public Records
- 2013-06-18 Sold (Public Records) — Public Records
- 2013-06-18 Sold (Public Records) — Public Records
- 2012-01-25 Sold (Public Records) — Public Records
Property tax history
+8.5%/yrLatest (2025): $3,556 · -0.4% YoY. Source: county tax records.
Cash-flow waterfall
monthlySold comps — $/sqft
last 12 mo · ≤1 miLoading sold comps…