 🏗️ New Construction
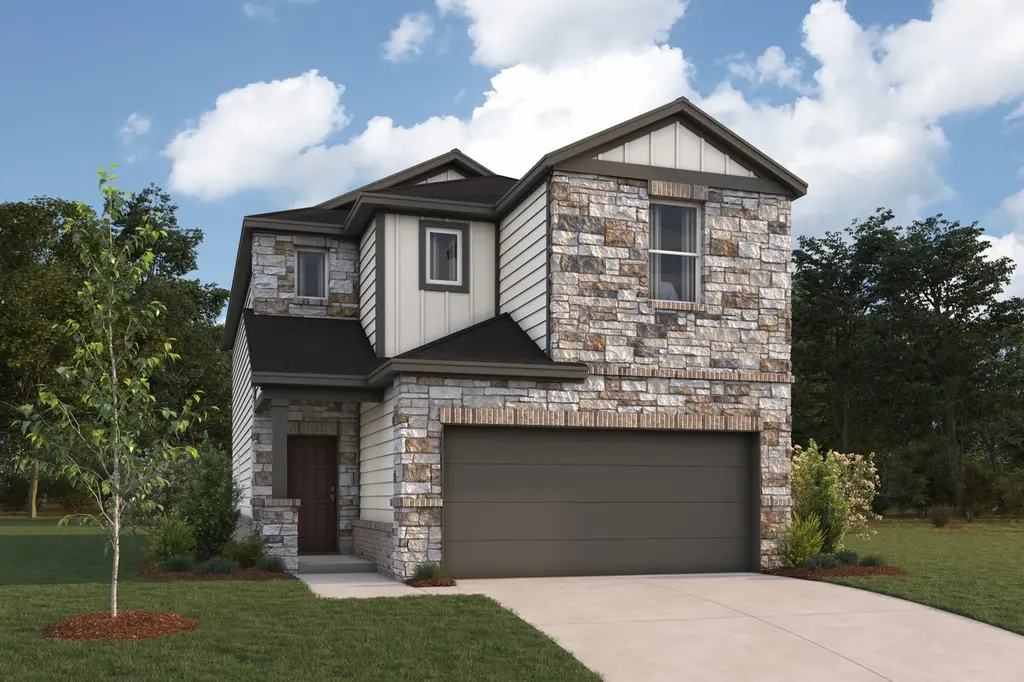
Catarina Plan · Dripping Springs, TX
Flood risk 1/10 · Minimal
- FEMA flood zone
- X (unshaded)
- Chance of flooding over 30 yrs
- 0.0%
- Est. flood insurance / yr
- $507 – $1,088
Fire risk 5/10 · Moderate
- Est. fire insurance / yr
- $1,222 – $2,270
Heat risk 7/10 · Major
- Hot days now (above 106°F)
- 5 days/yr
- Hot days in 30 yrs
- 14 days/yr
Wind risk 6/10 · Moderate
- Chance of severe wind over 30 yrs
- 69.0%
Air-quality risk 2/10 · Minimal
- Unhealthy air days now
- 0 days/yr
- Unhealthy air days in 30 yrs
- 1 days/yr
Risk factors via First Street. Map © Google.
Why this score? — see what drove the F grade
The composite is a weighted blend of 9 inputs, each scored 0–100. Each bar is that input's sub-score; the figure is the points it added to the 100-point composite (weight × sub-score).
- ARV discount +7.5/15.0
- Cash flow +5.5/30.0
- Schools +5.5/10.0
- Livability +3.8/5.0
- Rent growth +3.0/5.0
- Condition / age +2.5/5.0
- 1% rule +1.0/10.0
- DSCR +0.0/10.0
- Appreciation +0.0/10.0
$369,990
🖨 Deal sheet (PDF) 📄 Offer letter ✓ Due diligence
Listing remarks MLS
The Catarina is a versatile two-story home that combines open-concept living with flexible spaces designed to grow with your needs.
Key facts
- 2 garage spots
- Listed 178 days
Neighborhood map
What this means for you Summary
Snapshot
- This is a 3-bed/2.5-bath single-family listed at $370k.
Deal economics
- At list price, monthly cash flow is $-1k ($-12k/yr) — negative.
- To cash-flow at today's rent, offer at most $327k (11.5% below list).
- To meet the 1% rule (rent ≥ 1% of price), the offer needs to be $286k (22.6% below list).
- Recommended offer: $286k (22.6% below list) — sets the bar for 1% rule.
- Cap rate 3.7% vs local median 2.1% in Dripping Springs — top-decile yield for the area; either an underpriced asset or a hidden risk that comps aren't pricing in. Stress-test before assuming the spread holds.
Location & tenants
- Location reads 75/100 on livability (#149 in TX, #4,158 nationally) — a middle-class / working-renter tenant base. Strengths: crime A+, employment A+, housing A+; Watch: cost of living D, amenities F, commute F.
- Dripping Springs ISD (rural): math 55% / reading 61% proficiency, ranked #41 of 826 in TX (top 5%) — acceptable for families but not a draw, mixed tenant base, ~2y average lease; only 16% free/reduced lunch — higher-income household profile.
- Zoned schools: Walnut Springs El (math 51% / reading 58%, grade C, #621 of 4,322 statewide, top 15%, 887 students, 13% FRL); Dripping Springs Middle (math 52% / reading 53%, grade C+, #293 of 1,662 statewide, top 18%, 882 students, 0% FRL); Dripping Springs H S (math 45% / reading 76%, grade C+, #268 of 1,632 statewide, top 17%, 2,433 students, 0% FRL).
- Market conditions: Rents rising (+1.8%/yr); 765 active listings in the ZIP; 20 comparable units currently listed for rent nearby; rentals at typical pace (median 26d on market — plan ~3-4 weeks tenant-placement turnaround); 40% of comp listings sitting > 30 days — soft ceiling on asking rent; high-income renter base; 5,270 units permitted in Hays County in 2024 (1,464 in 5+ unit buildings).
Forward outlook
- Local home prices are declining (-3.0%/yr); year-one equity from $3k of loan paydown is wiped out by about $14k of value loss. Plan a longer hold.
- Hays County population projected at +93% by 2050 — long-run rental-demand tailwind backs the buy-and-hold thesis.
Negotiation context
- It's been on market 179 days — a 12% lower offer ($326k) is reasonable based on typical stale-listing flexibility.
- 2 sale attempts; this cycle's ask has dropped $30k (8%) from the opening price — seller is motivated, your offer sets the floor, not the list.
Risks & watch-outs
- Climate carrying-cost: major wind risk, 69% chance of damaging wind over 30y; moderate wildfire risk; extreme-heat days projected 5→14/yr by 2055 (HVAC capex compounding) — expect insurance premiums to compound above CPI over the hold.
Questions for the listing agent
- What do current leases actually rent for vs. the listed asking? Can we see a recent rent roll and the last 12 months of T-12 income?
- It's been on market 179 days. Have you received any prior offers? Is the seller open to a 23% concession, seller financing, or rate buy-down credit?
- Why hasn't it sold? Are there any deal-killer items the seller is aware of (foundation, flood, title, zoning, code violations)?
- Is there a deadline driving the sale (1031 exchange, divorce, estate, relocation)? That informs how much negotiation room exists.
- The area grade is low — what's the realistic commute time and amenity access for the typical tenant pool here? Any planned neighborhood developments (good or bad) we should know about?
- What's the average days-on-market for RENTAL listings here right now (not sales)? A rising rental-DOM trend means longer vacancies and softer asking-rent achievability than the comps imply.
- What's the recent tenant-quality profile in this submarket — average credit score on applications, eviction rate, late-payment / NSF rate, and stable-employment percentage? A property-management company in the area should have these aggregated.
- How much new for-sale + rental construction is in the pipeline within 1–3 miles? Heavy new supply typically softens prices + rents 12–24 months out; constrained supply supports both.
Investment metrics
- 1% rule
- 0.60% ✗
- Cap rate
- 3.73%
- Cash-on-cash
- -9.14%
- DSCR
- 0.59
- GRM
- 13.8
CMA / ARV
- ARV (median comp)
- $473,492
- List price
- $369,990
- Delta
- -21.86%
- Verdict
- UNDERPRICED
- Comps
- 20 within 1.0 mi
Show comp detail 12 sales within ~0.75 mi
| Address | Dist | Beds/Ba | Sqft | Sold | Price | $/sf | Match |
|---|---|---|---|---|---|---|---|
| 139 Great Sequoia Ln | 0.18mi | 3/2.5 | 1,951 (-11%) | 2mo | $424,241 | $217 | 72 |
| 344 Milkwood Ter | 0.12mi | 4/3.5 (+1) | 2,362 (+8%) | 1mo | $489,985 | $207 | 72 |
| 458 Bishop Wood Rd | 0.38mi | 4/3.0 (+1) | 2,251 (+3%) | 2mo | $499,990 | $222 | 70 |
| 165 Senna Dr | 0.58mi | 3/2.0 | 2,175 (-1%) | 0mo | $540,000 | $248 | 69 |
| 587 Bishop Wood Rd | 0.42mi | 4/2.5 (+1) | 2,289 (+4%) | 0mo | $424,990 | $186 | 68 |
| 126 Buckthorn Dr | 0.63mi | 3/2.5 | 2,153 (-2%) | 1mo | $359,900 | $167 | 67 |
| 221 Hilltop Dr | 0.68mi | 3/3.0 | 2,134 (-3%) | 0mo | $460,000 | $216 | 61 |
| 578 Darley Oak Dr | 0.29mi | 4/3.0 (+1) | 1,963 (-11%) | 1mo | $429,990 | $219 | 61 |
| 296 Bishop Wood Rd | 0.38mi | 4/3.0 (+1) | 2,434 (+11%) | 1mo | $504,990 | $207 | 56 |
| 1107 Lucca Dr | 0.54mi | 3/2.5 | 1,955 (-11%) | 2mo | $485,000 | $248 | 55 |
| 380 Heritage Forest Pkwy | 0.31mi | 4/3.0 (+1) | 2,495 (+14%) | 1mo | $536,393 | $215 | 55 |
| 105 Mount Ord Ln | 0.62mi | 3/2.5 | 1,876 (-14%) | 1mo | $379,500 | $202 | 46 |
Match score weights: distance 35% · size 25% · config 20% · recency 20%. Top-matched comps best support the ARV.
Projected returns pro-forma
-3.0% appreciation · 1.8% rent growth · sell at horizon
- IRR
- -33.9%
- Equity multiple
- -0.09×
- Total profit
- $-144,407
- Equity at exit
- $70,599
- IRR
- -50.3%
- Equity multiple
- -0.67×
- Total profit
- $-222,064
- Equity at exit
- $40,939
Cash invested: $132,578 (down + closing). Projections, not guarantees.
Landlord ↔ Tenant lean methodology
- Overall (STATE)
- 87 Strongly Landlord-Friendly
- State Texas
- 87 Strongly Landlord-Friendly · R+5
- County
- — inherits STATE
- City
- — inherits STATE
ZIP-level market 78620
- Home prices YoY
- -25.1%
- Rents YoY
- 1.8%
- Active inventory
- 765
- Price-to-rent
- 10.8×
Monthly cashflow live
- Estimated rent
- $2,864 high interval (Pro) →
- Mortgage (P&I)
- −$2,483
- Tax est. 1.5%
- −$592 /mo · $7,102/yr
- Insurance
- −$197
- HOA
- −$0
- Vacancy / Maint / Mgmt
- −$601
- Net cashflow
- $-1,010
Break-even live
Sensitivity live
| Price | -10% $-682 | -5% $-846 | +0% $-1,010 | +5% $-1,173 | +10% $-1,337 |
|---|---|---|---|---|---|
| Rent | -10% $-1,236 | -5% $-1,123 | +0% $-1,010 | +5% $-897 | +10% $-783 |
| Rate | -1.0pp $-771 | -0.5pp $-889 | base $-1,010 | +0.5pp $-1,132 | +1.0pp $-1,257 |
UW: 25.0% down · 7.5% · 30yr · 1.5% tax · 5.0% vac · 8.0% maint · 8.0% mgmt
Financing live
Cash to close
- Down payment
- $118,373
- Closing costs
- $14,205
- Reserves months
- —
- Total cash needed
- —
Loan-product check · same deal, 3 products live
Conventional
25% down · 7.5% · 30yr
- Down + closing
- —
- Monthly P&I
- —
- Monthly cashflow
- —
- DSCR
- —
- Eligible?
- —
Personal DTI + credit; lowest rate.
DSCR
20% down · 8.5% · 30yr
- Down + closing
- —
- Monthly P&I
- —
- Monthly cashflow
- —
- DSCR
- —
- Eligible?
- —
No personal income docs; deal must DSCR.
Hard money
10% down · 12.0% · 12mo
- Down + closing
- —
- Monthly P&I
- —
- Monthly cashflow
- —
- DSCR
- —
- Eligible?
- —
Short-term bridge; refi at stabilization.
Rent comps 20 comps
| Address | Beds | Baths | Sqft | Rent | $/sqft | DOM | Units | Dist |
|---|---|---|---|---|---|---|---|---|
| 358 Darley Oak Dr Dripping Springs, TX | 4.0 | 3.0 | 2543 | $3,250 | $1.28 | 19d | 1 | 0.15mi |
| 468 Milkwood Ter Dripping Springs, TX | 3.0 | 2.5 | 1483 | $2,450 | $1.65 | 45d | 1 | 0.18mi |
| 134 Big Banyan Dr Dripping Springs, TX | 4.0 | 2.5 | 1950 | $3,000 | $1.54 | 45d | 1 | 0.23mi |
| 394 Bishop Wood Rd Dripping Springs, TX | 3.0 | 2.5 | 2182 | $3,200 | $1.47 | 25d | 1 | 0.36mi |
| 160 Loving Trl Unit B Dripping Springs, TX | 3.0 | 2.0 | 2760 | $2,075 | $0.75 | 25d | 1 | 0.44mi |
| 115 Iron Rail Rd Dripping Springs, TX | 3.0 | 2.5 | 1896 | $2,250 | $1.19 | 45d | 1 | 0.58mi |
| 106 Buckthorn Dr Dripping Springs, TX | 3.0 | 2.5 | 2258 | $2,450 | $1.09 | 6d | 1 | 0.64mi |
| 210 Dome Peak Ter Dripping Springs, TX | 4.0 | 2.0 | 1644 | $2,700 | $1.64 | 45d | 1 | 0.65mi |
| 253 Spanish Star Trl Dripping Springs, TX | 3.0 | 2.5 | 1652 | $2,200 | $1.33 | 25d | 1 | 0.66mi |
| 787 Lone Peak Way Dripping Springs, TX | 3.0 | 2.5 | 2319 | $2,450 | $1.06 | 45d | 1 | 0.74mi |
| 435 Hays St Dripping Springs, TX | 3.0 | 2.0 | 1949 | $5,250 | $2.69 | 45d | 1 | 0.80mi |
| 319 Pecos River Xing Dripping Springs, TX | 3.0 | 2.5 | 2155 | $3,500 | $1.62 | 19d | 1 | 0.80mi |
| 779 Founders Rdg Dripping Springs, TX | 3.0 | 2.5 | 2123 | $3,300 | $1.55 | 4d | 1 | 0.82mi |
| 856 Lone Peak Way Dripping Springs, TX | 3.0 | 2.5 | 1948 | $2,550 | $1.31 | 14d | 1 | 0.83mi |
| 218 Glass Mountain Way Dripping Springs, TX | 3.0 | 2.5 | 2213 | $2,500 | $1.13 | 45d | 1 | 0.87mi |
| 218 Glass Mountain Way Dripping Springs, TX | 3.0 | 2.5 | 2213 | $2,500 | $1.13 | 25d | 1 | 0.87mi |
| 386 El Capitan Loop Dripping Springs, TX | 4.0 | 3.0 | 2047 | $2,900 | $1.42 | 19d | 1 | 1.28mi |
| 1282 S Rob Shelton Blvd Dripping Springs, TX | 2.0 | 1.0–2.0 | 983 | $2,756 | $2.80 | 0d | 47 | 1.30mi |
| 500 Harmon Hills Cv Unit B Dripping Springs, TX | 3.0 | 2.0 | 1460 | $2,500 | $1.71 | 45d | 1 | 1.34mi |
| 285 Cathedral Mountain Dr Dripping Springs, TX | 4.0 | 2.5 | 2111 | $3,100 | $1.47 | 6d | 1 | 1.34mi |
Listing history 19 events
-
2026-06-21days on market $369,990 Active 179 DOM
-
2026-06-18days on market $369,990 Active 176 DOM
-
2026-06-17days on market $369,990 Active 175 DOM
-
2026-06-16days on market $369,990 Active 174 DOM
-
2026-06-15days on market $369,990 Active 173 DOM
-
2026-06-13days on market $369,990 Active 171 DOM
-
2026-06-13days on market $369,990 Active 170 DOM
-
2026-06-09days on market $369,990 Active 167 DOM
-
2026-06-08days on market $369,990 Active 166 DOM
-
2026-06-07days on market $369,990 Active 165 DOM
-
2026-06-04days on market $369,990 Active 162 DOM
-
2026-06-03days on market $369,990 Active 161 DOM
-
2026-06-02days on market $369,990 Active 160 DOM
-
2026-06-01days on market $369,990 Active 159 DOM
-
2026-05-31days on market $369,990 Active 158 DOM
-
2026-05-01price $369,990 131-char remark
Show marketing remark (131 chars)
The Catarina is a versatile two-story home that combines open-concept living with flexible spaces designed to grow with your needs.
-
2026-01-15status Active 131-char remark
Show marketing remark (131 chars)
The Catarina is a versatile two-story home that combines open-concept living with flexible spaces designed to grow with your needs.
-
2026-01-14historical 131-char remark
Show marketing remark (131 chars)
The Catarina is a versatile two-story home that combines open-concept living with flexible spaces designed to grow with your needs.
-
2025-12-24$399,990 Active 131-char remark
Show marketing remark (131 chars)
The Catarina is a versatile two-story home that combines open-concept living with flexible spaces designed to grow with your needs.
ⓘ Source: listings_history table (triggers on properties + properties_extension) + one-shot
backfill from property_details.listing_events for pre-trigger history.
Climate risk First Street
- Flood 1/10 Low FEMA zone X (unshaded) · 0% chance over 30 yrs
- Wildfire 5/10 Major
- Heat 7/10 Severe 5 d/yr ≥106°F today · 14 d/yr by 30 yrs out
- Wind 6/10 Major 69% chance of damaging wind over 30 yrs
- Air quality 2/10 Low 0 unhealthy d/yr today · 1 by 30 yrs out
Nearby sold comps map
Loading sold comps map…
Walkable amenities ~0.75 mi
Loading nearby amenities…
Taxation est. · year 1
- Rental income
- $34,367
- − Mortgage interest
- −$26,523
- − Property taxes
- −$7,102
- − Insurance
- −$2,367
- − Repairs & maintenance
- −$2,749
- − Management
- −$2,749
- − Depreciation
- −$13,774
- Taxable loss
- −$20,898
- Est. tax savings @ 24.0%
- +$5,016
- After-tax cash flow
- $-7,100/yr
For passive investors: Depreciation is non-cash, so a rental often shows a tax loss while cash-flowing — sheltering income. Rental losses are passive: they offset passive income freely, and up to $25,000/yr can offset ordinary (W-2) income if you actively participate and your MAGI is under $100k (phasing out to $0 by $150k); unused losses carry forward. On sale, claimed depreciation is recaptured at up to 25%, and gains may owe capital-gains tax (a 1031 exchange can defer both). Figures are a year-1 estimate at your 24.0% rate — not tax advice; consult a CPA.
Schools (NCES district)
- District
- Dripping Springs ISD
- NCES district ID
- 4800008
- Math proficiency
- 55% ▼ -8.00%
- Reading proficiency
- 61% ▼ -6.00%
- Median HH income
- $103,367
- Composite
- 54.5/100
- National rank
- #1347
- State rank
- #41 of 826 in TX
Livability — Dripping Springs
- Score
- 75/100
- State rank
- #149
- US rank
- #4158
Category grades
Schools grade is shown separately in the Schools card above.
Census & demographics
- Census place
- Dripping Springs, TX
- County
- Hays County · 280,138 people
- City population
- 22,860
- Metro
- Austin-Round Rock-Georgetown, TX
- Population (ZIP)
- 22,860
- Household income
- $153,477
- Rent vs Own
- Severe rent burden
- 216.0
Population outlook (Hays County) Hauer SSP2
- Today (2025)
- 286,948 people
- By 2030
- 336,923 · +17.4%
- By 2040
- 441,894 · +54.0%
- By 2050
- 553,462 · +92.9%
- By 2075
- 838,261 · +192.1%
- By 2100
- 1,063,658 · +270.7%
Race, ethnicity, and origin ACS 2023
- Neighborhood character
- Predominantly White (76%)
- Race & ethnicity
- White 76% Hispanic / Latino 14% Two or more races 11% Asian 4%
- Hispanic origin (detail)
- Mexican 10% Puerto Rican 1%
- Common ancestry
- Slovak 4% Italian 3% Lithuanian 2%
- Foreign-born
- 9% · Canada
- Languages at home
- 90% English-only · Spanish 6% Other Indo-European 2% Other Asian/Pacific 1%
Political lean MEDSL · Hays
- 2024 margin
- Lean D (+5.7) · D 52.1% · R 46.5% · Other 1.4%
- 2008→2024 swing
- +7.7pp toward D · 2008: -2.0pp · 2024: 5.7pp
- All cycles
- 2024: D+5.7 2020: D+10.8 2016: R+0.9 2012: R+10.4 2008: R+2.0
Not yet ingested
- Civics
- —
Market trends
- HPI YoY
- ▼ -103.51%
- Current HPI
- 308.2387
- Rent YoY
- ▲ 1.80%
- Metro
- Austin-Round Rock-Georgetown, TX
- State GDP YoY
- ▲ 3.95%
- F500 in state
- 110
Industry mix (Fortune 500 HQ in TX)
| Industry | F500 HQs | Revenue |
|---|---|---|
| Energy | 16 | $1,198B |
|
||
| Technology | 5 | $198B |
|
||
| Engineering / Construction | 4 | $72B |
|
||
| Energy Services | 3 | $60B |
|
||
| Utilities | 3 | $41B |
|
||
| Healthcare | 2 | $330B |
|
||
Price history
-7.5% since first listed4 events — show timeline
- 2026-05-01 Price Changed $369,990 Zillow
- 2026-01-15 Relisted — Zillow
- 2026-01-14 Delisted — Zillow
- 2025-12-24 Listed $399,990 Zillow
Cash-flow waterfall
monthlySold comps — $/sqft
last 12 mo · ≤1 miLoading sold comps…