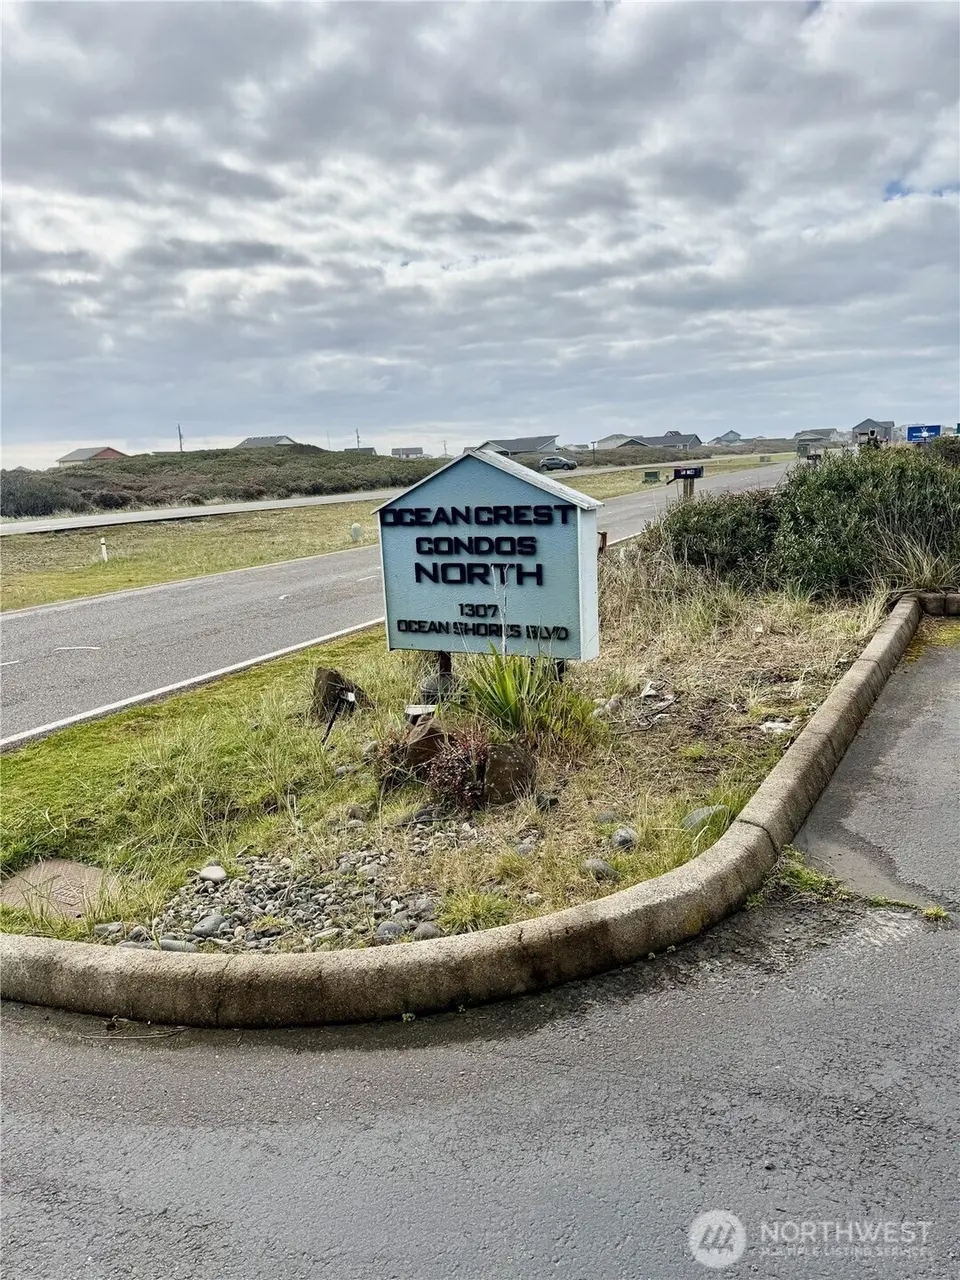
1307 Ocean Shores Blvd Blvd SW Unit N14 · Ocean Shores, WA
Flood risk No data
- FEMA flood zone
- —
- Chance of flooding over 30 yrs
- —
- Est. flood insurance / yr
- —
Fire risk No data
- Est. fire insurance / yr
- —
Heat risk No data
- Hot days now (above threshold)
- —
- Hot days in 30 yrs
- —
Wind risk No data
- Chance of severe wind over 30 yrs
- —
Air-quality risk No data
- Unhealthy air days now
- —
- Unhealthy air days in 30 yrs
- —
Risk factors via First Street. Map © Google.
Why this score? — see what drove the F grade
The composite is a weighted blend of 9 inputs, each scored 0–100. Each bar is that input's sub-score; the figure is the points it added to the 100-point composite (weight × sub-score).
- 1% rule +8.2/10.0
- ARV discount +7.5/15.0
- Cash flow +4.8/30.0
- Schools +3.4/10.0
- Livability +3.1/5.0
- Rent growth +2.5/5.0
- Condition / age +2.2/5.0
- DSCR +0.0/10.0
- Appreciation +0.0/10.0
$99,500
🖨 Deal sheet (PDF) 📄 Offer letter ✓ Due diligence
Listing remarks
Take a look at this affordable ground floor ocean front condo. Needs some upgrades but the price is right. Being sold "As Is". Imagine living on the beach listening to the crashing waves of the Pacific Ocean. This 1st-floor, easy access, north corner condo is located in the Ocean Crest North building, which features an elevator, 2 access stairs, fire sprinklers, and enclosed outdoor hallways. This condo features an open design with a slider to the patio. Kitchen with counter, all appliances, plenty of cabinet and counter space, and a closet with the stackable washer/dryer. Large open bedroom and a 3/4 bath. As a corner unit, it has extra windows in the living area to allow for mor
Key facts
- North corner condo
- Slider to patio
- Open design
Tags
Neighborhood map
What this means for you Summary
Snapshot
- This is a 1-bed/1.0-bath condo listed at $100k. Condition is rated fair.
Deal economics
- At list price, monthly cash flow is $-241 ($-3k/yr) — negative.
- To cash-flow at today's rent, offer at most $65k (35.1% below list).
- Meets the 1% rule at list price ($1k rent vs $100k).
- Recommended offer: $65k (35.1% below list) — sets the bar for cash-flow.
Location & tenants
- Location reads 62/100 on livability (#424 in WA) — a middle-class / working-renter tenant base. Strengths: housing A; Watch: schools C-, crime C-, health & safety C-.
- North Beach School District (rural): math 32% / reading 44% proficiency, ranked #236 of 291 in WA (top 81%) — families likely to look elsewhere, expect single-tenant / working-renter base with shorter leases; 63% free/reduced lunch — lower-income household profile, screen leases tightly.
- Market conditions: 653 active listings in the ZIP; 297 units permitted in Grays Harbor County in 2024 (17 in 5+ unit buildings).
Forward outlook
- Local home prices are declining (-3.0%/yr); year-one equity from $688 of loan paydown is wiped out by about $3k of value loss. Plan a longer hold.
- Grays Harbor County population projected at -24% by 2050 — secular population decline; favor cash flow + early exit over multi-decade hold.
Negotiation context
- It's been on market 77 days — a 6% lower offer ($94k) is reasonable based on typical stale-listing flexibility.
- 4 sale attempts since 9y ago; this cycle's ask has dropped $62k (39%) from the opening price — seller is motivated, your offer sets the floor, not the list.
- Current owner paid $80k; 24% above their basis — modest negotiation headroom, anchor on the comps not their cost.
Risks & watch-outs
- Watch-outs: HOA is 45% of rent.
Questions for the listing agent
- What do current leases actually rent for vs. the listed asking? Can we see a recent rent roll and the last 12 months of T-12 income?
- It's been on market 77 days. Have you received any prior offers? Is the seller open to a 35% concession, seller financing, or rate buy-down credit?
- Have any recent inspections been done? Can we get a copy of the seller's disclosures and any deferred-maintenance estimates?
- What does the HOA fee cover, when was the last increase, and are there any pending special assessments or reserve-fund shortfalls?
- Any open or pending special assessments — roof, HVAC, plumbing, elevator, façade? What's the per-unit balance and payoff schedule, and is the seller paying it off at close or rolling it to the buyer?
- Why hasn't it sold? Are there any deal-killer items the seller is aware of (foundation, flood, title, zoning, code violations)?
- Is there a deadline driving the sale (1031 exchange, divorce, estate, relocation)? That informs how much negotiation room exists.
- The area grade is low — what's the realistic commute time and amenity access for the typical tenant pool here? Any planned neighborhood developments (good or bad) we should know about?
- What's the average days-on-market for RENTAL listings here right now (not sales)? A rising rental-DOM trend means longer vacancies and softer asking-rent achievability than the comps imply.
- What's the recent tenant-quality profile in this submarket — average credit score on applications, eviction rate, late-payment / NSF rate, and stable-employment percentage? A property-management company in the area should have these aggregated.
- How much new apartment / multifamily construction is in the pipeline within 1–3 miles? Heavy new supply (>2% of stock underway) typically softens rents 12–24 months out; light construction supports rent growth.
Investment metrics
- 1% rule
- 1.32% ✓
- Cap rate
- 3.39%
- Cash-on-cash
- -10.38%
- DSCR
- 0.54
- GRM
- 6.3
CMA / ARV
- ARV (median comp)
- $229,637
- List price
- $99,500
- Delta
- -56.67%
- Verdict
- UNDERPRICED
- Comps
- 19 within 1.0 mi
Projected returns pro-forma
-3.0% appreciation · 3.0% rent growth · sell at horizon
- IRR
- -34.3%
- Equity multiple
- -0.12×
- Total profit
- $-31,095
- Equity at exit
- $14,836
- IRR
- -40.1%
- Equity multiple
- -0.63×
- Total profit
- $-45,295
- Equity at exit
- $8,603
Cash invested: $27,860 (down + closing). Projections, not guarantees.
Landlord ↔ Tenant lean methodology
- Overall (STATE)
- 28 Tenant-Leaning
- State Washington
- 28 Tenant-Leaning · D+8
- County
- — inherits STATE
- City
- — inherits STATE
ZIP-level market 98569
- Home prices YoY
- -3.4%
- Active inventory
- 653
- Price-to-rent
- 6.3×
Monthly cashflow live
- Estimated rent
- $1,312 medium interval (Pro) →
- Mortgage (P&I)
- −$522
- Tax est. 1.5%
- −$124 /mo · $1,492/yr
- Insurance
- −$41
- HOA
- −$590
- Vacancy / Maint / Mgmt
- −$276
- Net cashflow
- $-241
Break-even live
Sensitivity live
| Price | -10% $-172 | -5% $-207 | +0% $-241 | +5% $-275 | +10% $-310 |
|---|---|---|---|---|---|
| Rent | -10% $-345 | -5% $-293 | +0% $-241 | +5% $-189 | +10% $-137 |
| Rate | -1.0pp $-191 | -0.5pp $-216 | base $-241 | +0.5pp $-267 | +1.0pp $-293 |
UW: 25.0% down · 7.5% · 30yr · 1.5% tax · 5.0% vac · 8.0% maint · 8.0% mgmt
Financing live
Cash to close
- Down payment
- $24,875
- Closing costs
- $2,985
- Reserves months
- —
- Total cash needed
- —
Loan-product check · same deal, 3 products live
Conventional
25% down · 7.5% · 30yr
- Down + closing
- —
- Monthly P&I
- —
- Monthly cashflow
- —
- DSCR
- —
- Eligible?
- —
Personal DTI + credit; lowest rate.
DSCR
20% down · 8.5% · 30yr
- Down + closing
- —
- Monthly P&I
- —
- Monthly cashflow
- —
- DSCR
- —
- Eligible?
- —
No personal income docs; deal must DSCR.
Hard money
10% down · 12.0% · 12mo
- Down + closing
- —
- Monthly P&I
- —
- Monthly cashflow
- —
- DSCR
- —
- Eligible?
- —
Short-term bridge; refi at stabilization.
HOA detail condo
- Monthly dues
- $590 · $7,080/yr
- Assessments
- None detected in remarks — confirm with the listing agent.
Listing history 27 events
-
2026-06-19days on market $99,500 Active 77 DOM
-
2026-06-18days on market $99,500 Active 76 DOM
-
2026-06-17days on market $99,500 Active 75 DOM
-
2026-06-16days on market $99,500 Active 74 DOM
-
2026-06-16price $99,500 Active 73 DOM
-
2026-06-15days on market $144,900 Active 73 DOM
-
2026-06-14days on market $144,900 Active 71 DOM
-
2026-06-12days on market $144,900 Active 70 DOM
-
2026-06-09days on market $144,900 Active 67 DOM
-
2026-06-08days on market $144,900 Active 66 DOM
-
2026-06-07days on market $144,900 Active 65 DOM
-
2026-06-05days on market $144,900 Active 62 DOM
-
2026-06-03days on market $144,900 Active 61 DOM
-
2026-06-02days on market $144,900 Active 60 DOM
-
2026-06-01days on market $144,900 Active 59 DOM
-
2026-05-31days on market $144,900 Active 58 DOM
-
2026-05-30days on market $144,900 Active 57 DOM
-
2026-05-03price $144,900
-
2026-04-03$162,000 Active
-
2025-01-02historical $1,350
-
2024-12-20$1,350
-
2023-06-22historical
-
2017-09-01soldstatus $80,500 Sold
-
2017-08-18status Pending
-
2017-08-16status Active
-
2017-07-13status Pending Inspection
-
2017-03-27$85,000 Active
ⓘ Source: listings_history table (triggers on properties + properties_extension) + one-shot
backfill from property_details.listing_events for pre-trigger history.
Nearby sold comps map
Loading sold comps map…
Walkable amenities ~0.75 mi
Loading nearby amenities…
Taxation est. · year 1
- Rental income
- $15,745
- − Mortgage interest
- −$5,574
- − Property taxes
- −$1,492
- − Insurance
- −$498
- − Repairs & maintenance
- −$1,260
- − Management
- −$1,260
- − HOA
- −$7,080
- − Depreciation
- −$2,895
- Taxable loss
- −$4,312
- Est. tax savings @ 24.0%
- +$1,035
- After-tax cash flow
- $-1,858/yr
For passive investors: Depreciation is non-cash, so a rental often shows a tax loss while cash-flowing — sheltering income. Rental losses are passive: they offset passive income freely, and up to $25,000/yr can offset ordinary (W-2) income if you actively participate and your MAGI is under $100k (phasing out to $0 by $150k); unused losses carry forward. On sale, claimed depreciation is recaptured at up to 25%, and gains may owe capital-gains tax (a 1031 exchange can defer both). Figures are a year-1 estimate at your 24.0% rate — not tax advice; consult a CPA.
Condition & rehab AI · 6 photos
This affordable oceanfront condo requires moderate renovations to improve its condition and increase its value. Key areas for improvement include exterior landscaping, interior painting, and replacing worn carpet.
Repairs flagged
- Major exterior landscaping — Signage area is overgrown and needs trimming
- Major hallway carpet — Worn and dirty, needs replacement
- Minor door frames — Slight damage, can be repaired
Value-add opportunities
- Both Paint interior walls — Fresh paint can improve the appearance and value of the property
- Both Replace worn carpet in hallway — New carpet will enhance the aesthetic and functionality of the space
- Both Landscaping and exterior maintenance — A well-maintained exterior can significantly boost curb appeal and property value
Renovation cost estimate screening
| Repair item | Severity | Est. cost |
|---|---|---|
| exterior landscaping · Signage area is overgrown and needs trimming | Major | $15,000–50,000 |
| hallway carpet · Worn and dirty, needs replacement | Major | $15,000–50,000 |
| door frames · Slight damage, can be repaired | Minor | $500–3,000 |
| Total estimated repair cost · 3 items | $30,500–103,000 |
Value-add ROI direction
- Both Paint interior walls — Fresh paint can improve the appearance and value of the property ↑
- Both Replace worn carpet in hallway — New carpet will enhance the aesthetic and functionality of the space ↑
- Both Landscaping and exterior maintenance — A well-maintained exterior can significantly boost curb appeal and property value ↑
ⓘ Cost ranges are severity-bucket heuristics (US national rule-of-thumb). Get contractor quotes + a written scope before underwriting a rehab budget.
Schools (NCES district)
- District
- North Beach School District
- NCES district ID
- 5305700
- Math proficiency
- 32% ▼ -4.00%
- Reading proficiency
- 44% ▬ 0.00%
- Median HH income
- $40,966
- Composite
- 34.46/100
- National rank
- #10153
- State rank
- #236 of 291 in WA
Livability — Ocean Shores
- Score
- 62/100
- State rank
- #424
- US rank
- #16852
Category grades
Schools grade is shown separately in the Schools card above.
Census & demographics
- Census place
- Ocean Shores, WA
- County
- Grays Harbor County · 44,693 people
- City population
- 7,187
- Metro
- Aberdeen, WA
- Population (ZIP)
- 7,489
- Household income
- $58,378
- Rent vs Own
- Severe rent burden
- 172.0
Population outlook (Grays Harbor County) Hauer SSP2
- Today (2025)
- 66,443 people
- By 2030
- 63,255 · -4.8%
- By 2040
- 56,466 · -15.0%
- By 2050
- 50,516 · -24.0%
- By 2075
- 39,296 · -40.9%
- By 2100
- 31,142 · -53.1%
Race, ethnicity, and origin ACS 2023
- Neighborhood character
- Predominantly White (86%)
- Race & ethnicity
- White 86% Two or more races 5% Hispanic / Latino 4% Asian 3% Native American 3%
- Common ancestry
- Portuguese 8% Iranian 5% Lithuanian 4%
- Foreign-born
- 5% · Canada
- Languages at home
- 92% English-only · Spanish 3% Tagalog/Filipino 2% German/W. Germanic 2%
Political lean MEDSL · Grays Harbor
- 2024 margin
- Lean R (+6.0) · D 45.6% · R 51.6% · Other 2.8%
- 2008→2024 swing
- -20.6pp toward R · 2008: 14.6pp · 2024: -6.0pp
- All cycles
- 2024: R+6.0 2020: R+6.6 2016: R+7.1 2012: D+14.0 2008: D+14.6
Not yet ingested
- Civics
- —
Market trends
- HPI YoY
- ▼ -13.33%
- Current HPI
- 380.05
- Rent YoY
- —
- Metro
- Aberdeen, WA
- State GDP YoY
- ▲ 4.65%
- F500 in state
- 22
Industry mix (Fortune 500 HQ in WA)
| Industry | F500 HQs | Revenue |
|---|---|---|
| Retail | 2 | $269B |
|
||
| Technology / Retail | 1 | $638B |
|
||
| Technology | 1 | $245B |
|
||
| Telecommunications | 1 | $38B |
|
||
| Food / Beverage | 1 | $36B |
|
||
| Automotive / Trucks | 1 | $34B |
|
||
Price history
+70.5% since first listed10 events — show timeline
- 2026-05-03 Price Changed $144,900 NWMLS as Distributed by MLS Grid
- 2026-04-03 Listed $162,000 NWMLS as Distributed by MLS Grid
- 2025-01-02 Rental Removed $1,350 APPFOLIO
- 2024-12-20 Listed for Rent $1,350 APPFOLIO
- 2023-06-22 Rental Removed — APPFOLIO
- 2017-09-01 Sold (MLS) $80,500 NWMLS as Distributed by MLS Grid
- 2017-08-18 Pending — NWMLS as Distributed by MLS Grid
- 2017-08-16 Relisted — NWMLS as Distributed by MLS Grid
- 2017-07-13 Pending — NWMLS as Distributed by MLS Grid
- 2017-03-27 Listed $85,000 NWMLS as Distributed by MLS Grid
Cash-flow waterfall
monthlySold comps — $/sqft
last 12 mo · ≤1 miLoading sold comps…