28124 SW 142nd Ct · Leisure City, FL
Flood risk 5/10 · Moderate
- FEMA flood zone
- X (unshaded)
- Chance of flooding over 30 yrs
- 0.24%
- Est. flood insurance / yr
- $507 – $1,088
Fire risk 1/10 · Minimal
- Est. fire insurance / yr
- $947 – $1,759
Heat risk 10/10 · Severe
- Hot days now (above 105°F)
- 6 days/yr
- Hot days in 30 yrs
- 27 days/yr
Wind risk 10/10 · Severe
- Chance of severe wind over 30 yrs
- 99.0%
Air-quality risk 2/10 · Minimal
- Unhealthy air days now
- 1 days/yr
- Unhealthy air days in 30 yrs
- 1 days/yr
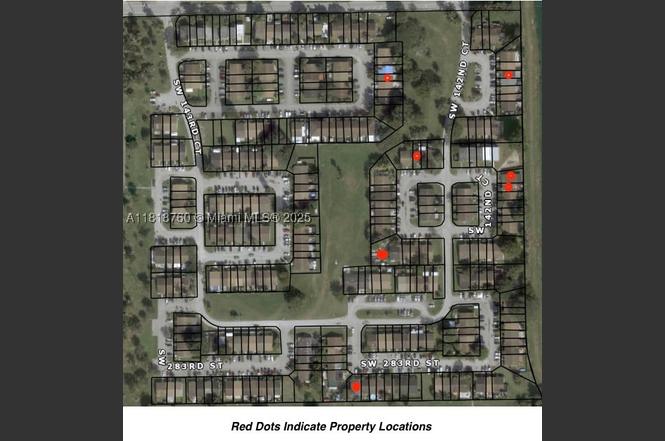
Risk factors via First Street. Map © Google.
Why this score? — see what drove the D grade
The composite is a weighted blend of 9 inputs, each scored 0–100. Each bar is that input's sub-score; the figure is the points it added to the 100-point composite (weight × sub-score).
- Cash flow +13.4/30.0
- ARV discount +7.5/15.0
- 1% rule +4.4/10.0
- Schools +4.2/10.0
- DSCR +4.0/10.0
- Livability +3.2/5.0
- Condition / age +2.5/5.0
- Rent growth +1.8/5.0
- Appreciation +0.0/10.0
$195,000
🖨 Deal sheet (PDF) 📄 Offer letter ✓ Due diligence
Listing remarks
BRING BULK OFFERS!! COURT ORDERED SALE - (7) TOWNHOMES IN THE SEAPINES COMMUNITY IN HOMESTEAD. ALL 7 UNITS UNITS WILL BE SOLD IN BULK. COUNTY PROPERTY APPRAISER UNIT INFO: (4) 1BD / 1.5BA / 920 SF AND (3) 3BD / 2BA / 1200 SF. THE 1 BEDROOM UNITS MAY HAVE 2 BEDROOMS AS THE OTHER UNITS IN THE COMMUNITY WITH 920 SF SHOW AS 2 BEDROOMS IN THE MLS. CHECK ATTACHMENTS FOR UNIT LIST AND DRAFT PURCHASE CONTRACT. * * In connection with a Bankruptcy Court Sale. Property is sold "As-Is, Where-Is" with no representations, guarantees or warranties of any kind. Buyer's Must Do Their Own Due Diligence.
Key facts
- $60 HOA
- Parking
- Built 2000
Property features AI
Finance
- Financial info: Pets allowed — no pet restrictions
- HOA & community: Association fee $180 quarterly; Association covers common areas
Exterior
- Parking: Assigned parking
- Utilities: Has heating and cooling (electric)
- Home design: Single-story; Entry level is 1; Has property attached
- Construction: Resale property
Interior
- Bathrooms: 1 full bathroom; 1 half bathroom
- Heating & cooling: Electric heating; Electric cooling
- Interior features: Bedroom on main level; First-floor entry
Neighborhood map
What this means for you Summary
Snapshot
- This is a 1-bed/1.0-bath townhouse listed at $195k.
Deal economics
- At list price, monthly cash flow is $4 ($48/yr) — positive.
- The deal already cash-flows at list — no discount required.
- To meet the 1% rule (rent ≥ 1% of price), the offer needs to be $183k (6.4% below list).
- Recommended offer: $172k (12.0% below list) — sets the bar for market timing.
Location & tenants
- Location reads 65/100 on livability (#639 in FL) — a middle-class / working-renter tenant base. Strengths: commute A, cost of living A-, housing B+; Watch: amenities F, employment F, health & safety F.
- Miami-Dade (suburban): math 45% / reading 54% proficiency, ranked #40 of 73 in FL (top 55%) — families likely to look elsewhere, expect single-tenant / working-renter base with shorter leases; 64% free/reduced lunch — lower-income household profile, screen leases tightly.
- Zoned schools: Mandarin Lakes K-8 Academy (math 18% / reading 22%, grade F, #2,098 of 2,144 statewide, top 98%, 781 students, 80% FRL); Redland Middle School (math 21% / reading 30%, grade F, #512 of 571 statewide, top 90%, 601 students, 71% FRL); Homestead Senior High School (math 24% / reading 23%, grade F, #533 of 667 statewide, top 80%, 2,020 students, 74% FRL).
- Zoned-school proficiency averages 23% at this address vs 50% district-wide (-26 pts) — the specific schools serving this property underperform the Miami-Dade average; the district grade overstates school quality for this exact location.
- Market conditions: Rents soft (-2.9%/yr); 619 active listings in the ZIP; 40 comparable units currently listed for rent nearby; rentals at typical pace (median 20d on market — plan ~3-4 weeks tenant-placement turnaround); 10,051 units permitted in Miami-Dade County in 2024 (7,758 in 5+ unit buildings).
- This rent runs 31% of the median local income ($70k/yr) — at the standard rent-burdened threshold; future hikes will face affordability resistance.
Forward outlook
- Local home prices are declining (-3.0%/yr); year-one equity from $1k of loan paydown is wiped out by about $6k of value loss. Plan a longer hold.
- Miami-Dade County population projected at +28% by 2050 — long-run rental-demand tailwind backs the buy-and-hold thesis.
Negotiation context
- It's been on market 376 days — a 12% lower offer ($172k) is reasonable based on typical stale-listing flexibility.
- Current owner paid $22k; list at $195k implies a 786% gain — meaningful room to come down on a strong offer.
Risks & watch-outs
- Climate carrying-cost: moderate flood risk; severe wind risk, 99% chance of damaging wind over 30y; extreme-heat days projected 6→27/yr by 2055 (HVAC capex compounding) — expect insurance premiums to compound above CPI over the hold.
Questions for the listing agent
- It's been on market 376 days. Have you received any prior offers? Is the seller open to a 12% concession, seller financing, or rate buy-down credit?
- What does the HOA fee cover, when was the last increase, and are there any pending special assessments or reserve-fund shortfalls?
- Why hasn't it sold? Are there any deal-killer items the seller is aware of (foundation, flood, title, zoning, code violations)?
- Is there a deadline driving the sale (1031 exchange, divorce, estate, relocation)? That informs how much negotiation room exists.
- Schools are F-rated, which usually means shorter tenancies and higher turnover. Who's the typical renter profile here, and what's been the actual vacancy rate?
- The area grade is low — what's the realistic commute time and amenity access for the typical tenant pool here? Any planned neighborhood developments (good or bad) we should know about?
- What's the average days-on-market for RENTAL listings here right now (not sales)? A rising rental-DOM trend means longer vacancies and softer asking-rent achievability than the comps imply.
- What's the recent tenant-quality profile in this submarket — average credit score on applications, eviction rate, late-payment / NSF rate, and stable-employment percentage? A property-management company in the area should have these aggregated.
- How much new for-sale + rental construction is in the pipeline within 1–3 miles? Heavy new supply typically softens prices + rents 12–24 months out; constrained supply supports both.
Investment metrics
- 1% rule
- 0.94% ✗
- Cap rate
- 6.32%
- Cash-on-cash
- 0.09%
- DSCR
- 1.00
- GRM
- 8.9
CMA / ARV
No comps found within radius.
Projected returns pro-forma
-3.0% appreciation · 0.0% rent growth · sell at horizon
- IRR
- -19.8%
- Equity multiple
- 0.33×
- Total profit
- $-36,612
- Equity at exit
- $29,075
- IRR
- -21.6%
- Equity multiple
- 0.05×
- Total profit
- $-51,894
- Equity at exit
- $16,860
Cash invested: $54,600 (down + closing). Projections, not guarantees.
Landlord ↔ Tenant lean methodology
- Overall (STATE)
- 87 Strongly Landlord-Friendly
- State Florida
- 87 Strongly Landlord-Friendly · R+3
- County
- — inherits STATE
- City
- — inherits STATE
ZIP-level market 33033
- Home prices YoY
- -28.2%
- Rents YoY
- -2.9%
- Active inventory
- 619
- Price-to-rent
- 8.9×
Monthly cashflow live
- Estimated rent
- $1,826 high interval (Pro) →
- Mortgage (P&I)
- −$1,023
- Tax from tax record
- −$275 /mo · $3,295/yr
- Insurance
- −$81
- HOA
- −$60
- Vacancy / Maint / Mgmt
- −$383
- Net cashflow
- $4
Break-even live
Sensitivity live
| Price | -10% $114 | -5% $59 | +0% $4 | +5% $-51 | +10% $-106 |
|---|---|---|---|---|---|
| Rent | -10% $-140 | -5% $-68 | +0% $4 | +5% $76 | +10% $148 |
| Rate | -1.0pp $102 | -0.5pp $54 | base $4 | +0.5pp $-47 | +1.0pp $-98 |
UW: 25.0% down · 7.5% · 30yr · 1.5% tax · 5.0% vac · 8.0% maint · 8.0% mgmt
Financing live
Cash to close
- Down payment
- $48,750
- Closing costs
- $5,850
- Reserves months
- —
- Total cash needed
- —
Loan-product check · same deal, 3 products live
Conventional
25% down · 7.5% · 30yr
- Down + closing
- —
- Monthly P&I
- —
- Monthly cashflow
- —
- DSCR
- —
- Eligible?
- —
Personal DTI + credit; lowest rate.
DSCR
20% down · 8.5% · 30yr
- Down + closing
- —
- Monthly P&I
- —
- Monthly cashflow
- —
- DSCR
- —
- Eligible?
- —
No personal income docs; deal must DSCR.
Hard money
10% down · 12.0% · 12mo
- Down + closing
- —
- Monthly P&I
- —
- Monthly cashflow
- —
- DSCR
- —
- Eligible?
- —
Short-term bridge; refi at stabilization.
Rent comps 40 comps
| Address | Beds | Baths | Sqft | Rent | $/sqft | DOM | Units | Dist |
|---|---|---|---|---|---|---|---|---|
| 28147 SW 142nd Ct Homestead, FL | 2.0 | 1.5 | 920 | $1,950 | $2.12 | 26d | 1 | 0.06mi |
| 28055 SW 143rd Ct Homestead, FL | 2.0 | 1.5 | 920 | $1,800 | $1.96 | 26d | 1 | 0.08mi |
| 28214 SW 143rd Ct Homestead, FL | 2.0 | 1.5 | 920 | $1,800 | $1.96 | 17d | 1 | 0.17mi |
| 14570 SW 280th St Homestead, FL | 1.0–3.0 | 1.0–2.0 | 948 | $1,428 | $1.51 | 26d | 1 | 0.32mi |
| 14155 SW 288th St Homestead, FL | 1.0–3.0 | 1.0–2.0 | 829 | $1,710 | $2.06 | 0d | 22 | 0.35mi |
| 28150 SW 147th Ave Homestead, FL | 1.0 | 1.0 | 661 | $676 | $1.02 | 16d | 1 | 0.45mi |
| 28050 SW 147th Ave Homestead, FL | 2.0 | 2.0 | 914 | $1,750 | $1.91 | 26d | 9 | 0.46mi |
| 14820 Naranja Lakes Blvd Unit D2J Homestead, FL | 2.0 | 1.5 | 1075 | $1,600 | $1.49 | 17d | 1 | 0.70mi |
| 14820 Naranja Lakes Blvd Unit D3B Homestead, FL | 2.0 | 1.5 | 1075 | $1,600 | $1.49 | 26d | 1 | 0.70mi |
| 14820 Naranja Lakes Blvd Unit D2L Homestead, FL | 2.0 | 1.5 | 1075 | $1,650 | $1.53 | 14d | 1 | 0.70mi |
| 14820 Naranja Lakes Blvd Unit D2L Homestead, FL | 2.0 | 2.0 | 1075 | $1,650 | $1.53 | 9d | 1 | 0.70mi |
| 14830 Naranja Lakes Blvd Unit A3C Homestead, FL | 2.0 | 1.5 | 1075 | $1,700 | $1.58 | 26d | 1 | 0.70mi |
| 14830 Naranja Lakes Blvd Unit A2N Homestead, FL | 2.0 | 1.5 | 1075 | $1,650 | $1.53 | 26d | 1 | 0.70mi |
| 14840 Naranja Lakes Blvd Unit C2P Homestead, FL | 2.0 | 1.5 | 1075 | $2,100 | $1.95 | 6d | 1 | 0.70mi |
| 14840 Naranja Lakes Blvd Unit C3E Homestead, FL | 2.0 | 1.5 | 1075 | $1,950 | $1.81 | 26d | 1 | 0.70mi |
| 14840 Naranja Lakes Blvd Unit C4R Homestead, FL | 2.0 | 1.5 | 1075 | $1,695 | $1.58 | 26d | 1 | 0.70mi |
| 14840 Naranja Lakes Blvd Unit C4C Homestead, FL | 2.0 | 2.0 | 1075 | $1,600 | $1.49 | 26d | 1 | 0.70mi |
| 14840 Naranja Lakes Blvd Unit C3C Homestead, FL | 2.0 | 1.5 | 1075 | $1,575 | $1.47 | 26d | 1 | 0.70mi |
| 14840 Naranja Lakes Blvd Unit C4R Homestead, FL | 2.0 | 1.5 | 1075 | $1,595 | $1.48 | 4d | 1 | 0.70mi |
| 13628 SW 287th Ln Homestead, FL | 2.0 | 2.0 | 1011 | $2,250 | $2.23 | 20d | 1 | 0.74mi |
| 14850 Naranja Lakes Blvd Unit B3M Homestead, FL | 2.0 | 1.5 | 1075 | $1,600 | $1.49 | 26d | 1 | 0.75mi |
| 14850 Naranja Lakes Blvd Unit B2G Homestead, FL | 2.0 | 1.5 | 1075 | $1,995 | $1.86 | 26d | 1 | 0.75mi |
| 14850 Naranja Lakes Blvd Unit B3D Homestead, FL | 2.0 | 1.5 | 1075 | $1,995 | $1.86 | 9d | 1 | 0.75mi |
| 14850 Naranja Lakes Blvd Unit B2G Homestead, FL | 2.0 | 1.5 | 1075 | $1,895 | $1.76 | 9d | 1 | 0.75mi |
| 13720 SW 272nd St Homestead, FL | 1.0–3.0 | 1.0–2.0 | 988 | $1,749 | $1.77 | 0d | 52 | 0.75mi |
| 14981 SW 283rd St Homestead, FL | 1.0–2.0 | 1.0–2.0 | 843 | $1,931 | $2.29 | 0d | 17 | 0.77mi |
| 27077 S Dixie Hwy Homestead, FL | 1.0–2.0 | 1.0–2.0 | 823 | $1,999 | $2.43 | 0d | 11 | 0.82mi |
| 26711 SW 145th Avenue Rd Homestead, FL | 2.0 | 1.0 | 800 | $2,400 | $3.00 | 17d | 1 | 0.91mi |
| 26620 SW 138th Ct Unit B Homestead, FL | 1.0 | 1.0 | 987 | $2,000 | $2.03 | 5d | 1 | 0.99mi |
| 13651 SW 268th St Unit 8 Homestead, FL | 1.0 | 1.0 | 600 | $1,350 | $2.25 | 26d | 1 | 1.07mi |
| 26511 SW 146th Ct Homestead, FL | 2.0 | 1.0–2.0 | 835 | $1,850 | $2.22 | 7d | 3 | 1.07mi |
| 28152 SW 153rd Ave Unit 28152 Homestead, FL | 2.0 | 1.0 | 880 | $1,995 | $2.27 | 26d | 1 | 1.09mi |
| 26510 SW 138th Ave Unit A Naranja, FL | 2.0 | 1.0 | 966 | $1,575 | $1.63 | 9d | 1 | 1.11mi |
| 26510 SW 138th Ave Unit A Naranja, FL | 2.0 | 1.0 | 966 | $1,600 | $1.66 | 26d | 1 | 1.11mi |
| 13451 SW 268th St Homestead, FL | 2.0 | 1.0 | 700 | $2,100 | $3.00 | 26d | 1 | 1.14mi |
| 13451 SW 268th St Unit A Naranja, FL | 2.0 | 1.0 | 700 | $2,100 | $3.00 | 13d | 1 | 1.14mi |
| 14770 SW 264th St Homestead, FL | 2.0–4.0 | 2.0 | 1166 | $1,808 | $1.55 | 26d | 1 | 1.18mi |
| 14530 SW 261st St Unit 1 Princeton, FL | 1.0 | 1.0 | 700 | $1,900 | $2.71 | 9d | 1 | 1.20mi |
| 14530 SW 261st St Unit 1 Princeton, FL | 1.0 | 1.0 | 700 | $1,900 | $2.71 | 26d | 1 | 1.20mi |
| 15410 SW 284th St Homestead, FL | 2.0 | 2.0 | 900 | $1,850 | $2.06 | 9d | 2 | 1.24mi |
HOA detail
- Monthly dues
- $60 · $720/yr
Listing history 17 events
-
2026-06-22days on market $195,000 Active 376 DOM
-
2026-06-18days on market $195,000 Active 373 DOM
-
2026-06-17days on market $195,000 Active 372 DOM
-
2026-06-16days on market $195,000 Active 371 DOM
-
2026-06-15days on market $195,000 Active 370 DOM
-
2026-06-13days on market $195,000 Active 368 DOM
-
2026-06-09days on market $195,000 Active 364 DOM
-
2026-06-08days on market $195,000 Active 363 DOM
-
2026-06-08days on market $195,000 Active 362 DOM
-
2026-06-04days on market $195,000 Active 359 DOM
-
2026-06-03days on market $195,000 Active 358 DOM
-
2026-06-02days on market $195,000 Active 357 DOM
-
2026-06-01days on market $195,000 Active 356 DOM
-
2026-05-31days on market $195,000 Active 355 DOM
-
2025-06-10$195,000 Active
-
1996-04-15soldstatus $22,000
-
1978-09-01soldstatus $19,500
ⓘ Source: listings_history table (triggers on properties + properties_extension) + one-shot
backfill from property_details.listing_events for pre-trigger history.
Tax reassessment forecast FL · Resets to sale price
- Current annual tax
- $3,295 · $275/mo
- Projected year-2 tax
- $3,295 · $275/mo
- Expected delta
- $0/yr ($0/mo · 0.0%)
ⓘ Screening estimate from a state-policy table — verify with the county assessor before closing.
Climate risk First Street
- Flood 5/10 Major FEMA zone X (unshaded) · 24% chance over 30 yrs
- Wildfire 1/10 Low
- Heat 10/10 Extreme 6 d/yr ≥105°F today · 27 d/yr by 30 yrs out
- Wind 10/10 Extreme 99% chance of damaging wind over 30 yrs
- Air quality 2/10 Low 1 unhealthy d/yr today · 1 by 30 yrs out
Nearby sold comps map
Loading sold comps map…
Walkable amenities ~0.75 mi
Loading nearby amenities…
Taxation est. · year 1
- Rental income
- $21,910
- − Mortgage interest
- −$10,923
- − Property taxes
- −$3,295
- − Insurance
- −$975
- − Repairs & maintenance
- −$1,753
- − Management
- −$1,753
- − HOA
- −$720
- − Depreciation
- −$5,673
- Taxable loss
- −$3,181
- Est. tax savings @ 24.0%
- +$764
- After-tax cash flow
- $811/yr
For passive investors: Depreciation is non-cash, so a rental often shows a tax loss while cash-flowing — sheltering income. Rental losses are passive: they offset passive income freely, and up to $25,000/yr can offset ordinary (W-2) income if you actively participate and your MAGI is under $100k (phasing out to $0 by $150k); unused losses carry forward. On sale, claimed depreciation is recaptured at up to 25%, and gains may owe capital-gains tax (a 1031 exchange can defer both). Figures are a year-1 estimate at your 24.0% rate — not tax advice; consult a CPA.
Schools (NCES district)
- District
- Miami-Dade
- NCES district ID
- 1200390
- Math proficiency
- 45% ▼ -16.00%
- Reading proficiency
- 54% ▼ -5.00%
- Median HH income
- $43,928
- Composite
- 41.76/100
- National rank
- #3397
- State rank
- #40 of 73 in FL
Livability — Leisure City
- Score
- 65/100
- State rank
- #639
- US rank
- #12574
Category grades
Schools grade is shown separately in the Schools card above.
Census & demographics
- Census place
- Leisure City, FL
- County
- Miami-Dade County · 2,697,751 people
- Metro
- Miami-Fort Lauderdale-Pompano Beach, FL
- Population (ZIP)
- 71,458
- Household income
- $69,635
- Rent vs Own
- Severe rent burden
- 3426.0
Population outlook (Miami-Dade County) Hauer SSP2
- Today (2025)
- 3,126,439 people
- By 2030
- 3,325,765 · +6.4%
- By 2040
- 3,697,561 · +18.3%
- By 2050
- 4,012,134 · +28.3%
- By 2075
- 4,605,612 · +47.3%
- By 2100
- 4,866,598 · +55.7%
Race, ethnicity, and origin ACS 2023
- Neighborhood character
- Predominantly Hispanic (71%)
- Race & ethnicity
- Hispanic / Latino 71% Two or more races 28% Black 18% White 9%
- Hispanic origin (detail)
- Mexican 13% Puerto Rican 6% Cuban 28% Dominican 3%
- Common ancestry
- Hispanic 3% Lithuanian 2% Russian 1%
- Foreign-born
- 40% · Canada, Jamaica
- Languages at home
- 32% English-only · Spanish 63% French/Haitian/Cajun 4% Other Indo-European 1%
Political lean MEDSL · Miami-Dade
- 2024 margin
- R (+11.4) · D 43.9% · R 55.4%
- 2008→2024 swing
- -27.6pp toward R · 2008: 16.1pp · 2024: -11.4pp
- All cycles
- 2024: R+11.4 2020: D+7.3 2016: D+29.6 2012: D+23.7 2008: D+16.1
Not yet ingested
- Civics
- —
Market trends
- HPI YoY
- ▼ -179.13%
- Current HPI
- 456.2679
- Rent YoY
- ▼ -2.93%
- Metro
- Miami-Fort Lauderdale-Pompano Beach, FL
- State GDP YoY
- ▲ 3.28%
- F500 in state
- 36
Industry mix (Fortune 500 HQ in FL)
| Industry | F500 HQs | Revenue |
|---|---|---|
| Industrial Technology | 2 | $29B |
|
||
| Insurance | 2 | $17B |
|
||
| Retail | 1 | $60B |
|
||
| Technology Distribution | 1 | $58B |
|
||
| Homebuilding | 1 | $35B |
|
||
| Technology Manufacturing | 1 | $35B |
|
||
Price history
+900.0% since first listed3 events — show timeline
- 2025-06-10 Listed $195,000 MARMLS
- 1996-04-15 Sold (Public Records) $22,000 Public Records
- 1978-09-01 Sold (Public Records) $19,500 Public Records
Property tax history
+14.6%/yrLatest (2025): $3,295 · +5.6% YoY. Source: county tax records.
Cash-flow waterfall
monthlySold comps — $/sqft
last 12 mo · ≤1 miLoading sold comps…