 Multi-family
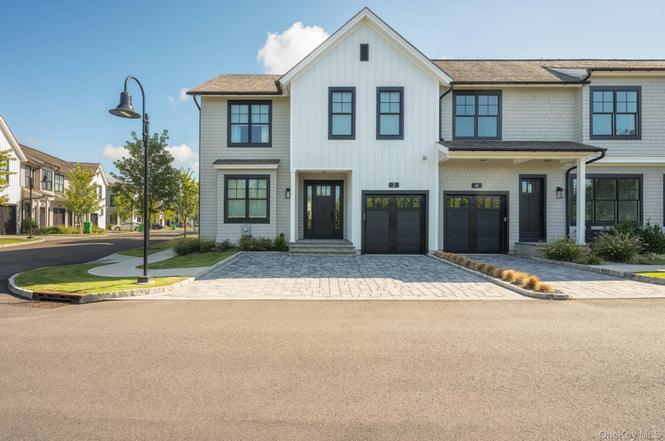
2 Hickory Ln · Water Mill, NY
Flood risk No data
- FEMA flood zone
- —
- Chance of flooding over 30 yrs
- —
- Est. flood insurance / yr
- —
Fire risk No data
- Est. fire insurance / yr
- —
Heat risk No data
- Hot days now (above threshold)
- —
- Hot days in 30 yrs
- —
Wind risk No data
- Chance of severe wind over 30 yrs
- —
Air-quality risk No data
- Unhealthy air days now
- —
- Unhealthy air days in 30 yrs
- —
Risk factors via First Street. Map © Google.
Why this score? — see what drove the A- grade
The composite is a weighted blend of 9 inputs, each scored 0–100. Each bar is that input's sub-score; the figure is the points it added to the 100-point composite (weight × sub-score).
- Cash flow +30.0/30.0
- 1% rule +10.0/10.0
- DSCR +10.0/10.0
- Appreciation +9.3/10.0
- ARV discount +7.5/15.0
- Rent growth +5.0/5.0
- Schools +4.8/10.0
- Livability +3.6/5.0
- Condition / age +2.5/5.0
$2,995,000
🖨 Deal sheet (PDF) 📄 Offer letter ✓ Due diligence
Multi-family units
County records classify this as Multi-Family (5+ Unit). Listing-text estimate: 1 unit. estimate disagrees with records
5+ unit building — per-unit beds/baths from public records are typically unavailable; the breakdown below (if shown) is an estimate from the listing text.
Listing remarks
Discover an oasis of refined summer living in the heart of Watermill Crossing - a townhome where modern sophistication meets resort-style comfort. Spanning approximately 3,402 square feet over three meticulously designed levels, this compelling retreat offers an unparalleled escape masterfully designed by McDonough & Conroy with interiors from Mabley Handler. On the main level, 1,154 square feet of luminous living space greet you with an inviting foyer, a light filled great room with a natural gas fireplace, and a custom Italian kitchen by Spectrum. Crafted with white high-gloss cabinetry, a grey perused island, quartz countertops, Sub-Zero/Bosch appliances, a Wolf gas range, and an u
Key facts
- Bluestone patio
- Fully equipped gym
- 1,331 sq ft lot
Tags
Neighborhood map
What this means for you Summary
Snapshot
- This is a 4-bed/4.0-bath multifamily listed at $3.00M.
Deal economics
- At list price, monthly cash flow is $21k ($247k/yr) — positive.
- The deal already cash-flows at list — no discount required.
- Meets the 1% rule at list price ($52k rent vs $3.00M).
- Recommended offer: $2.95M (1.5% below list) — sets the bar for market timing.
- Cap rate 14.5% vs local median 10.6% in Water Mill — top-decile yield for the area; either an underpriced asset or a hidden risk that comps aren't pricing in. Stress-test before assuming the spread holds.
Location & tenants
- Location reads 71/100 on livability (#410 in NY) — a middle-class / working-renter tenant base. Strengths: crime A+, employment A+, commute A-; Watch: amenities F, cost of living F, housing F.
- Southampton Union Free School District (suburban): math 53% / reading 51% proficiency, ranked #293 of 590 in NY (top 50%) — acceptable for families but not a draw, mixed tenant base, ~2y average lease.
- Zoned schools: Southampton Elementary School (math 42% / reading 57%, grade D, #1,085 of 2,108 statewide, top 56%, 376 students, 51% FRL); Southampton Intermediate School (math 30% / reading 47%, grade F, #437 of 729 statewide, top 60%, 363 students, 44% FRL); Southampton High School (math 98%, 595 students, 48% FRL) — zoned schools average 48% FRL vs 30% district-wide (17 pts higher); higher-poverty schools than district average — tighter screening recommended.
- Market conditions: Rents rising fast (+30.1%/yr); 52 active listings in the ZIP; 3 comparable units currently listed for rent nearby; rentals lingering (median 44d on market — plan ~5-8 weeks vacancy on turnover, expect pricing pressure); 67% of comp listings sitting > 30 days — soft ceiling on asking rent; high-income renter base; 1,366 units permitted in Suffolk County in 2024 (216 in 5+ unit buildings).
- At $52,266/mo this rent would consume 348% of the median local household income ($180k/yr) — very limited rent-growth headroom before tenants either downsize or default.
Forward outlook
- In year one you build about $279k of equity ($21k loan paydown + $258k appreciation (8.6% local appreciation)).
- Suffolk County population projected to shrink 5% by 2050 — rents likely to lag national; underwrite the cash flow, not the appreciation.
- At projected returns (8.6% appreciation + 8.0% rent growth), your $839k cash investment doubles in ~2 years — after that, you're playing with house money.
- By year 2, paydown + projected appreciation supports a ~$447k cash-out refi (75% LTV) — recoverable capital for the next deal without selling this one.
Negotiation context
- It's been on market 27 days — a 2% lower offer ($2.95M) is reasonable based on typical stale-listing flexibility.
- Current owner paid $2.27M; 32% above their basis — modest negotiation headroom, anchor on the comps not their cost.
Questions for the listing agent
- Is there a deadline driving the sale (1031 exchange, divorce, estate, relocation)? That informs how much negotiation room exists.
- What's the average days-on-market for RENTAL listings here right now (not sales)? A rising rental-DOM trend means longer vacancies and softer asking-rent achievability than the comps imply.
- What's the recent tenant-quality profile in this submarket — average credit score on applications, eviction rate, late-payment / NSF rate, and stable-employment percentage? A property-management company in the area should have these aggregated.
- How much new apartment / multifamily construction is in the pipeline within 1–3 miles? Heavy new supply (>2% of stock underway) typically softens rents 12–24 months out; light construction supports rent growth.
Investment metrics
- 1% rule
- 1.75% ✓
- Cap rate
- 14.54%
- Cash-on-cash
- 29.47%
- DSCR
- 2.31
- GRM
- 4.8
CMA / ARV
No comps found within radius.
Projected returns pro-forma
8.63% appreciation · 8.0% rent growth · sell at horizon
- IRR
- 47.8%
- Equity multiple
- 4.51×
- Total profit
- $2,944,311
- Equity at exit
- $2,405,152
- IRR
- 44.8%
- Equity multiple
- 10.87×
- Total profit
- $8,275,846
- Equity at exit
- $4,903,587
Cash invested: $838,600 (down + closing). Projections, not guarantees.
Landlord ↔ Tenant lean methodology
- Overall (STATE)
- 15 Strongly Tenant-Friendly
- State New York
- 15 Strongly Tenant-Friendly · D+10
- County
- — inherits STATE
- City
- — inherits STATE
ZIP-level market 11976
- Home prices YoY
- 1.6%
- Rents YoY
- 30.1%
- Active inventory
- 52
- Price-to-rent
- 4.8×
Monthly cashflow live
- Estimated rent
- $52,266 medium interval (Pro) →
- Mortgage (P&I)
- −$15,706
- Tax est. 1.5%
- −$3,744 /mo · $44,925/yr
- Insurance
- −$1,248
- HOA
- −$0
- Vacancy / Maint / Mgmt
- −$10,976
- Net cashflow
- $20,593
Break-even live
Sensitivity live
| Price | -10% $22,662 | -5% $21,627 | +0% $20,593 | +5% $19,558 | +10% $18,523 |
|---|---|---|---|---|---|
| Rent | -10% $16,464 | -5% $18,528 | +0% $20,593 | +5% $22,657 | +10% $24,722 |
| Rate | -1.0pp $22,101 | -0.5pp $21,354 | base $20,593 | +0.5pp $19,817 | +1.0pp $19,027 |
UW: 25.0% down · 7.5% · 30yr · 1.5% tax · 5.0% vac · 8.0% maint · 8.0% mgmt
Financing live
Cash to close
- Down payment
- $748,750
- Closing costs
- $89,850
- Reserves months
- —
- Total cash needed
- —
Loan-product check · same deal, 3 products live
Conventional
25% down · 7.5% · 30yr
- Down + closing
- —
- Monthly P&I
- —
- Monthly cashflow
- —
- DSCR
- —
- Eligible?
- —
Personal DTI + credit; lowest rate.
DSCR
20% down · 8.5% · 30yr
- Down + closing
- —
- Monthly P&I
- —
- Monthly cashflow
- —
- DSCR
- —
- Eligible?
- —
No personal income docs; deal must DSCR.
Hard money
10% down · 12.0% · 12mo
- Down + closing
- —
- Monthly P&I
- —
- Monthly cashflow
- —
- DSCR
- —
- Eligible?
- —
Short-term bridge; refi at stabilization.
Rent comps 3 comps
| Address | Beds | Baths | Sqft | Rent | $/sqft | DOM | Units | Dist |
|---|---|---|---|---|---|---|---|---|
| 64 Water Mill Towd Rd Water Mill, NY | 4.0 | 4.0 | 3800 | $55,000 | $14.47 | 44d | 1 | 0.88mi |
| 6 Millfarm Ln Southampton, NY | 4.0 | 4.5 | 2648 | $50,000 | $18.88 | 44d | 1 | 1.26mi |
| 20 Millfarm Ln Southampton, NY | 5.0 | 5.5 | 4500 | $25,000 | $5.56 | 11d | 1 | 1.43mi |
Listing history 3 events
-
2025-10-03status Pending
-
2025-09-06$2,995,000 Active
-
2025-06-30soldstatus $2,265,000
ⓘ Source: listings_history table (triggers on properties + properties_extension) + one-shot
backfill from property_details.listing_events for pre-trigger history.
Nearby sold comps map
Loading sold comps map…
Walkable amenities ~0.75 mi
Loading nearby amenities…
Taxation est. · year 1
- Rental income
- $627,196
- − Mortgage interest
- −$167,767
- − Property taxes
- −$44,925
- − Insurance
- −$14,975
- − Repairs & maintenance
- −$50,176
- − Management
- −$50,176
- − Depreciation
- −$87,127
- Taxable income
- $212,050
- Est. tax owed @ 24.0%
- −$50,892
- After-tax cash flow
- $196,219/yr
For passive investors: Depreciation is non-cash, so a rental often shows a tax loss while cash-flowing — sheltering income. Rental losses are passive: they offset passive income freely, and up to $25,000/yr can offset ordinary (W-2) income if you actively participate and your MAGI is under $100k (phasing out to $0 by $150k); unused losses carry forward. On sale, claimed depreciation is recaptured at up to 25%, and gains may owe capital-gains tax (a 1031 exchange can defer both). Figures are a year-1 estimate at your 24.0% rate — not tax advice; consult a CPA.
Schools (NCES district)
- District
- Southampton Union Free School District
- NCES district ID
- 3627540
- Math proficiency
- 53% ▬ 0.00%
- Reading proficiency
- 51% ▲ 4.00%
- Median HH income
- $85,977
- Composite
- 47.9/100
- National rank
- #2213
- State rank
- #293 of 590 in NY
Livability — Water Mill
- Score
- 71/100
- State rank
- #410
- US rank
- #7088
Category grades
Schools grade is shown separately in the Schools card above.
Census & demographics
- Census place
- Water Mill, NY
- County
- Suffolk County · 679,920 people
- City population
- 2,952
- Metro
- New York-Newark-Jersey City, NY-NJ-PA
- Population (ZIP)
- 2,952
- Household income
- $180,250
- Rent vs Own
Population outlook (Suffolk County) Hauer SSP2
- Today (2025)
- 1,505,262 people
- By 2030
- 1,498,318 · -0.5%
- By 2040
- 1,471,101 · -2.3%
- By 2050
- 1,424,848 · -5.3%
- By 2075
- 1,337,157 · -11.2%
- By 2100
- 1,217,720 · -19.1%
Race, ethnicity, and origin ACS 2023
- Neighborhood character
- Predominantly White (87%)
- Race & ethnicity
- White 87% Hispanic / Latino 9% Two or more races 9% Asian 2%
- Hispanic origin (detail)
- Mexican 1% Salvadoran 2%
- Common ancestry
- Romanian 16% Scotch-Irish 7% Italian 3%
- Foreign-born
- 11% · Canada, China
- Languages at home
- 86% English-only · Spanish 7% Other Indo-European 4% German/W. Germanic 1%
Political lean MEDSL · Suffolk
- 2024 margin
- Lean R (+10.0) · D 45.0% · R 55.0%
- 2008→2024 swing
- -16.0pp toward R · 2008: 6.0pp · 2024: -10.0pp
- All cycles
- 2024: R+10.0 2020: R+0.0 2016: R+8.2 2012: D+2.9 2008: D+6.0
Not yet ingested
- Civics
- —
Market trends
- HPI YoY
- ▲ 8.63%
- Current HPI
- 540.0967
- Rent YoY
- ▲ 30.05%
- Metro
- New York-Newark-Jersey City, NY-NJ-PA
- State GDP YoY
- ▲ 2.60%
- F500 in state
- 92
Industry mix (Fortune 500 HQ in NY)
| Industry | F500 HQs | Revenue |
|---|---|---|
| Financial Services | 10 | $950B |
|
||
| Consumer Goods | 9 | $162B |
|
||
| Insurance | 4 | $225B |
|
||
| Telecommunications | 2 | $144B |
|
||
| Pharmaceuticals | 2 | $112B |
|
||
| Media / Entertainment | 2 | $69B |
|
||
Price history
+32.2% since first listed3 events — show timeline
- 2025-10-03 Pending — OneKey® MLS as Distributed by MLS Grid
- 2025-09-06 Listed $2,995,000 OneKey® MLS as Distributed by MLS Grid
- 2025-06-30 Sold (Public Records) $2,265,000 Public Records
Cash-flow waterfall
monthlySold comps — $/sqft
last 12 mo · ≤1 miLoading sold comps…