3343 Oscar Rivette St · Leonville, LA
Flood risk 1/10 · Minimal
- FEMA flood zone
- X
- Chance of flooding over 30 yrs
- 0.0%
- Est. flood insurance / yr
- $507 – $1,088
Fire risk 3/10 · Minor
- Est. fire insurance / yr
- $1,269 – $2,357
Heat risk 8/10 · Major
- Hot days now (above 111°F)
- 7 days/yr
- Hot days in 30 yrs
- 20 days/yr
Wind risk 9/10 · Severe
- Chance of severe wind over 30 yrs
- 99.0%
Air-quality risk 2/10 · Minimal
- Unhealthy air days now
- 0 days/yr
- Unhealthy air days in 30 yrs
- 1 days/yr
Risk factors via First Street. Map © Google.
Why this score? — see what drove the B- grade
The composite is a weighted blend of 9 inputs, each scored 0–100. Each bar is that input's sub-score; the figure is the points it added to the 100-point composite (weight × sub-score).
- Cash flow +30.0/30.0
- 1% rule +10.0/10.0
- DSCR +10.0/10.0
- ARV discount +7.5/15.0
- Livability +3.3/5.0
- Rent growth +2.5/5.0
- Condition / age +2.5/5.0
- Schools +2.2/10.0
- Appreciation +0.0/10.0
$64,000
🖨 Deal sheet 📄 Offer letter ✓ Due diligence
Listing remarks
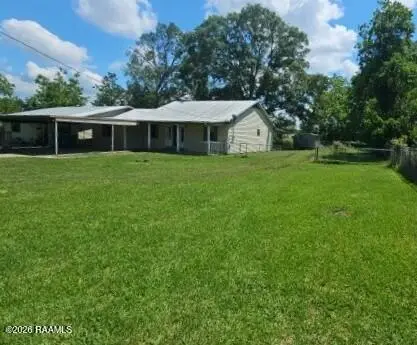
Spacious single-family home with approximately 1,700 sq ft of well-designed living space. This inviting home features a covered front porch, rear covered patio, 2-car carport, and a large backyard for outdoor living. Step inside to a bright and spacious living room that connects to the dining area and eat-in kitchen, complete with abundant cabinet storage and ample counter space. All 3 bedrooms are generously sized with their own closets. Convenient layout, great living areas, and endless potential make this property a must-see. Schedule your private showing today!
Key facts
- Covered front porch
- Large backyard
- Dining area
Tags
Property features AI
Exterior
- Parking: Carport with 2 spaces; 2 total parking spaces (covered)
- Utilities: Public sewer; Electric service by Entergy
- Home design: Single family residence
- Construction: Vinyl siding; Frame construction
- Exterior features: Chain link fencing; Covered porch; Exterior lighting; Storage shed(s)
Interior
- Flooring: Laminate flooring; Vinyl plank flooring; Wood laminate flooring
- Bathrooms: 2 full bathrooms
- Heating & cooling: Central heating; Central air conditioning
- Interior features: Built-in features; Solid surface counters; Lighting (interior)
Neighborhood map
What this means for you Summary
Snapshot
- This is a 3-bed/2.0-bath single-family listed at $64k.
Deal economics
- At list price, monthly cash flow is $913 ($11k/yr) — positive.
- The deal already cash-flows at list — no discount required.
- Meets the 1% rule at list price ($2k rent vs $64k).
- Recommended offer: $63k (1.5% below list) — sets the bar for market timing.
Location & tenants
- Location reads 66/100 on livability (#126 in LA) — a middle-class / working-renter tenant base. Strengths: cost of living A+, housing A+, crime B; Watch: employment C-, amenities F, commute F.
- St. Landry Parish (town): math 20% / reading 33% proficiency, ranked #54 of 98 in LA (top 55%) — low school quality limits family demand, transient renter base, plan for 1-2y turnover; 73% free/reduced lunch — lower-income household profile, screen leases tightly.
- Zoned schools: Leonville Elementary School (math 29% / reading 49%, grade F, #238 of 646 statewide, top 37%, 636 students, 62% FRL).
- Zoned-school proficiency averages 39% at this address vs 26% district-wide (+12 pts) — the actual schools serving this property are materially stronger than the St. Landry Parish average implies; a family-tenant draw the district grade alone would hide.
- Market conditions: 65 active listings in the ZIP; 142 units permitted in St. Landry Parish in 2024 (0 in 5+ unit buildings).
Forward outlook
- Local home prices are declining (-3.0%/yr); year-one equity from $442 of loan paydown is wiped out by about $2k of value loss. Plan a longer hold.
- St. Landry County population projected to shrink 9% by 2050 — rents likely to lag national; underwrite the cash flow, not the appreciation.
- At projected returns (-3.0% appreciation + 3.0% rent growth), your $18k cash investment doubles in ~2 years — after that, you're playing with house money.
Negotiation context
- It's been on market 29 days — a 2% lower offer ($63k) is reasonable based on typical stale-listing flexibility.
Risks & watch-outs
- Climate carrying-cost: severe wind risk, 99% chance of damaging wind over 30y; extreme-heat days projected 7→20/yr by 2055 (HVAC capex compounding) — expect insurance premiums to compound above CPI over the hold.
Questions for the listing agent
- Is there a deadline driving the sale (1031 exchange, divorce, estate, relocation)? That informs how much negotiation room exists.
- Schools are B-rated — typically a magnet for longer-tenancy family renters. What's the average tenant stay here, and is there a school-zone premium baked into asking?
- What's the average days-on-market for RENTAL listings here right now (not sales)? A rising rental-DOM trend means longer vacancies and softer asking-rent achievability than the comps imply.
- What's the recent tenant-quality profile in this submarket — average credit score on applications, eviction rate, late-payment / NSF rate, and stable-employment percentage? A property-management company in the area should have these aggregated.
- How much new for-sale + rental construction is in the pipeline within 1–3 miles? Heavy new supply typically softens prices + rents 12–24 months out; constrained supply supports both.
Investment metrics
- 1% rule
- 2.60% ✓
- Cap rate
- 23.41%
- Cash-on-cash
- 61.15%
- DSCR
- 3.72
- GRM
- 3.2
CMA / ARV
- ARV (on-the-fly)
- $169,680
- Comps found
- 2
Show comp detail 2 sales within ~0.75 mi
| Address | Dist | Beds/Ba | Sqft | Sold | Price | $/sf | Match |
|---|---|---|---|---|---|---|---|
| 3203 Oscar Rivette Rd | 0.26mi | 3/2.0 | 1,650 (-2%) | 23mo | $87,500 | $53 | 66 |
| 140 Saint Leo St | 0.35mi | 3/2.0 | 1,873 (+12%) | 7mo | $190,000 | $101 | 59 |
Match score weights: distance 35% · size 25% · config 20% · recency 20%. Top-matched comps best support the ARV.
Projected returns pro-forma
-3.0% appreciation · 3.0% rent growth · sell at horizon
- IRR
- 60.0%
- Equity multiple
- 3.67×
- Total profit
- $47,787
- Equity at exit
- $9,543
- IRR
- 64.7%
- Equity multiple
- 7.50×
- Total profit
- $116,502
- Equity at exit
- $5,534
Cash invested: $17,920 (down + closing). Projections, not guarantees.
Landlord ↔ Tenant lean methodology
- Overall (STATE)
- 90 Strongly Landlord-Friendly
- State Louisiana
- 90 Strongly Landlord-Friendly · R+12
- County
- — inherits STATE
- City
- — inherits STATE
ZIP-level market 70512
- Home prices YoY
- -28.6%
- Active inventory
- 65
- Price-to-rent
- 3.2×
Monthly cashflow live
- Estimated rent
- $1,665 medium interval (Pro) →
- Mortgage (P&I)
- −$336
- Tax from tax record
- −$40 /mo · $483/yr
- Insurance
- −$27
- HOA
- −$0
- Vacancy / Maint / Mgmt
- −$350
- Net cashflow
- $913
Break-even live
UW: 25.0% down · 7.5% · 30yr · 1.5% tax · 5.0% vac · 8.0% maint · 8.0% mgmt
Financing live
Cash to close
- Down payment
- $16,000
- Closing costs
- $1,920
- Reserves months
- —
- Total cash needed
- —
Loan-product check · same deal, 3 products live
Conventional
25% down · 7.5% · 30yr
- Down + closing
- —
- Monthly P&I
- —
- Monthly cashflow
- —
- DSCR
- —
- Eligible?
- —
Personal DTI + credit; lowest rate.
DSCR
20% down · 8.5% · 30yr
- Down + closing
- —
- Monthly P&I
- —
- Monthly cashflow
- —
- DSCR
- —
- Eligible?
- —
No personal income docs; deal must DSCR.
Hard money
10% down · 12.0% · 12mo
- Down + closing
- —
- Monthly P&I
- —
- Monthly cashflow
- —
- DSCR
- —
- Eligible?
- —
Short-term bridge; refi at stabilization.
Listing history 18 events
-
2026-06-18days on market $64,000 Active 29 DOM
-
2026-06-17days on market $64,000 Active 28 DOM
-
2026-06-16days on market $64,000 Active 27 DOM
-
2026-06-15days on market $64,000 Active 26 DOM
-
2026-06-13days on market $64,000 Active 24 DOM
-
2026-06-12days on market $64,000 Active 23 DOM
-
2026-06-09days on market $64,000 Active 20 DOM
-
2026-06-08days on market $64,000 Active 19 DOM
-
2026-06-07days on market $64,000 Active 18 DOM
-
2026-06-07days on market $64,000 Active 17 DOM
-
2026-06-04days on market $64,000 Active 14 DOM
-
2026-06-02days on market $64,000 Active 13 DOM
-
2026-06-01days on market $64,000 Active 12 DOM
-
2026-05-31days on market $64,000 Active 11 DOM
-
2026-05-31days on market $64,000 Active 10 DOM
-
2026-05-20$64,000 Active
-
2021-05-26soldstatus $95,000
-
2006-03-15soldstatus $67,000
ⓘ Source: listings_history table (triggers on properties + properties_extension) + one-shot
backfill from property_details.listing_events for pre-trigger history.
Tax reassessment forecast LA · Resets to sale price
- Current annual tax
- $483 · $40/mo
- Projected year-2 tax
- $483 · $40/mo
- Expected delta
- $0/yr ($0/mo · 0.0%)
ⓘ Screening estimate from a state-policy table — verify with the county assessor before closing.
Climate risk First Street
- Flood 1/10 Low FEMA zone X · 0% chance over 30 yrs
- Wildfire 3/10 Moderate
- Heat 8/10 Severe 7 d/yr ≥111°F today · 20 d/yr by 30 yrs out
- Wind 9/10 Extreme 99% chance of damaging wind over 30 yrs
- Air quality 2/10 Low 0 unhealthy d/yr today · 1 by 30 yrs out
Nearby sold comps map
Loading sold comps map…
Walkable amenities ~0.75 mi
Loading nearby amenities…
Taxation est. · year 1
- Rental income
- $19,985
- − Mortgage interest
- −$3,585
- − Property taxes
- −$483
- − Insurance
- −$320
- − Repairs & maintenance
- −$1,599
- − Management
- −$1,599
- − Depreciation
- −$1,862
- Taxable income
- $10,537
- Est. tax owed @ 24.0%
- −$2,529
- After-tax cash flow
- $8,428/yr
For passive investors: Depreciation is non-cash, so a rental often shows a tax loss while cash-flowing — sheltering income. Rental losses are passive: they offset passive income freely, and up to $25,000/yr can offset ordinary (W-2) income if you actively participate and your MAGI is under $100k (phasing out to $0 by $150k); unused losses carry forward. On sale, claimed depreciation is recaptured at up to 25%, and gains may owe capital-gains tax (a 1031 exchange can defer both). Figures are a year-1 estimate at your 24.0% rate — not tax advice; consult a CPA.
Schools (NCES district)
- District
- St. Landry Parish
- NCES district ID
- 2201560
- Math proficiency
- 20% ▼ -43.00%
- Reading proficiency
- 33% ▼ -35.00%
- Median HH income
- $32,635
- Composite
- 21.59/100
- National rank
- #8303
- State rank
- #54 of 98 in LA
Livability — Leonville
- Score
- 66/100
- State rank
- #126
- US rank
- #11747
Category grades
Schools grade is shown separately in the Schools card above.
Census & demographics
- Census place
- Leonville, LA
- City population
- 1,030
- Population (ZIP)
- 10,703
Population outlook (St. Landry County) Hauer SSP2
- Today (2025)
- 83,114 people
- By 2030
- 82,110 · -1.2%
- By 2040
- 79,445 · -4.4%
- By 2050
- 75,855 · -8.7%
- By 2075
- 65,684 · -21.0%
- By 2100
- 51,739 · -37.7%
Race, ethnicity, and origin ACS 2023
- Neighborhood character
- Predominantly White (75%)
- Race & ethnicity
- White 75% Black 21% Hispanic / Latino 2% Two or more races 2%
- Common ancestry
- Lithuanian 21% Iranian 1% Italian 1%
- Foreign-born
- 1% · Canada
- Languages at home
- 88% English-only · French/Haitian/Cajun 10% Spanish 2%
Political lean MEDSL · St. Landry
- 2024 margin
- R (+18.8) · D 40.0% · R 58.9% · Other 1.1%
- 2008→2024 swing
- -15.6pp toward R · 2008: -3.2pp · 2024: -18.8pp
- All cycles
- 2024: R+18.8 2020: R+14.1 2016: R+11.9 2012: R+4.3 2008: R+3.2
Not yet ingested
- Civics
- —
Market trends
- HPI YoY
- ▼ -53.35%
- Current HPI
- 132.9236
- Rent YoY
- —
- Metro
- —
- State GDP YoY
- ▲ 3.29%
- F500 in state
- 10
Industry mix (Fortune 500 HQ in LA)
| Industry | F500 HQs | Revenue |
|---|---|---|
| Telecommunications | 2 | $23B |
|
||
| Utilities | 1 | $12B |
|
||
| Wholesale / Distribution | 1 | $5B |
|
||
| Advertising | 1 | $2B |
|
||
Price history
-4.5% since first listed3 events — show timeline
- 2026-05-20 Listed $64,000 AcadianaMLS
- 2021-05-26 Sold (Public Records) $95,000 Public Records
- 2006-03-15 Sold (Public Records) $67,000 Public Records
Property tax history
+1.3%/yrLatest (2025): $483 · +0.0% YoY. Source: county tax records.
Cash-flow waterfall
monthlySold comps — $/sqft
last 12 mo · ≤1 miLoading sold comps…