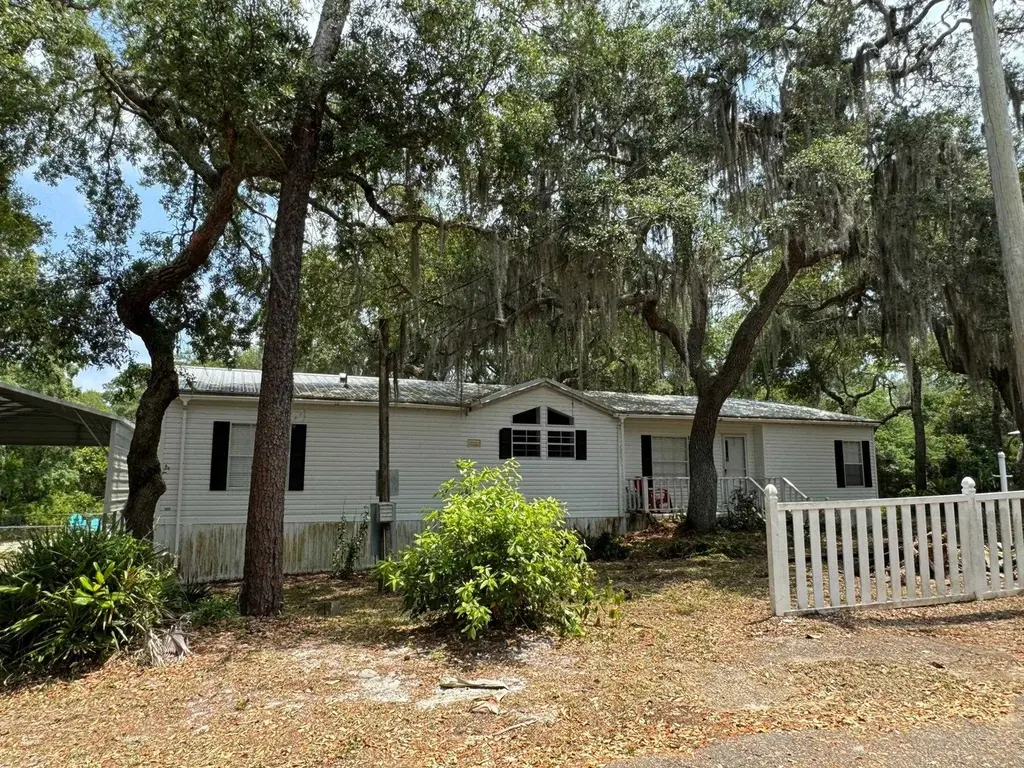
657 Pine St · Panacea, FL
Flood risk 8/10 · Major
- FEMA flood zone
- X (shaded)
- Chance of flooding over 30 yrs
- 0.96%
- Est. flood insurance / yr
- $507 – $1,088
Fire risk 5/10 · Moderate
- Est. fire insurance / yr
- $947 – $1,759
Heat risk 10/10 · Severe
- Hot days now (above 109°F)
- 7 days/yr
- Hot days in 30 yrs
- 22 days/yr
Wind risk 10/10 · Severe
- Chance of severe wind over 30 yrs
- 99.0%
Air-quality risk 2/10 · Minimal
- Unhealthy air days now
- 0 days/yr
- Unhealthy air days in 30 yrs
- 1 days/yr
Risk factors via First Street. Map © Google.
Why this score? — see what drove the D grade
The composite is a weighted blend of 9 inputs, each scored 0–100. Each bar is that input's sub-score; the figure is the points it added to the 100-point composite (weight × sub-score).
- Appreciation +10.0/10.0
- Cash flow +9.9/30.0
- ARV discount +7.5/15.0
- Schools +3.0/10.0
- Livability +3.0/5.0
- DSCR +2.8/10.0
- Rent growth +2.5/5.0
- Condition / age +2.5/5.0
- 1% rule +2.0/10.0
$299,000
🖨 Deal sheet (PDF) 📄 Offer letter ✓ Due diligence
Listing remarks MLS
For Sold/Comp purpose
Key facts
- Private pool
- Scenic hiking trails
- Double lot
Tags
Property features AI
Finance
- Financial info: Property is for sale
Exterior
- Parking: Carport with space for one vehicle
- Utilities: Septic tank (sewer)
- Home design: Single-story; Double-wide mobile home; Crawlspace foundation
- Construction: In-ground private pool
- Exterior features: Covered patio/porch; Deck; Porch; Partial privacy fencing; Property has a view
Interior
- Kitchen: Oven; Range; Microwave; Refrigerator
- Bedrooms: Bedroom 2 (11x13); Bedroom 3 (10x11); Additional room 13x13
- Flooring: Plank; Tile; Vinyl
- Bathrooms: 2 full bathrooms
- Heating & cooling: Central heating; Wood-burning heating option; Central air conditioning; Ceiling fans
- Interior features: Tray ceilings; Vaulted ceilings; Window treatments; Split-bedroom floor plan; Walk-in closets; Fireplace
- Laundry & utility: Washer; Dryer
Neighborhood map
What this means for you Summary
Snapshot
- This is a 3-bed/2.0-bath manufactured listed at $299k.
Deal economics
- At list price, monthly cash flow is $-255 ($-3k/yr) — negative.
- To cash-flow at today's rent, offer at most $254k (15.1% below list).
- To meet the 1% rule (rent ≥ 1% of price), the offer needs to be $209k (30.0% below list).
- Recommended offer: $209k (30.0% below list) — sets the bar for 1% rule.
Location & tenants
- Location reads 60/100 on livability (#799 in FL) — a middle-class / working-renter tenant base. Strengths: cost of living A+, housing B+; Watch: crime D+, amenities F, commute F.
- Franklin (rural): math 33% / reading 38% proficiency, ranked #67 of 73 in FL (top 92%) — families likely to look elsewhere, expect single-tenant / working-renter base with shorter leases; 84% free/reduced lunch — lower-income household profile, screen leases tightly.
- Zoned schools: Apalachicola Bay Charter School (math 56% / reading 48%, grade C-, #990 of 2,144 statewide, top 48%, 359 students, 60% FRL, charter); Franklin County Learning Center (56 students, 77% FRL) — zoned schools average 68% FRL vs 84% district-wide (16 pts lower); this property's tenant base skews higher-income than the district average.
- Zoned-school proficiency averages 52% at this address vs 36% district-wide (+16 pts) — the actual schools serving this property are materially stronger than the Franklin average implies; a family-tenant draw the district grade alone would hide.
- Market conditions: 147 active listings in the ZIP; 113 units permitted in Franklin County in 2024 (0 in 5+ unit buildings).
Forward outlook
- In year one you build about $32k of equity ($2k loan paydown + $30k appreciation (10.0% local appreciation)).
- Franklin County population projected to shrink 5% by 2050 — rents likely to lag national; underwrite the cash flow, not the appreciation.
- By year 2, paydown + projected appreciation supports a ~$51k cash-out refi (75% LTV) — recoverable capital for the next deal without selling this one.
Negotiation context
- It's been on market 51 days — a 3% lower offer ($290k) is reasonable based on typical stale-listing flexibility.
- 3 sale attempts since 20y ago; this cycle's ask has dropped $26k (8%) from the opening price — seller is motivated, your offer sets the floor, not the list.
- Current owner paid $230k; 30% above their basis — modest negotiation headroom, anchor on the comps not their cost.
Risks & watch-outs
- Watch-outs: flood insurance adds $66/mo.
- Climate carrying-cost: severe flood risk; severe wind risk, 99% chance of damaging wind over 30y; moderate wildfire risk; extreme-heat days projected 7→22/yr by 2055 (HVAC capex compounding) — expect insurance premiums to compound above CPI over the hold.
Questions for the listing agent
- What do current leases actually rent for vs. the listed asking? Can we see a recent rent roll and the last 12 months of T-12 income?
- It's been on market 51 days. Have you received any prior offers? Is the seller open to a 30% concession, seller financing, or rate buy-down credit?
- What's the actual annual flood-insurance premium (NFIP or private), and is the property in a SFHA with mandatory coverage?
- Is there a deadline driving the sale (1031 exchange, divorce, estate, relocation)? That informs how much negotiation room exists.
- Schools are F-rated, which usually means shorter tenancies and higher turnover. Who's the typical renter profile here, and what's been the actual vacancy rate?
- Crime grade is D in this area — have there been break-ins, vandalism, or insurance claims at this property in the last 3 years? What carrier currently insures it and at what premium?
- The area grade is low — what's the realistic commute time and amenity access for the typical tenant pool here? Any planned neighborhood developments (good or bad) we should know about?
- What's the average days-on-market for RENTAL listings here right now (not sales)? A rising rental-DOM trend means longer vacancies and softer asking-rent achievability than the comps imply.
- What's the recent tenant-quality profile in this submarket — average credit score on applications, eviction rate, late-payment / NSF rate, and stable-employment percentage? A property-management company in the area should have these aggregated.
- How much new for-sale + rental construction is in the pipeline within 1–3 miles? Heavy new supply typically softens prices + rents 12–24 months out; constrained supply supports both.
Investment metrics
- 1% rule
- 0.70% ✗
- Cap rate
- 5.54%
- Cash-on-cash
- -2.70%
- DSCR
- 0.88
- GRM
- 11.9
CMA / ARV
No comps found within radius.
Projected returns pro-forma
10.0% appreciation · 3.0% rent growth · sell at horizon
- IRR
- 21.7%
- Equity multiple
- 2.75×
- Total profit
- $146,527
- Equity at exit
- $269,363
- IRR
- 19.5%
- Equity multiple
- 6.31×
- Total profit
- $444,146
- Equity at exit
- $580,891
Cash invested: $83,720 (down + closing). Projections, not guarantees.
Landlord ↔ Tenant lean methodology
- Overall (STATE)
- 87 Strongly Landlord-Friendly
- State Florida
- 87 Strongly Landlord-Friendly · R+3
- County
- — inherits STATE
- City
- — inherits STATE
ZIP-level market 32346
- Home prices YoY
- 26.4%
- Active inventory
- 147
- Price-to-rent
- 11.9×
Monthly cashflow live
- Estimated rent
- $2,092 medium interval (Pro) →
- Mortgage (P&I)
- −$1,568
- Tax from tax record
- −$149 /mo · $1,788/yr
- Insurance
- −$125
- Flood insurance flood zone
- −$66 /mo · $798/yr
- HOA
- −$0
- Vacancy / Maint / Mgmt
- −$439
- Net cashflow
- $-255
Break-even live
Sensitivity live
| Price | -10% $-86 | -5% $-171 | +0% $-255 | +5% $-340 | +10% $-424 |
|---|---|---|---|---|---|
| Rent | -10% $-420 | -5% $-338 | +0% $-255 | +5% $-173 | +10% $-90 |
| Rate | -1.0pp $-105 | -0.5pp $-179 | base $-255 | +0.5pp $-333 | +1.0pp $-411 |
UW: 25.0% down · 7.5% · 30yr · 1.5% tax · 5.0% vac · 8.0% maint · 8.0% mgmt
Financing live
Cash to close
- Down payment
- $74,750
- Closing costs
- $8,970
- Reserves months
- —
- Total cash needed
- —
Loan-product check · same deal, 3 products live
Conventional
25% down · 7.5% · 30yr
- Down + closing
- —
- Monthly P&I
- —
- Monthly cashflow
- —
- DSCR
- —
- Eligible?
- —
Personal DTI + credit; lowest rate.
DSCR
20% down · 8.5% · 30yr
- Down + closing
- —
- Monthly P&I
- —
- Monthly cashflow
- —
- DSCR
- —
- Eligible?
- —
No personal income docs; deal must DSCR.
Hard money
10% down · 12.0% · 12mo
- Down + closing
- —
- Monthly P&I
- —
- Monthly cashflow
- —
- DSCR
- —
- Eligible?
- —
Short-term bridge; refi at stabilization.
Listing history 21 events
-
2026-06-21days on market $299,000 Active 51 DOM
-
2026-06-19days on market $299,000 Active 49 DOM
-
2026-06-18days on market $299,000 Active 48 DOM
-
2026-06-10days on market $299,000 Active 47 DOM
-
2026-06-09days on market $299,000 Active 46 DOM
-
2026-06-08days on market $299,000 Active 45 DOM
-
2026-06-07days on market $299,000 Active 44 DOM
-
2026-06-05days on market $299,000 Active 41 DOM
-
2026-06-03days on market $299,000 Active 40 DOM
-
2026-06-02days on market $299,000 Active 39 DOM
-
2026-06-01days on market $299,000 Active 38 DOM
-
2026-05-31days on market $299,000 Active 37 DOM
-
2026-05-30days on market $299,000 Active 36 DOM
-
2026-04-24historical
-
2026-03-18$325,000 Active
-
2024-05-30soldstatus $230,000 21-char remark
Show marketing remark (21 chars)
For Sold/Comp purpose
-
2024-04-30soldstatus $230,000
-
2024-04-11$240,000 21-char remark
Show marketing remark (21 chars)
For Sold/Comp purpose
-
2008-12-05soldstatus $165,000
-
2006-04-24$299,000 Active
-
2004-07-12soldstatus $199,000
ⓘ Source: listings_history table (triggers on properties + properties_extension) + one-shot
backfill from property_details.listing_events for pre-trigger history.
Tax reassessment forecast FL · Resets to sale price
- Current annual tax
- $1,788 · $149/mo
- Projected year-2 tax
- $2,482 · $207/mo
- Expected delta
- +$693/yr (+$58/mo · 38.8%)
ⓘ Screening estimate from a state-policy table — verify with the county assessor before closing.
Climate risk First Street
- Flood 8/10 Severe FEMA zone X (shaded) · 96% chance over 30 yrs
- Wildfire 5/10 Major
- Heat 10/10 Extreme 7 d/yr ≥109°F today · 22 d/yr by 30 yrs out
- Wind 10/10 Extreme 99% chance of damaging wind over 30 yrs
- Air quality 2/10 Low 0 unhealthy d/yr today · 1 by 30 yrs out
Nearby sold comps map
Loading sold comps map…
Walkable amenities ~0.75 mi
Loading nearby amenities…
Taxation est. · year 1
- Rental income
- $25,107
- − Mortgage interest
- −$16,749
- − Property taxes
- −$1,788
- − Insurance
- −$2,292
- − Repairs & maintenance
- −$2,009
- − Management
- −$2,009
- − Depreciation
- −$8,698
- Taxable loss
- −$8,437
- Est. tax savings @ 24.0%
- +$2,025
- After-tax cash flow
- $-1,037/yr
For passive investors: Depreciation is non-cash, so a rental often shows a tax loss while cash-flowing — sheltering income. Rental losses are passive: they offset passive income freely, and up to $25,000/yr can offset ordinary (W-2) income if you actively participate and your MAGI is under $100k (phasing out to $0 by $150k); unused losses carry forward. On sale, claimed depreciation is recaptured at up to 25%, and gains may owe capital-gains tax (a 1031 exchange can defer both). Figures are a year-1 estimate at your 24.0% rate — not tax advice; consult a CPA.
Schools (NCES district)
- District
- Franklin
- NCES district ID
- 1200570
- Math proficiency
- 33% ▼ -9.00%
- Reading proficiency
- 38% ▼ -4.00%
- Median HH income
- $39,084
- Composite
- 29.7/100
- National rank
- #6454
- State rank
- #67 of 73 in FL
Livability — Panacea
- Score
- 60/100
- State rank
- #799
- US rank
- #18502
Category grades
Schools grade is shown separately in the Schools card above.
Census & demographics
- Population (ZIP)
- 2,393
Population outlook (Franklin County) Hauer SSP2
- Today (2025)
- 11,827 people
- By 2030
- 11,839 · +0.1%
- By 2040
- 11,707 · -1.0%
- By 2050
- 11,218 · -5.1%
- By 2075
- 9,849 · -16.7%
- By 2100
- 7,286 · -38.4%
Race, ethnicity, and origin ACS 2023
- Neighborhood character
- Predominantly White (96%)
- Race & ethnicity
- White 96% Two or more races 2% Hispanic / Latino 1%
- Common ancestry
- Scottish 2% Slovak 2% Italian 2%
- Foreign-born
- 2% · Canada
- Languages at home
- 97% English-only · Spanish 1% Other Indo-European 1% French/Haitian/Cajun 1%
Political lean MEDSL · Franklin
- 2024 margin
- Solid R (+43.8) · D 27.7% · R 71.5%
- 2008→2024 swing
- -15.9pp toward R · 2008: -27.9pp · 2024: -43.8pp
- All cycles
- 2024: R+43.8 2020: R+37.3 2016: R+39.7 2012: R+31.5 2008: R+27.9
Not yet ingested
- Civics
- —
Market trends
- HPI YoY
- ▲ 87.07%
- Current HPI
- 417.3486
- Rent YoY
- —
- Metro
- —
- State GDP YoY
- ▲ 3.28%
- F500 in state
- 36
Industry mix (Fortune 500 HQ in FL)
| Industry | F500 HQs | Revenue |
|---|---|---|
| Industrial Technology | 2 | $29B |
|
||
| Insurance | 2 | $17B |
|
||
| Retail | 1 | $60B |
|
||
| Technology Distribution | 1 | $58B |
|
||
| Homebuilding | 1 | $35B |
|
||
| Technology Manufacturing | 1 | $35B |
|
||
Price history
+63.3% since first listed8 events — show timeline
- 2026-04-24 Listing Removed — CATRS
- 2026-03-18 Listed $325,000 CATRS
- 2024-05-30 Sold (MLS) $230,000 CATRS
- 2024-04-30 Sold (Public Records) $230,000 Public Records
- 2024-04-11 Listed $240,000 CATRS
- 2008-12-05 Sold (Public Records) $165,000 Public Records
- 2006-04-24 Listed $299,000 CATRS
- 2004-07-12 Sold (Public Records) $199,000 Public Records
Property tax history
+5.1%/yrLatest (2025): $1,788 · +113.2% YoY. Source: county tax records.
Cash-flow waterfall
monthlySold comps — $/sqft
last 12 mo · ≤1 miLoading sold comps…