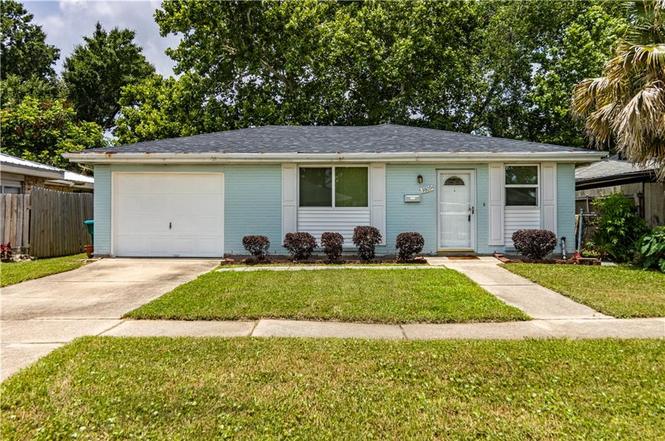
3809 Ole Miss Dr · Kenner, LA
Flood risk No data
- FEMA flood zone
- —
- Chance of flooding over 30 yrs
- —
- Est. flood insurance / yr
- —
Fire risk No data
- Est. fire insurance / yr
- —
Heat risk No data
- Hot days now (above threshold)
- —
- Hot days in 30 yrs
- —
Wind risk No data
- Chance of severe wind over 30 yrs
- —
Air-quality risk No data
- Unhealthy air days now
- —
- Unhealthy air days in 30 yrs
- —
Risk factors via First Street. Map © Google.
Why this score? — see what drove the D grade
The composite is a weighted blend of 9 inputs, each scored 0–100. Each bar is that input's sub-score; the figure is the points it added to the 100-point composite (weight × sub-score).
- Cash flow +15.4/30.0
- ARV discount +7.5/15.0
- DSCR +4.7/10.0
- 1% rule +4.2/10.0
- Livability +3.9/5.0
- Schools +2.5/10.0
- Condition / age +2.5/5.0
- Rent growth +1.5/5.0
- Appreciation +0.0/10.0
$199,000
🖨 Deal sheet (PDF) 📄 Offer letter ✓ Due diligence
Listing remarks
Welcome home to this adorable, move-in-ready gem in Kenner! This beautifully maintained 3-bedroom, 2-bath home offers the perfect combination of charm, updates, and peace of mind. Major improvements have already been completed, including a newer HVAC system (2024), a roof that's only 5 years old, and hurricane-impact windows rated for 100+ MPH winds. Inside, you'll find a bright and inviting floor plan with plenty of natural light and a newer stove that's just one year old. The spacious primary suite, attached garage, and functional layout make everyday living easy and comfortable. Step outside to enjoy the fully fenced backyard, great for pets, play, or entertaining. A bonus wooden porch p
Key facts
- Bonus wooden porch
- Backyard shed
- Newer hvac system
Tags
Property features AI
Finance
- Other: Located near Vintage and West Esplanade (directions reference)
Exterior
- Parking: Garage
- Utilities: Electric service: Entergy
- Home design: Single family residence
- Construction: Brick construction; Composition roof
- Exterior features: Chain link full fence; Workshop on the property
Interior
- Bedrooms: Bedroom 1; Bedroom 2; Bedroom 3
- Bathrooms: 2 full bathrooms
- Heating & cooling: Central heating; Central air conditioning
- Interior features: Living room; Kitchen
Neighborhood map
What this means for you Summary
Snapshot
- This is a 3-bed/2.0-bath other listed at $199k.
Deal economics
- At list price, monthly cash flow is $78 ($936/yr) — positive.
- The deal already cash-flows at list — no discount required.
- To meet the 1% rule (rent ≥ 1% of price), the offer needs to be $184k (7.6% below list).
- Recommended offer: $184k (7.6% below list) — sets the bar for 1% rule.
- Cap rate 6.8% vs local median 5.3% in Kenner — meaningfully above typical; check what's discounted (condition, days-on-market, listing class) to confirm the premium yield is real.
Location & tenants
- Location reads 78/100 on livability (#6 in LA, #2,414 nationally) — a middle-class / working-renter tenant base. Strengths: cost of living A+, housing A+, health & safety A+; Watch: amenities C-, employment C-, crime D.
- Jefferson Parish (suburban): math 24% / reading 34% proficiency, ranked #44 of 98 in LA (top 45%) — low school quality limits family demand, transient renter base, plan for 1-2y turnover; 70% free/reduced lunch — lower-income household profile, screen leases tightly.
- Zoned schools: John James Audubon School (math 22% / reading 35%, grade F, #350 of 646 statewide, top 55%, 648 students, 61% FRL); John Q. Adams Middle School (math 22% / reading 36%, grade F, #117 of 218 statewide, top 54%, 900 students, 55% FRL); Bonnabel Magnet Academy High School (math 12% / reading 21%, grade F, #214 of 265 statewide, top 81%, 1,478 students, 52% FRL).
- Market conditions: Rents falling (-4.2%/yr); 292 active listings in the ZIP; 40 comparable units currently listed for rent nearby; rentals at typical pace (median 22d on market — plan ~3-4 weeks tenant-placement turnaround); 40% of comp listings sitting > 30 days — soft ceiling on asking rent; 518 units permitted in Jefferson Parish in 2024 (43 in 5+ unit buildings).
- This rent runs 33% of the median local income ($67k/yr) — at the standard rent-burdened threshold; future hikes will face affordability resistance.
Forward outlook
- Local home prices are declining (-3.0%/yr); year-one equity from $1k of loan paydown is wiped out by about $6k of value loss. Plan a longer hold.
Negotiation context
- Only 4 days on market — expect competitive offers; lowballing is unlikely to land.
Questions for the listing agent
- Built in 1970 — when were the roof, HVAC, electrical panel, plumbing, and water heater last replaced?
- Is there a deadline driving the sale (1031 exchange, divorce, estate, relocation)? That informs how much negotiation room exists.
- Crime grade is D in this area — have there been break-ins, vandalism, or insurance claims at this property in the last 3 years? What carrier currently insures it and at what premium?
- The area grade is low — what's the realistic commute time and amenity access for the typical tenant pool here? Any planned neighborhood developments (good or bad) we should know about?
- What's the average days-on-market for RENTAL listings here right now (not sales)? A rising rental-DOM trend means longer vacancies and softer asking-rent achievability than the comps imply.
- What's the recent tenant-quality profile in this submarket — average credit score on applications, eviction rate, late-payment / NSF rate, and stable-employment percentage? A property-management company in the area should have these aggregated.
- How much new for-sale + rental construction is in the pipeline within 1–3 miles? Heavy new supply typically softens prices + rents 12–24 months out; constrained supply supports both.
Investment metrics
- 1% rule
- 0.92% ✗
- Cap rate
- 6.76%
- Cash-on-cash
- 1.68%
- DSCR
- 1.07
- GRM
- 9.0
CMA / ARV
No comps found within radius.
Projected returns pro-forma
-3.0% appreciation · 0.0% rent growth · sell at horizon
- IRR
- -17.0%
- Equity multiple
- 0.41×
- Total profit
- $-32,642
- Equity at exit
- $29,672
- IRR
- -15.8%
- Equity multiple
- 0.23×
- Total profit
- $-42,748
- Equity at exit
- $17,206
Cash invested: $55,720 (down + closing). Projections, not guarantees.
Landlord ↔ Tenant lean methodology
- Overall (STATE)
- 90 Strongly Landlord-Friendly
- State Louisiana
- 90 Strongly Landlord-Friendly · R+12
- County
- — inherits STATE
- City
- — inherits STATE
ZIP-level market 70065
- Rents YoY
- -4.2%
- Active inventory
- 292
- Price-to-rent
- 9.0×
Monthly cashflow live
- Estimated rent
- $1,840 high interval (Pro) →
- Mortgage (P&I)
- −$1,044
- Tax est. 1.5%
- −$249 /mo · $2,985/yr
- Insurance
- −$83
- HOA
- −$0
- Vacancy / Maint / Mgmt
- −$386
- Net cashflow
- $78
Break-even live
Sensitivity live
| Price | -10% $216 | -5% $147 | +0% $78 | +5% $9 | +10% $-60 |
|---|---|---|---|---|---|
| Rent | -10% $-67 | -5% $5 | +0% $78 | +5% $151 | +10% $223 |
| Rate | -1.0pp $178 | -0.5pp $129 | base $78 | +0.5pp $26 | +1.0pp $-26 |
UW: 25.0% down · 7.5% · 30yr · 1.5% tax · 5.0% vac · 8.0% maint · 8.0% mgmt
Financing live
Cash to close
- Down payment
- $49,750
- Closing costs
- $5,970
- Reserves months
- —
- Total cash needed
- —
Loan-product check · same deal, 3 products live
Conventional
25% down · 7.5% · 30yr
- Down + closing
- —
- Monthly P&I
- —
- Monthly cashflow
- —
- DSCR
- —
- Eligible?
- —
Personal DTI + credit; lowest rate.
DSCR
20% down · 8.5% · 30yr
- Down + closing
- —
- Monthly P&I
- —
- Monthly cashflow
- —
- DSCR
- —
- Eligible?
- —
No personal income docs; deal must DSCR.
Hard money
10% down · 12.0% · 12mo
- Down + closing
- —
- Monthly P&I
- —
- Monthly cashflow
- —
- DSCR
- —
- Eligible?
- —
Short-term bridge; refi at stabilization.
Rent comps 40 comps
| Address | Beds | Baths | Sqft | Rent | $/sqft | DOM | Units | Dist |
|---|---|---|---|---|---|---|---|---|
| 3872 E Loyola Dr Kenner, LA | 3.0 | 2.0 | 1170 | $1,575 | $1.35 | 22d | 1 | 0.15mi |
| 604 Vintage Dr Unit C Kenner, LA | 2.0 | 2.5 | 1200 | $1,350 | $1.12 | 45d | 1 | 0.21mi |
| 3600 Loyola Dr Unit 353 Kenner, LA | 2.0 | 2.0 | 1100 | $1,445 | $1.31 | 45d | 1 | 0.38mi |
| 3700 Loyola Dr Unit 377 Kenner, LA | 2.0 | 2.0 | 1110 | $1,495 | $1.35 | 45d | 1 | 0.40mi |
| 3655 Loyola Dr Unit F460 Kenner, LA | 2.0 | 2.0 | 1330 | $2,280 | $1.71 | 3d | 1 | 0.49mi |
| 3655 Loyola Dr Unit F361 Kenner, LA | 2.0 | 2.0 | 1330 | $2,395 | $1.80 | 25d | 1 | 0.50mi |
| 3655 Loyola Dr Unit C229 Kenner, LA | 2.0 | 2.0 | 1349 | $2,335 | $1.73 | 45d | 1 | 0.50mi |
| 3655 Loyola Dr Unit C224 Kenner, LA | 2.0 | 2.0 | 1367 | $2,305 | $1.69 | 3d | 1 | 0.50mi |
| 3655 Loyola Dr Unit D236 Kenner, LA | 2.0 | 2.0 | 1367 | $2,320 | $1.70 | 3d | 1 | 0.50mi |
| 3655 Loyola Dr Apt F261 Kenner, LA | 2.0 | 2.0 | 1330 | $2,425 | $1.82 | 16d | 1 | 0.50mi |
| 3655 Loyola Dr Unit F158 Kenner, LA | 2.0 | 2.0 | 1367 | $2,445 | $1.79 | 16d | 1 | 0.50mi |
| 3655 Loyola Dr Unit C329 Kenner, LA | 2.0 | 2.0 | 1349 | $2,320 | $1.72 | 45d | 1 | 0.50mi |
| 3655 Loyola Dr Unit C223 Kenner, LA | 2.0 | 2.0 | 1330 | $2,295 | $1.73 | 3d | 1 | 0.50mi |
| 4129 Chateau Blvd Unit C Kenner, LA | 2.0 | 1.5 | 1400 | $1,425 | $1.02 | 6d | 1 | 0.59mi |
| 505 Vassar Ct Kenner, LA | 3.0 | 2.0 | 1300 | $1,800 | $1.38 | 45d | 1 | 0.60mi |
| 815 Vouray Dr Kenner, LA | 2.0 | 1.0 | 800 | $1,450 | $1.81 | 16d | 1 | 0.61mi |
| 4213 Arbor Ct Unit A Kenner, LA | 2.0 | 1.5 | 1027 | $1,320 | $1.29 | 45d | 1 | 0.61mi |
| 708 Vouray Dr Unit A Kenner, LA | 2.0 | 1.5 | 1200 | $1,200 | $1.00 | 16d | 1 | 0.61mi |
| 4321 Loire Dr Unit D Kenner, LA | 3.0 | 2.0 | 1250 | $1,500 | $1.20 | 16d | 1 | 0.61mi |
| 4212 Arbor Ct Unit D Kenner, LA | 2.0 | 1.5 | 1079 | $1,320 | $1.22 | 45d | 1 | 0.63mi |
| 909 Vouray Dr Unit c Kenner, LA | 2.0 | 1.5 | 1200 | $1,200 | $1.00 | 45d | 1 | 0.63mi |
| 4329 Loire Dr Apt D Kenner, LA | 3.0 | 2.0 | 1300 | $1,500 | $1.15 | 6d | 1 | 0.63mi |
| 3816 W Louisiana State Dr Kenner, LA | 3.0 | 2.0 | 1400 | $1,800 | $1.29 | 13d | 1 | 0.64mi |
| 913 Vouray Dr Unit C Kenner, LA | 2.0 | 1.5 | 1200 | $1,200 | $1.00 | 45d | 1 | 0.64mi |
| 4204 Asher Ct Apt D Kenner, LA | 2.0 | 1.5 | 1250 | $1,250 | $1.00 | 16d | 1 | 0.65mi |
| 4206 Paradis Ln Kenner, LA | 3.0 | 2.5 | 1350 | $1,950 | $1.44 | 25d | 1 | 0.66mi |
| 1012 St Julien Dr Apt F4 Kenner, LA | 2.0 | 2.5 | 1271 | $1,400 | $1.10 | 22d | 1 | 0.66mi |
| 3655 W Loyola Dr Kenner, LA | 1.0–2.0 | 1.0–2.0 | 1169 | $2,345 | $2.01 | 3d | 35 | 0.68mi |
| 901 Sunset Blvd Kenner, LA | 2.0 | 2.5 | 1219 | $1,800 | $1.48 | 6d | 1 | 0.69mi |
| 3808 Tulane Dr Kenner, LA | 3.0 | 2.0 | 1220 | $2,000 | $1.64 | 45d | 1 | 0.69mi |
| 4204 Chateau Blvd Unit A Kenner, LA | 2.0 | 1.5 | 1100 | $1,300 | $1.18 | 45d | 1 | 0.70mi |
| 3600 W Loyola Dr Unit 182 Kenner, LA | 2.0 | 2.0 | 1052 | $1,515 | $1.44 | 45d | 1 | 0.72mi |
| 3600 W Loyola Dr Unit 159 Kenner, LA | 2.0 | 2.0 | 1052 | $1,520 | $1.44 | 45d | 1 | 0.72mi |
| 1014 Saint Julien Dr Unit c2 Kenner, LA | 3.0 | 2.5 | 1450 | $1,850 | $1.28 | 5d | 1 | 0.72mi |
| 187 Avant Garde Cir #187 Kenner, LA | 2.0 | 1.5 | 1050 | $1,500 | $1.43 | 16d | 1 | 0.73mi |
| 215 Avant Garde Cir Kenner, LA | 2.0 | 2.0 | 1200 | $1,500 | $1.25 | 4d | 1 | 0.73mi |
| 800 Joe Yenni Blvd Kenner, LA | 2.0 | 1.0–2.0 | 780 | $1,400 | $1.79 | 45d | 1 | 0.76mi |
| 4230 Chateau Blvd Unit C Kenner, LA | 2.0 | 2.0 | 1100 | $1,300 | $1.18 | 25d | 1 | 0.76mi |
| 3800 Grandlake Blvd Kenner, LA | 1.0–2.0 | 1.0–2.0 | 950 | $1,535 | $1.62 | 6d | 1 | 0.82mi |
| 1201 W Esplanade Ave Kenner, LA | 1.0–2.0 | 1.0–2.0 | 746 | $1,110 | $1.49 | 45d | 1 | 1.00mi |
Listing history 7 events
-
2026-06-21statusdays on market $199,000 Pending 4 DOM
-
2026-06-18days on market $199,000 Active 3 DOM
-
2026-06-17days on market $199,000 Active 2 DOM
-
2026-06-16days on market $199,000 Active 1 DOM
-
2026-06-15days on market $199,000 Active 3 DOM
-
2026-06-13remarks 699-char remark
-
2026-06-13$199,000 Active 1 DOM
ⓘ Source: listings_history table (triggers on properties + properties_extension) + one-shot
backfill from property_details.listing_events for pre-trigger history.
Nearby sold comps map
Loading sold comps map…
Walkable amenities ~0.75 mi
Loading nearby amenities…
Taxation est. · year 1
- Rental income
- $22,075
- − Mortgage interest
- −$11,147
- − Property taxes
- −$2,985
- − Insurance
- −$995
- − Repairs & maintenance
- −$1,766
- − Management
- −$1,766
- − Depreciation
- −$5,789
- Taxable loss
- −$2,374
- Est. tax savings @ 24.0%
- +$570
- After-tax cash flow
- $1,506/yr
For passive investors: Depreciation is non-cash, so a rental often shows a tax loss while cash-flowing — sheltering income. Rental losses are passive: they offset passive income freely, and up to $25,000/yr can offset ordinary (W-2) income if you actively participate and your MAGI is under $100k (phasing out to $0 by $150k); unused losses carry forward. On sale, claimed depreciation is recaptured at up to 25%, and gains may owe capital-gains tax (a 1031 exchange can defer both). Figures are a year-1 estimate at your 24.0% rate — not tax advice; consult a CPA.
Schools (NCES district)
- District
- Jefferson Parish
- NCES district ID
- 2200840
- Math proficiency
- 24% ▼ -36.00%
- Reading proficiency
- 34% ▼ -30.00%
- Median HH income
- $48,421
- Composite
- 25.19/100
- National rank
- #7511
- State rank
- #44 of 98 in LA
Livability — Kenner
- Score
- 78/100
- State rank
- #6
- US rank
- #2414
Category grades
Schools grade is shown separately in the Schools card above.
Census & demographics
- Census place
- Kenner, LA
- County
- Jefferson Parish · 426,999 people
- City population
- 66,707
- Metro
- New Orleans-Metairie, LA
- Population (ZIP)
- 48,936
- Household income
- $67,285
- Rent vs Own
- Severe rent burden
- 1906.0
Population outlook (Jefferson County) Hauer SSP2
- Today (2025)
- 451,696 people
- By 2030
- 455,451 · +0.8%
- By 2040
- 458,308 · +1.5%
- By 2050
- 461,031 · +2.1%
- By 2075
- 476,351 · +5.5%
- By 2100
- 499,377 · +10.6%
Race, ethnicity, and origin ACS 2023
- Neighborhood character
- Diverse neighborhood (Simpson 0.69)
- Race & ethnicity
- White 47% Hispanic / Latino 27% Two or more races 15% Black 15% Asian 6%
- Hispanic origin (detail)
- Mexican 2% Puerto Rican 3% Cuban 2%
- Common ancestry
- Lithuanian 9% Slovak 1% Italian 1%
- Foreign-born
- 19% · Canada, China, Vietnam
- Languages at home
- 72% English-only · Spanish 21% Other Indo-European 3% Arabic 1%
Political lean MEDSL · Jefferson
- 2024 margin
- R (+12.9) · D 42.5% · R 55.5% · Other 2.1%
- 2008→2024 swing
- +13.6pp toward D · 2008: -26.6pp · 2024: -12.9pp
- All cycles
- 2024: R+12.9 2020: R+11.1 2016: R+14.8 2012: R+18.4 2008: R+26.6
Not yet ingested
- Civics
- —
Market trends
- HPI YoY
- ▼ -214.79%
- Current HPI
- 139.5115
- Rent YoY
- ▼ -4.19%
- Metro
- New Orleans-Metairie, LA
- State GDP YoY
- ▲ 3.29%
- F500 in state
- 10
Industry mix (Fortune 500 HQ in LA)
| Industry | F500 HQs | Revenue |
|---|---|---|
| Telecommunications | 2 | $23B |
|
||
| Utilities | 1 | $12B |
|
||
| Wholesale / Distribution | 1 | $5B |
|
||
| Advertising | 1 | $2B |
|
||
Price history
1 event — show timeline
- 2026-06-12 Listed $199,000 AcadianaMLS
Property tax history
+11.9%/yrLatest (2025): $14 · -3.7% YoY. Source: county tax records.
Cash-flow waterfall
monthlySold comps — $/sqft
last 12 mo · ≤1 miLoading sold comps…