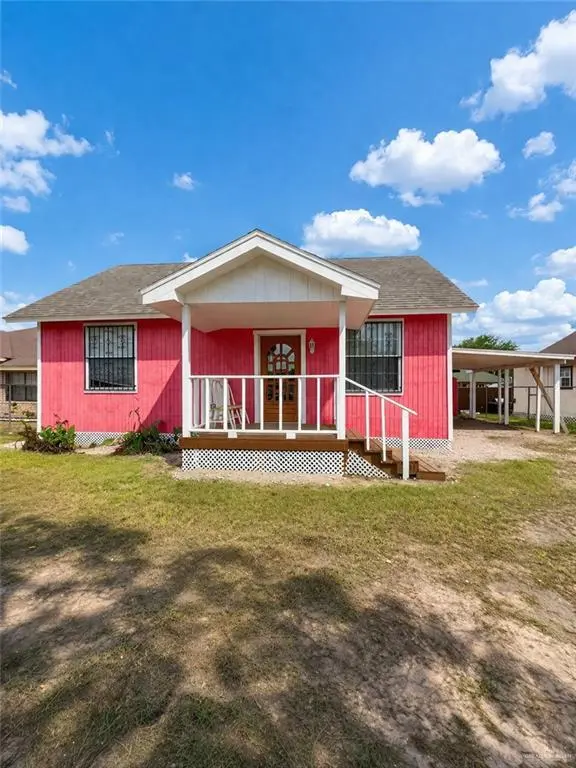
616 W Diamond Head Ave · Alton, TX
Flood risk 4/10 · Minor
- FEMA flood zone
- X
- Chance of flooding over 30 yrs
- 0.22%
- Est. flood insurance / yr
- $507 – $1,088
Fire risk 6/10 · Moderate
- Est. fire insurance / yr
- $1,222 – $2,270
Heat risk 9/10 · Severe
- Hot days now (above 112°F)
- 7 days/yr
- Hot days in 30 yrs
- 22 days/yr
Wind risk 8/10 · Major
- Chance of severe wind over 30 yrs
- 99.0%
Air-quality risk 2/10 · Minimal
- Unhealthy air days now
- 0 days/yr
- Unhealthy air days in 30 yrs
- 1 days/yr
Risk factors via First Street. Map © Google.
Why this score? — see what drove the C grade
The composite is a weighted blend of 9 inputs, each scored 0–100. Each bar is that input's sub-score; the figure is the points it added to the 100-point composite (weight × sub-score).
- ARV discount +15.0/15.0
- Cash flow +14.6/30.0
- Appreciation +10.0/10.0
- DSCR +4.5/10.0
- 1% rule +4.2/10.0
- Rent growth +3.1/5.0
- Livability +2.9/5.0
- Condition / age +2.5/5.0
- Schools +1.7/10.0
$165,000
🖨 Deal sheet (PDF) 📄 Offer letter ✓ Due diligence
Listing remarks MLS
Come take a look at 616 W Diamondhead Ave in Alton, TX, an inviting and thoughtfully updated home offering space, flexibility, and convenience! This 4-bedroom, 2-bath residence features a functional layout with two spacious living areas, ideal for everyday living, gatherings, or creating a dedicated office or flex space. Recent updates provide a refreshed feel, including interior improvements and a clean, modern touch throughout. The centrally located kitchen flows seamlessly into the dining area, creating a natural hub for meals and connection. Step outside to a generously sized backyard with plenty of room for outdoor activities, entertaining, or future enhancements. A detached storage structure adds extra versatility, perfect for storage, hobbies, or workspace. Conveniently located near local schools, shopping, dining, and major roadways, this property offers both comfort and accessibility. Schedule your showing today and explore the possibilities this home has to offer!
Key facts
- Updated home
- 7,000 sq ft lot
- Garage
Tags
Neighborhood map
What this means for you Summary
Snapshot
- This is a 3-bed/2.0-bath single-family listed at $165k.
Deal economics
- At list price, monthly cash flow is $41 ($489/yr) — positive.
- The deal already cash-flows at list — no discount required.
- To meet the 1% rule (rent ≥ 1% of price), the offer needs to be $151k (8.5% below list).
- Recommended offer: $151k (8.5% below list) — sets the bar for 1% rule.
- Cap rate 6.6% vs local median 2.6% in Alton — top-decile yield for the area; either an underpriced asset or a hidden risk that comps aren't pricing in. Stress-test before assuming the spread holds.
Location & tenants
- Location reads 58/100 on livability (#1,230 in TX) — a working-class tenant base; expect higher turnover. Strengths: cost of living A+, housing A; Watch: schools F, crime F, amenities F.
- Mission CISD (urban): math 15% / reading 28% proficiency, ranked #775 of 826 in TX (top 94%) — low school quality limits family demand, transient renter base, plan for 1-2y turnover; 78% free/reduced lunch — lower-income household profile, screen leases tightly.
- Market conditions: Rents rising (+2.5%/yr); 624 active listings in the ZIP; 1 comparable units currently listed for rent nearby; 7,378 units permitted in Hidalgo County in 2024 (641 in 5+ unit buildings).
- This rent runs 33% of the median local income ($55k/yr) — at the standard rent-burdened threshold; future hikes will face affordability resistance.
Forward outlook
- In year one you build about $18k of equity ($1k loan paydown + $16k appreciation (10.0% local appreciation)).
- Hidalgo County population projected at +28% by 2050 — long-run rental-demand tailwind backs the buy-and-hold thesis.
- At projected returns (10.0% appreciation + 2.5% rent growth), your $46k cash investment doubles in ~3 years — after that, you're playing with house money.
- By year 3, paydown + projected appreciation supports a ~$45k cash-out refi (75% LTV) — recoverable capital for the next deal without selling this one.
Negotiation context
- It's been on market 70 days — a 6% lower offer ($155k) is reasonable based on typical stale-listing flexibility.
- 3 sale attempts with the ask held roughly flat each time — persistent listings suggest the price (not the market) is what's stuck; bring a comps-based counter.
Risks & watch-outs
- Climate carrying-cost: severe wind risk, 99% chance of damaging wind over 30y; major wildfire risk; extreme-heat days projected 7→22/yr by 2055 (HVAC capex compounding) — expect insurance premiums to compound above CPI over the hold.
Questions for the listing agent
- It's been on market 70 days. Have you received any prior offers? Is the seller open to a 8% concession, seller financing, or rate buy-down credit?
- Built in 1970 — when were the roof, HVAC, electrical panel, plumbing, and water heater last replaced?
- Why hasn't it sold? Are there any deal-killer items the seller is aware of (foundation, flood, title, zoning, code violations)?
- Is there a deadline driving the sale (1031 exchange, divorce, estate, relocation)? That informs how much negotiation room exists.
- Schools are F-rated, which usually means shorter tenancies and higher turnover. Who's the typical renter profile here, and what's been the actual vacancy rate?
- Crime grade is F in this area — have there been break-ins, vandalism, or insurance claims at this property in the last 3 years? What carrier currently insures it and at what premium?
- What's the average days-on-market for RENTAL listings here right now (not sales)? A rising rental-DOM trend means longer vacancies and softer asking-rent achievability than the comps imply.
- What's the recent tenant-quality profile in this submarket — average credit score on applications, eviction rate, late-payment / NSF rate, and stable-employment percentage? A property-management company in the area should have these aggregated.
- How much new for-sale + rental construction is in the pipeline within 1–3 miles? Heavy new supply typically softens prices + rents 12–24 months out; constrained supply supports both.
Investment metrics
- 1% rule
- 0.92% ✗
- Cap rate
- 6.59%
- Cash-on-cash
- 1.06%
- DSCR
- 1.05
- GRM
- 9.1
CMA / ARV
- ARV (median comp)
- $265,500
- List price
- $165,000
- Delta
- -37.85%
- Verdict
- UNDERPRICED
- Comps
- 20 within 1.0 mi
Show comp detail 6 sales within ~0.75 mi
| Address | Dist | Beds/Ba | Sqft | Sold | Price | $/sf | Match |
|---|---|---|---|---|---|---|---|
| 506 W La Pointe Ave | 0.23mi | 4/2.0 (+1) | 1,800 (-5%) | 2mo | $310,000 | $172 | 74 |
| 415 W Campeche Ave | 0.14mi | 4/3.0 (+1) | 2,025 (+6%) | 0mo | $329,000 | $162 | 73 |
| 617 W La Pointe Ave | 0.17mi | 4/2.0 (+1) | 1,744 (-8%) | 2mo | $300,000 | $172 | 72 |
| 609 W La Pointe Ave | 0.18mi | 4/2.0 (+1) | 1,617 (-15%) | 11mo | $289,000 | $179 | 52 |
| 1305 W Combes Ave | 0.47mi | 3/2.0 | 1,769 (-7%) | 23mo | $250,000 | $141 | 47 |
| 1010 W Franklin Ave | 0.75mi | 3/3.0 | 2,115 (+11%) | 0mo | $295,000 | $139 | 42 |
Match score weights: distance 35% · size 25% · config 20% · recency 20%. Top-matched comps best support the ARV.
Projected returns pro-forma
10.0% appreciation · 2.45% rent growth · sell at horizon
- IRR
- 24.9%
- Equity multiple
- 2.98×
- Total profit
- $91,660
- Equity at exit
- $148,645
- IRR
- 21.8%
- Equity multiple
- 6.76×
- Total profit
- $266,291
- Equity at exit
- $320,559
Cash invested: $46,200 (down + closing). Projections, not guarantees.
Landlord ↔ Tenant lean methodology
- Overall (STATE)
- 87 Strongly Landlord-Friendly
- State Texas
- 87 Strongly Landlord-Friendly · R+5
- County
- — inherits STATE
- City
- — inherits STATE
ZIP-level market 78573
- Home prices YoY
- 8.0%
- Rents YoY
- 2.5%
- Active inventory
- 624
- Price-to-rent
- 9.1×
Monthly cashflow live
- Estimated rent
- $1,510 medium interval (Pro) →
- Mortgage (P&I)
- −$865
- Tax from tax record
- −$218 /mo · $2,617/yr
- Insurance
- −$69
- HOA
- −$0
- Vacancy / Maint / Mgmt
- −$317
- Net cashflow
- $41
Break-even live
Sensitivity live
| Price | -10% $134 | -5% $87 | +0% $41 | +5% $-6 | +10% $-53 |
|---|---|---|---|---|---|
| Rent | -10% $-79 | -5% $-19 | +0% $41 | +5% $100 | +10% $160 |
| Rate | -1.0pp $124 | -0.5pp $83 | base $41 | +0.5pp $-2 | +1.0pp $-45 |
UW: 25.0% down · 7.5% · 30yr · 1.5% tax · 5.0% vac · 8.0% maint · 8.0% mgmt
Financing live
Cash to close
- Down payment
- $41,250
- Closing costs
- $4,950
- Reserves months
- —
- Total cash needed
- —
Loan-product check · same deal, 3 products live
Conventional
25% down · 7.5% · 30yr
- Down + closing
- —
- Monthly P&I
- —
- Monthly cashflow
- —
- DSCR
- —
- Eligible?
- —
Personal DTI + credit; lowest rate.
DSCR
20% down · 8.5% · 30yr
- Down + closing
- —
- Monthly P&I
- —
- Monthly cashflow
- —
- DSCR
- —
- Eligible?
- —
No personal income docs; deal must DSCR.
Hard money
10% down · 12.0% · 12mo
- Down + closing
- —
- Monthly P&I
- —
- Monthly cashflow
- —
- DSCR
- —
- Eligible?
- —
Short-term bridge; refi at stabilization.
Rent comps 1 comps
| Address | Beds | Baths | Sqft | Rent | $/sqft | DOM | Units | Dist |
|---|---|---|---|---|---|---|---|---|
| 614 W La Pointe Ave Mission, TX | 4.0 | 3.0 | 2500 | $2,300 | $0.92 | 45d | 1 | 0.20mi |
Listing history 20 events
-
2026-06-21days on market $165,000 Active 70 DOM
-
2026-06-18days on market $165,000 Active 67 DOM
-
2026-06-17days on market $165,000 Active 66 DOM
-
2026-06-16days on market $165,000 Active 65 DOM
-
2026-06-15days on market $165,000 Active 64 DOM
-
2026-06-14days on market $165,000 Active 62 DOM
-
2026-06-10days on market $165,000 Active 59 DOM
-
2026-06-09days on market $165,000 Active 58 DOM
-
2026-06-08days on market $165,000 Active 57 DOM
-
2026-06-07days on market $165,000 Active 56 DOM
-
2026-06-03days on market $165,000 Active 52 DOM
-
2026-06-02days on market $165,000 Active 51 DOM
-
2026-06-01days on market $165,000 Active 50 DOM
-
2026-05-31days on market $165,000 Active 49 DOM
-
2026-05-31days on market $165,000 Active 48 DOM
-
2026-04-11$165,000 Active 990-char remark
Show marketing remark (990 chars)
Come take a look at 616 W Diamondhead Ave in Alton, TX, an inviting and thoughtfully updated home offering space, flexibility, and convenience! This 4-bedroom, 2-bath residence features a functional layout with two spacious living areas, ideal for everyday living, gatherings, or creating a dedicated office or flex space. Recent updates provide a refreshed feel, including interior improvements and a clean, modern touch throughout. The centrally located kitchen flows seamlessly into the dining area, creating a natural hub for meals and connection. Step outside to a generously sized backyard with plenty of room for outdoor activities, entertaining, or future enhancements. A detached storage structure adds extra versatility, perfect for storage, hobbies, or workspace. Conveniently located near local schools, shopping, dining, and major roadways, this property offers both comfort and accessibility. Schedule your showing today and explore the possibilities this home has to offer!
-
2025-08-18$170,000 Active
-
2025-03-28price $175,000
-
2025-02-14$185,000 Active
-
1996-06-28soldstatus
ⓘ Source: listings_history table (triggers on properties + properties_extension) + one-shot
backfill from property_details.listing_events for pre-trigger history.
Tax reassessment forecast TX · Resets to sale price
- Current annual tax
- $2,617 · $218/mo
- Projected year-2 tax
- $3,020 · $252/mo
- Expected delta
- +$403/yr (+$34/mo · 15.4%)
ⓘ Screening estimate from a state-policy table — verify with the county assessor before closing.
Climate risk First Street
- Flood 4/10 Moderate FEMA zone X · 22% chance over 30 yrs
- Wildfire 6/10 Major
- Heat 9/10 Extreme 7 d/yr ≥112°F today · 22 d/yr by 30 yrs out
- Wind 8/10 Severe 99% chance of damaging wind over 30 yrs
- Air quality 2/10 Low 0 unhealthy d/yr today · 1 by 30 yrs out
Nearby sold comps map
Loading sold comps map…
Walkable amenities ~0.75 mi
Loading nearby amenities…
Taxation est. · year 1
- Rental income
- $18,119
- − Mortgage interest
- −$9,243
- − Property taxes
- −$2,617
- − Insurance
- −$825
- − Repairs & maintenance
- −$1,450
- − Management
- −$1,450
- − Depreciation
- −$4,800
- Taxable loss
- −$2,264
- Est. tax savings @ 24.0%
- +$543
- After-tax cash flow
- $1,033/yr
For passive investors: Depreciation is non-cash, so a rental often shows a tax loss while cash-flowing — sheltering income. Rental losses are passive: they offset passive income freely, and up to $25,000/yr can offset ordinary (W-2) income if you actively participate and your MAGI is under $100k (phasing out to $0 by $150k); unused losses carry forward. On sale, claimed depreciation is recaptured at up to 25%, and gains may owe capital-gains tax (a 1031 exchange can defer both). Figures are a year-1 estimate at your 24.0% rate — not tax advice; consult a CPA.
Schools (NCES district)
- District
- Mission CISD
- NCES district ID
- 4831040
- Math proficiency
- 15% ▼ -35.00%
- Reading proficiency
- 28% ▼ -15.00%
- Median HH income
- $32,855
- Composite
- 17.47/100
- National rank
- #9061
- State rank
- #775 of 826 in TX
Livability — Alton
- Score
- 58/100
- State rank
- #1230
- US rank
- #21479
Category grades
Schools grade is shown separately in the Schools card above.
Census & demographics
- Census place
- Alton, TX
- County
- Hidalgo County · 623,128 people
- City population
- 44,809
- Metro
- McAllen-Edinburg-Mission, TX
- Population (ZIP)
- 44,809
- Household income
- $55,000
- Rent vs Own
- Severe rent burden
- 855.0
Population outlook (Hidalgo County) Hauer SSP2
- Today (2025)
- 955,232 people
- By 2030
- 1,009,774 · +5.7%
- By 2040
- 1,120,332 · +17.3%
- By 2050
- 1,225,036 · +28.2%
- By 2075
- 1,439,189 · +50.7%
- By 2100
- 1,533,429 · +60.5%
Race, ethnicity, and origin ACS 2023
- Neighborhood character
- Predominantly Hispanic (96%)
- Race & ethnicity
- Hispanic / Latino 96% Two or more races 63% White 3%
- Hispanic origin (detail)
- Mexican 94%
- Foreign-born
- 28% · Canada
- Languages at home
- 12% English-only · Spanish 88%
Political lean MEDSL · Hidalgo
- 2024 margin
- Toss-up / Even · D 48.1% · R 51.0%
- 2008→2024 swing
- -41.6pp toward R · 2008: 38.7pp · 2024: -2.9pp
- All cycles
- 2024: R+2.9 2020: D+17.1 2016: D+40.5 2012: D+41.8 2008: D+38.7
Not yet ingested
- Civics
- —
Market trends
- HPI YoY
- ▲ 17.95%
- Current HPI
- 242.0711
- Rent YoY
- ▲ 2.45%
- Metro
- McAllen-Edinburg-Mission, TX
- State GDP YoY
- ▲ 3.95%
- F500 in state
- 110
Industry mix (Fortune 500 HQ in TX)
| Industry | F500 HQs | Revenue |
|---|---|---|
| Energy | 16 | $1,198B |
|
||
| Technology | 5 | $198B |
|
||
| Engineering / Construction | 4 | $72B |
|
||
| Energy Services | 3 | $60B |
|
||
| Utilities | 3 | $41B |
|
||
| Healthcare | 2 | $330B |
|
||
Price history
-10.8% since first listed5 events — show timeline
- 2026-04-11 Listed $165,000 MCALLENMLS
- 2025-08-18 Listed $170,000 MCALLENMLS
- 2025-03-28 Price Changed $175,000 MCALLENMLS
- 2025-02-14 Listed $185,000 MCALLENMLS
- 1996-06-28 Sold (Public Records) — Public Records
Property tax history
+8.4%/yrLatest (2025): $2,617 · +24.2% YoY. Source: county tax records.
Cash-flow waterfall
monthlySold comps — $/sqft
last 12 mo · ≤1 miLoading sold comps…