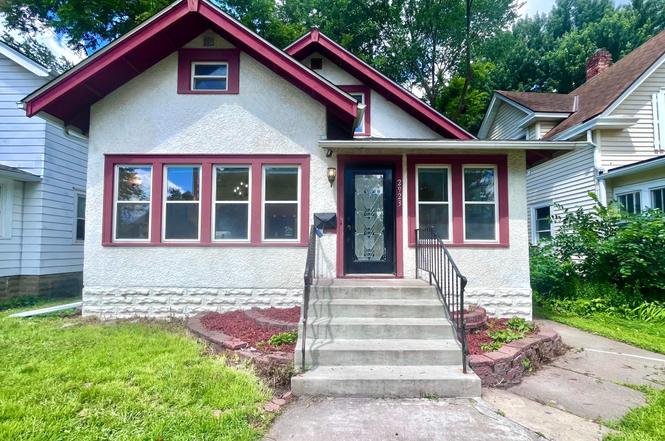
2923 Russell Ave N · Minneapolis, MN
Flood risk 4/10 · Minor
- FEMA flood zone
- X (unshaded)
- Chance of flooding over 30 yrs
- 0.22%
- Est. flood insurance / yr
- $473 – $860
Fire risk 1/10 · Minimal
- Est. fire insurance / yr
- $888 – $1,650
Heat risk 2/10 · Minimal
- Hot days now (above 99°F)
- 7 days/yr
- Hot days in 30 yrs
- 14 days/yr
Wind risk 2/10 · Minimal
- Chance of severe wind over 30 yrs
- —
Air-quality risk 2/10 · Minimal
- Unhealthy air days now
- 1 days/yr
- Unhealthy air days in 30 yrs
- 1 days/yr
Risk factors via First Street. Map © Google.
Why this score? — see what drove the D+ grade
The composite is a weighted blend of 9 inputs, each scored 0–100. Each bar is that input's sub-score; the figure is the points it added to the 100-point composite (weight × sub-score).
- Cash flow +15.9/30.0
- ARV discount +7.5/15.0
- DSCR +4.9/10.0
- 1% rule +4.6/10.0
- Rent growth +4.3/5.0
- Livability +3.9/5.0
- Schools +3.5/10.0
- Condition / age +2.5/5.0
- Appreciation +0.0/10.0
$275,000
🖨 Deal sheet 📄 Offer letter ✓ Due diligence
Listing remarks MLS
Don't be blinded by all the sunshine in this old world charmed home. Tons of natural light pours in to this ready made home. More than move in ready. Clean home priced to sell. Large family, multi-generational home, with a room for everyone. Updated open kitchen, egress lower level doubles as the 6th bedroom or family room. Wonderful entertaining deck in back highlights this fenced in yard. Don't miss the opportunity to give everyone their own room. No sign on property.
Key facts
- Natural woodwork
- Updated appliances
- Updated windows
Tags
Property features AI
Finance
- Other: Above-grade finished area reported; Below-grade finished area reported; Not a fractional ownership
- HOA & community: Rental license: Standard (rental license on file)
Exterior
- Parking: Detached or attached 1-car garage (approx. 10 x 22); Garage dimensions 10 x 22
- Utilities: City water connected; City sewer connected; Natural gas; Electric service with circuit breakers (Xcel Energy)
- Home design: Residential property; One level living (main floor primary and several main-level rooms); Entry facing not specified
- Construction: Built with block and frame construction; Asphalt roof; Block foundation (foundation dimensions approx. 44 x 24)
- Exterior features: Deck; Stucco exterior; Chain link fencing; Light tree coverage; Public transit within six blocks; City street frontage, public maintained road; Lot dimensions approximately 40 x 128
Interior
- Kitchen: Dishwasher; Range; Refrigerator; Stainless steel appliances
- Bedrooms: 6 bedrooms total; Main level: primary bedroom, bedroom, bedroom (two rooms noted on main level); Upper level: three bedrooms (including Bedroom 3, Bedroom 4, Bedroom 5); Lower level: additional bedroom/office possibilities
- Flooring: Hardwood floors
- Bathrooms: One full bath on the main floor; One half bath in the basement
- Heating & cooling: Forced air heating; Baseboard heating; Central air conditioning
- Interior features: Finished full basement; Finished lower-level family room; Informal dining room; Ceiling fan(s); Kitchen window; Main-floor primary bedroom; 3 bedrooms on one level
- Laundry & utility: Washer and dryer; Laundry located in basement
Neighborhood map
What this means for you Summary
Snapshot
- This is a 4-bed/3.0-bath single-family listed at $275k.
Deal economics
- At list price, monthly cash flow is $129 ($2k/yr) — positive.
- The deal already cash-flows at list — no discount required.
- To meet the 1% rule (rent ≥ 1% of price), the offer needs to be $265k (3.7% below list).
- Recommended offer: $265k (3.7% below list) — sets the bar for 1% rule.
- Cap rate 6.9% vs local median 3.1% in Minneapolis — top-decile yield for the area; either an underpriced asset or a hidden risk that comps aren't pricing in. Stress-test before assuming the spread holds.
Location & tenants
- Location reads 78/100 on livability (#110 in MN, #2,525 nationally) — a middle-class / working-renter tenant base. Strengths: amenities A+, commute A+, housing A+; Watch: cost of living C-, crime F.
- Minneapolis Public School District (urban): math 35% / reading 46% proficiency, ranked #217 of 301 in MN (top 72%) — families likely to look elsewhere, expect single-tenant / working-renter base with shorter leases.
- Market conditions: Rents rising fast (+7.3%/yr); 132 active listings in the ZIP; 9 comparable units currently listed for rent nearby; rentals at typical pace (median 22d on market — plan ~3-4 weeks tenant-placement turnaround); 4,651 units permitted in Hennepin County in 2024 (2,443 in 5+ unit buildings).
- At $2,648/mo this rent would consume 53% of the median local household income ($60k/yr) (locally 1826% of renters already pay >50% of income on rent) — very limited rent-growth headroom before tenants either downsize or default.
Forward outlook
- Local home prices are declining (-3.0%/yr); year-one equity from $2k of loan paydown is wiped out by about $8k of value loss. Plan a longer hold.
- Hennepin County population projected at +30% by 2050 — long-run rental-demand tailwind backs the buy-and-hold thesis.
Negotiation context
- Only 1 days on market — expect competitive offers; lowballing is unlikely to land.
- 9 sale attempts since 23y ago with the ask held roughly flat each time — persistent listings suggest the price (not the market) is what's stuck; bring a comps-based counter.
- Current owner paid $220k; 25% above their basis — modest negotiation headroom, anchor on the comps not their cost.
Risks & watch-outs
- Watch-outs: built in 1922 — expect roof / HVAC / electrical / plumbing capex.
Questions for the listing agent
- Built in 1922 — when were the roof, HVAC, electrical panel, plumbing, and water heater last replaced?
- Is there a deadline driving the sale (1031 exchange, divorce, estate, relocation)? That informs how much negotiation room exists.
- Crime grade is F in this area — have there been break-ins, vandalism, or insurance claims at this property in the last 3 years? What carrier currently insures it and at what premium?
- The area grade is low — what's the realistic commute time and amenity access for the typical tenant pool here? Any planned neighborhood developments (good or bad) we should know about?
- What's the average days-on-market for RENTAL listings here right now (not sales)? A rising rental-DOM trend means longer vacancies and softer asking-rent achievability than the comps imply.
- What's the recent tenant-quality profile in this submarket — average credit score on applications, eviction rate, late-payment / NSF rate, and stable-employment percentage? A property-management company in the area should have these aggregated.
- How much new for-sale + rental construction is in the pipeline within 1–3 miles? Heavy new supply typically softens prices + rents 12–24 months out; constrained supply supports both.
Investment metrics
- 1% rule
- 0.96% ✗
- Cap rate
- 6.85%
- Cash-on-cash
- 2.00%
- DSCR
- 1.09
- GRM
- 8.7
CMA / ARV
No comps found within radius.
Projected returns pro-forma
-3.0% appreciation · 7.35% rent growth · sell at horizon
- IRR
- -8.2%
- Equity multiple
- 0.69×
- Total profit
- $-24,199
- Equity at exit
- $41,003
- IRR
- 6.4%
- Equity multiple
- 1.57×
- Total profit
- $44,103
- Equity at exit
- $23,777
Cash invested: $77,000 (down + closing). Projections, not guarantees.
Landlord ↔ Tenant lean methodology
- Overall (CITY)
- 34 Tenant-Leaning
- State Minnesota
- 46 Balanced · D+2
- County
- — inherits STATE
- City Minneapolis
- 34 Tenant-Leaning · D+50
ZIP-level market 55411
- Home prices YoY
- -8.7%
- Rents YoY
- 7.3%
- Active inventory
- 132
- Price-to-rent
- 8.7×
Monthly cashflow live
- Estimated rent
- $2,648 high interval (Pro) →
- Mortgage (P&I)
- −$1,442
- Tax from tax record
- −$407 /mo · $4,882/yr
- Insurance
- −$115
- HOA
- −$0
- Vacancy / Maint / Mgmt
- −$556
- Net cashflow
- $129
Break-even live
UW: 25.0% down · 7.5% · 30yr · 1.5% tax · 5.0% vac · 8.0% maint · 8.0% mgmt
Financing live
Cash to close
- Down payment
- $68,750
- Closing costs
- $8,250
- Reserves months
- —
- Total cash needed
- —
Loan-product check · same deal, 3 products live
Conventional
25% down · 7.5% · 30yr
- Down + closing
- —
- Monthly P&I
- —
- Monthly cashflow
- —
- DSCR
- —
- Eligible?
- —
Personal DTI + credit; lowest rate.
DSCR
20% down · 8.5% · 30yr
- Down + closing
- —
- Monthly P&I
- —
- Monthly cashflow
- —
- DSCR
- —
- Eligible?
- —
No personal income docs; deal must DSCR.
Hard money
10% down · 12.0% · 12mo
- Down + closing
- —
- Monthly P&I
- —
- Monthly cashflow
- —
- DSCR
- —
- Eligible?
- —
Short-term bridge; refi at stabilization.
Rent comps 9 comps
| Address | Beds | Baths | Sqft | Rent | $/sqft | DOM | Units | Dist |
|---|---|---|---|---|---|---|---|---|
| 2923 Girard Ave N Minneapolis, MN | 5.0 | 2.0 | 1760 | $2,795 | $1.59 | 21d | 1 | 0.68mi |
| 2819 Girard Ave N Minneapolis, MN | 5.0 | 2.0 | 1718 | $2,300 | $1.34 | 43d | 1 | 0.68mi |
| 1113 N 25th Ave Minneapolis, MN | 5.0 | 2.0 | 2295 | $2,695 | $1.17 | 17d | 1 | 0.88mi |
| 3342 Fremont Ave N Unit 2 Minneapolis, MN | 4.0 | 2.0 | 2000 | $2,200 | $1.10 | 24d | 1 | 0.88mi |
| 1414 Golden Valley Rd Unit 2 Minneapolis, MN | 5.0 | 2.0 | 2000 | $2,595 | $1.30 | 43d | 1 | 0.97mi |
| 1504 Queen Ave N Minneapolis, MN | 3.0 | 1.5 | 1746 | $2,800 | $1.60 | 1d | 1 | 1.09mi |
| 2643 Lyndale Ave N Minneapolis, MN | 4.0 | 2.0 | 2198 | $750 | $0.34 | 16d | 1 | 1.13mi |
| 3935 Fremont Ave N Minneapolis, MN | 4.0 | 1.0 | 1900 | $2,595 | $1.37 | 43d | 1 | 1.38mi |
| 1239 Knox Ave N Minneapolis, MN | 4.0 | 1.0 | 1944 | $2,400 | $1.23 | 3d | 1 | 1.38mi |
Listing history 2 events
-
2026-06-19remarks 693-char remark
-
2026-06-19$275,000 Coming Soon 1 DOM
ⓘ Source: listings_history table (triggers on properties + properties_extension) + one-shot
backfill from property_details.listing_events for pre-trigger history.
Tax reassessment forecast MN · Partial reset (capped growth)
- Current annual tax
- $4,882 · $407/mo
- Projected year-2 tax
- $4,882 · $407/mo
- Expected delta
- $0/yr ($0/mo · 0.0%)
ⓘ Screening estimate from a state-policy table — verify with the county assessor before closing.
Climate risk First Street
- Flood 4/10 Moderate FEMA zone X (unshaded) · 22% chance over 30 yrs
- Wildfire 1/10 Low
- Heat 2/10 Low 7 d/yr ≥99°F today · 14 d/yr by 30 yrs out
- Wind 2/10 Low
- Air quality 2/10 Low 1 unhealthy d/yr today · 1 by 30 yrs out
Nearby sold comps map
Loading sold comps map…
Walkable amenities ~0.75 mi
Loading nearby amenities…
Taxation est. · year 1
- Rental income
- $31,779
- − Mortgage interest
- −$15,404
- − Property taxes
- −$4,882
- − Insurance
- −$1,375
- − Repairs & maintenance
- −$2,542
- − Management
- −$2,542
- − Depreciation
- −$8,000
- Taxable loss
- −$2,968
- Est. tax savings @ 24.0%
- +$712
- After-tax cash flow
- $2,254/yr
For passive investors: Depreciation is non-cash, so a rental often shows a tax loss while cash-flowing — sheltering income. Rental losses are passive: they offset passive income freely, and up to $25,000/yr can offset ordinary (W-2) income if you actively participate and your MAGI is under $100k (phasing out to $0 by $150k); unused losses carry forward. On sale, claimed depreciation is recaptured at up to 25%, and gains may owe capital-gains tax (a 1031 exchange can defer both). Figures are a year-1 estimate at your 24.0% rate — not tax advice; consult a CPA.
Schools (NCES district)
- District
- Minneapolis Public School District
- NCES district ID
- 2721240
- Math proficiency
- 35% ▼ -7.00%
- Reading proficiency
- 46% ▼ -1.00%
- Median HH income
- $50,521
- Composite
- 34.92/100
- National rank
- #5067
- State rank
- #217 of 301 in MN
Livability — Minneapolis
- Score
- 78/100
- State rank
- #110
- US rank
- #2525
Category grades
Schools grade is shown separately in the Schools card above.
Census & demographics
- Census place
- Minneapolis, MN
- County
- Hennepin County · 1,150,272 people
- City population
- 417,555
- Metro
- Minneapolis-St. Paul-Bloomington, MN-WI
- Population (ZIP)
- 27,741
- Household income
- $60,225
- Rent vs Own
- Severe rent burden
- 1826.0
Population outlook (Hennepin County) Hauer SSP2
- Today (2025)
- 1,405,227 people
- By 2030
- 1,492,650 · +6.2%
- By 2040
- 1,660,157 · +18.1%
- By 2050
- 1,823,498 · +29.8%
- By 2075
- 2,221,283 · +58.1%
- By 2100
- 2,509,976 · +78.6%
Race, ethnicity, and origin ACS 2023
- Neighborhood character
- Diverse neighborhood (Simpson 0.68)
- Race & ethnicity
- Black 49% White 23% Two or more races 11% Hispanic / Latino 11% Asian 9%
- Hispanic origin (detail)
- Mexican 7% Puerto Rican 1%
- Common ancestry
- Portuguese 3% Lithuanian 2% Italian 1%
- Foreign-born
- 19% · Canada, Guatemala
- Languages at home
- 68% English-only · Other Asian/Pacific 8% Spanish 8%
Political lean MEDSL · Hennepin
- 2024 margin
- Solid D (+42.6) · D 70.2% · R 27.5% · Other 2.3%
- 2008→2024 swing
- +14.0pp toward D · 2008: 28.6pp · 2024: 42.6pp
- All cycles
- 2024: D+42.6 2020: D+43.2 2016: D+35.3 2012: D+27.1 2008: D+28.6
Not yet ingested
- Civics
- —
Market trends
- HPI YoY
- ▼ -33.91%
- Current HPI
- 356.6758
- Rent YoY
- ▲ 7.35%
- Metro
- Minneapolis-St. Paul-Bloomington, MN-WI
- State GDP YoY
- ▲ 2.41%
- F500 in state
- 34
Industry mix (Fortune 500 HQ in MN)
| Industry | F500 HQs | Revenue |
|---|---|---|
| Healthcare | 2 | $407B |
|
||
| Retail | 2 | $150B |
|
||
| Consumer Goods | 2 | $32B |
|
||
| Industrial Machinery | 2 | $6B |
|
||
| Agriculture | 1 | $40B |
|
||
| Healthcare / Medical Devices | 1 | $32B |
|
||
Price history
+293.4% since first listed27 events — show timeline
- 2026-06-19 Listed $275,000 NORTHSTARMLS as Distributed by MLS Grid
- 2026-06-18 Coming Soon $275,000 NORTHSTARMLS as Distributed by MLS Grid
- 2025-06-22 Rental Removed $2,500 SHOWMOJO
- 2025-05-21 Price Changed $2,500 SHOWMOJO
- 2025-05-09 Price Changed $2,650 SHOWMOJO
- 2025-05-05 Listed for Rent $2,750 SHOWMOJO
- 2025-05-05 Rental Removed $2,750 SHOWMOJO2
- 2025-05-01 Rental Removed $2,750 SHOWMOJO
- 2025-05-01 Listed for Rent $2,750 SHOWMOJO2
- 2025-04-24 Listed for Rent $2,750 SHOWMOJO
- 2025-04-19 Rental Removed $2,750 SHOWMOJO
- 2025-03-13 Listed for Rent $2,750 SHOWMOJO
- 2018-07-27 Sold (Public Records) $220,000 Public Records
- 2018-07-24 Sold (MLS) $220,000 NORTHSTARMLS as Distributed by MLS Grid
- 2018-05-29 Pending — NORTHSTARMLS as Distributed by MLS Grid
- 2018-05-17 Contingent — NORTHSTARMLS as Distributed by MLS Grid
- 2018-05-15 Listed $199,800 NORTHSTARMLS as Distributed by MLS Grid
- 2008-09-25 Listing Removed — NORTHSTARMLS as Distributed by MLS Grid
- 2007-09-30 Listed $169,900 NORTHSTARMLS as Distributed by MLS Grid
- 2004-09-10 Sold (Public Records) $164,600 Public Records
- 2004-06-15 Sold (MLS) $164,600 NORTHSTARMLS as Distributed by MLS Grid
- 2004-05-24 Listing Removed — NORTHSTARMLS as Distributed by MLS Grid
- 2004-04-30 Listed $164,900 NORTHSTARMLS as Distributed by MLS Grid
- 2004-04-22 Listing Removed — NORTHSTARMLS as Distributed by MLS Grid
- 2003-07-02 Listed $164,900 NORTHSTARMLS as Distributed by MLS Grid
- 1995-08-03 Sold (Public Records) $70,000 Public Records
- 1995-07-21 Sold (Public Records) $69,900 Public Records
Property tax history
+8.7%/yrLatest (2025): $4,882 · +15.5% YoY. Source: county tax records.
Cash-flow waterfall
monthlySold comps — $/sqft
last 12 mo · ≤1 miLoading sold comps…