850 W Mission Blvd Unit A46 · Ontario, CA
Flood risk 1/10 · Minimal
- FEMA flood zone
- X (unshaded)
- Chance of flooding over 30 yrs
- 0.0%
- Est. flood insurance / yr
- $507 – $1,088
Fire risk 1/10 · Minimal
- Est. fire insurance / yr
- $659 – $1,223
Heat risk 7/10 · Major
- Hot days now (above 100°F)
- 6 days/yr
- Hot days in 30 yrs
- 18 days/yr
Wind risk 1/10 · Minimal
- Chance of severe wind over 30 yrs
- —
Air-quality risk 8/10 · Major
- Unhealthy air days now
- 16 days/yr
- Unhealthy air days in 30 yrs
- 19 days/yr
Risk factors via First Street. Map © Google.
Why this score? — see what drove the B grade
The composite is a weighted blend of 9 inputs, each scored 0–100. Each bar is that input's sub-score; the figure is the points it added to the 100-point composite (weight × sub-score).
- Cash flow +30.0/30.0
- 1% rule +10.0/10.0
- DSCR +10.0/10.0
- ARV discount +7.5/15.0
- Schools +3.7/10.0
- Rent growth +3.2/5.0
- Livability +3.2/5.0
- Condition / age +2.5/5.0
- Appreciation +0.0/10.0
$74,900
🖨 Deal sheet 📄 Offer letter ✓ Due diligence
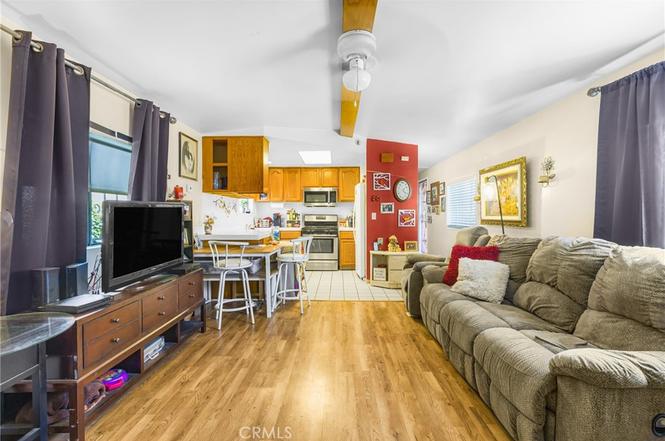
Listing remarks
Motivated Seller!!!! Possible furniture included! Welcome to this charming 2-bedroom, 2-bath single-wide home located in an all-age land lease community of Grove Manor. Designed for comfort and privacy, this layout features a bedroom and full bathroom on each end of the home—ideal for families, guests, or roommates. The open living room and kitchen area including double wide refrigerator, creates a welcoming space for everyday living and entertaining. Enjoy the convenience of an in-unit washer and dryer, plus a private fenced patio in the back—perfect for outdoor dining, gardening, or relaxing and large exterior storage unit attached. This home offers affordability, functionalit
Key facts
- Private fenced patio
- Community pool
- Built 1986
Tags
Property features AI
Finance
- Other: Lot characterized as 0-1 unit per acre; Elevation measured in feet
- Financial info: Monthly land lease approximately $1,200 (park-provided)
- HOA & community: Park name: Grove Manor; Manager approval required; Land lease from park
Exterior
- Parking: Assigned parking; Guest parking available
- Utilities: Public sewer; District/public water
- Home design: Single-story property; Mobile home remains on site; Estimated year built
- Construction: Mobile home dimensions approximately 14 ft by 56 ft; Estimated living area source
- Exterior features: Covered patio; Patio; Community pool; Park within the community
Interior
- Kitchen: Gas range; Dishwasher
- Bedrooms: All bedrooms located on the main level
- Bathrooms: 2 full bathrooms
- Heating & cooling: Central cooling; Central furnace heating
- Interior features: Single-level home with all bedrooms on the ground floor; Front door entry
- Laundry & utility: Inside laundry
Neighborhood map
What this means for you Summary
Snapshot
- This is a 2-bed/1.5-bath manufactured listed at $75k.
Deal economics
- At list price, monthly cash flow is $1k ($15k/yr) — positive.
- The deal already cash-flows at list — no discount required.
- Meets the 1% rule at list price ($2k rent vs $75k).
- Recommended offer: $66k (12.0% below list) — sets the bar for market timing.
- Cap rate 26.9% vs local median 2.7% in Ontario — top-decile yield for the area; either an underpriced asset or a hidden risk that comps aren't pricing in. Stress-test before assuming the spread holds.
Location & tenants
- Location reads 63/100 on livability (#435 in CA) — a middle-class / working-renter tenant base. Strengths: commute A-, housing B+; Watch: schools F, cost of living F, health & safety F.
- Ontario-Montclair (urban): math 35% / reading 44% proficiency, ranked #731 of 1,400 in CA (top 52%) — families likely to look elsewhere, expect single-tenant / working-renter base with shorter leases; 75% free/reduced lunch — lower-income household profile, screen leases tightly.
- Market conditions: Rents rising (+3.0%/yr); 217 active listings in the ZIP; 40 comparable units currently listed for rent nearby; rentals leasing fast (median 2d on market — plan ~1-2 weeks tenant-placement turnaround); solid renter incomes; 5,458 units permitted in San Bernardino County in 2024 (1,500 in 5+ unit buildings).
- This rent runs 33% of the median local income ($84k/yr) — at the standard rent-burdened threshold; future hikes will face affordability resistance.
Forward outlook
- Local home prices are declining (-3.0%/yr); year-one equity from $518 of loan paydown is wiped out by about $2k of value loss. Plan a longer hold.
- San Bernardino County population projected at +15% by 2050 — modest demand growth; plan on rents tracking national, not racing it.
- At projected returns (-3.0% appreciation + 3.0% rent growth), your $21k cash investment doubles in ~2 years — after that, you're playing with house money.
Negotiation context
- It's been on market 142 days — a 12% lower offer ($66k) is reasonable based on typical stale-listing flexibility.
- 8 sale attempts since 11y ago; this cycle's ask has dropped $24k (24%) from the opening price — seller is motivated, your offer sets the floor, not the list.
- Current owner paid $18k; list at $75k implies a 316% gain — meaningful room to come down on a strong offer.
Risks & watch-outs
- Climate carrying-cost: extreme-heat days projected 6→18/yr by 2055 (HVAC capex compounding) — expect insurance premiums to compound above CPI over the hold.
Questions for the listing agent
- It's been on market 142 days. Have you received any prior offers? Is the seller open to a 12% concession, seller financing, or rate buy-down credit?
- Why hasn't it sold? Are there any deal-killer items the seller is aware of (foundation, flood, title, zoning, code violations)?
- Is there a deadline driving the sale (1031 exchange, divorce, estate, relocation)? That informs how much negotiation room exists.
- Schools are F-rated, which usually means shorter tenancies and higher turnover. Who's the typical renter profile here, and what's been the actual vacancy rate?
- What's the average days-on-market for RENTAL listings here right now (not sales)? A rising rental-DOM trend means longer vacancies and softer asking-rent achievability than the comps imply.
- What's the recent tenant-quality profile in this submarket — average credit score on applications, eviction rate, late-payment / NSF rate, and stable-employment percentage? A property-management company in the area should have these aggregated.
- How much new for-sale + rental construction is in the pipeline within 1–3 miles? Heavy new supply typically softens prices + rents 12–24 months out; constrained supply supports both.
Investment metrics
- 1% rule
- 3.05% ✓
- Cap rate
- 26.94%
- Cash-on-cash
- 73.73%
- DSCR
- 4.28
- GRM
- 2.7
CMA / ARV
No comps found within radius.
Projected returns pro-forma
-3.0% appreciation · 2.97% rent growth · sell at horizon
- IRR
- 73.5%
- Equity multiple
- 4.33×
- Total profit
- $69,901
- Equity at exit
- $11,168
- IRR
- 77.3%
- Equity multiple
- 8.93×
- Total profit
- $166,406
- Equity at exit
- $6,476
Cash invested: $20,972 (down + closing). Projections, not guarantees.
Landlord ↔ Tenant lean methodology
- Overall (STATE)
- 18 Strongly Tenant-Friendly
- State California
- 18 Strongly Tenant-Friendly · D+13
- County
- — inherits STATE
- City
- — inherits STATE
ZIP-level market 91762
- Rents YoY
- 3.0%
- Active inventory
- 217
- Price-to-rent
- 2.7×
Monthly cashflow live
- Estimated rent
- $2,286 high interval (Pro) →
- Mortgage (P&I)
- −$393
- Tax est. 1.5%
- −$94 /mo · $1,124/yr
- Insurance
- −$31
- HOA
- −$0
- Vacancy / Maint / Mgmt
- −$480
- Net cashflow
- $1,289
Break-even live
UW: 25.0% down · 7.5% · 30yr · 1.5% tax · 5.0% vac · 8.0% maint · 8.0% mgmt
Financing live
Cash to close
- Down payment
- $18,725
- Closing costs
- $2,247
- Reserves months
- —
- Total cash needed
- —
Loan-product check · same deal, 3 products live
Conventional
25% down · 7.5% · 30yr
- Down + closing
- —
- Monthly P&I
- —
- Monthly cashflow
- —
- DSCR
- —
- Eligible?
- —
Personal DTI + credit; lowest rate.
DSCR
20% down · 8.5% · 30yr
- Down + closing
- —
- Monthly P&I
- —
- Monthly cashflow
- —
- DSCR
- —
- Eligible?
- —
No personal income docs; deal must DSCR.
Hard money
10% down · 12.0% · 12mo
- Down + closing
- —
- Monthly P&I
- —
- Monthly cashflow
- —
- DSCR
- —
- Eligible?
- —
Short-term bridge; refi at stabilization.
Rent comps 40 comps
| Address | Beds | Baths | Sqft | Rent | $/sqft | DOM | Units | Dist |
|---|---|---|---|---|---|---|---|---|
| 831 Carlton Privado Ontario, CA | 2.0 | 2.5 | 1093 | $2,600 | $2.38 | 1d | 1 | 0.17mi |
| 1001 W Mission Blvd Ontario, CA | 1.0 | 1.0 | 717 | $2,088 | $2.91 | 1d | 3 | 0.26mi |
| 1112 S Cypress Ave Ontario, CA | 2.0 | 1.5–2.5 | 1082 | $2,675 | $2.47 | 1d | 2 | 0.36mi |
| 959 S Mountain Ave Ontario, CA | 2.0 | 1.0 | 1092 | $2,095 | $1.92 | 1d | 1 | 0.40mi |
| 904 S Mountain Ave Unit B Ontario, CA | 2.0 | 1.5 | 960 | $2,550 | $2.66 | 1d | 1 | 0.42mi |
| 1198 S San Antonio Ave Unit 10 Ontario, CA | 2.0 | 2.0 | 872 | $1,800 | $2.06 | 1d | 1 | 0.43mi |
| 1198 S San Antonio Ave Unit 22 Ontario, CA | 2.0 | 1.0 | 749 | $1,895 | $2.53 | 16d | 1 | 0.43mi |
| 1200 S San Antonio Ave Unit 17 Ontario, CA | 2.0 | 2.0 | 872 | $1,800 | $2.06 | 1d | 1 | 0.46mi |
| 829 S Magnolia Ave Ontario, CA | 2.0 | 1.5 | 1100 | $2,550 | $2.32 | 1d | 1 | 0.46mi |
| 910 W Phillips St Ontario, CA | 2.0 | 1.0–2.0 | 942 | $2,490 | $2.64 | 1d | 1 | 0.49mi |
| 1120 Bahia Ct Unit B Ontario, CA | 3.0 | 1.0 | 1095 | $3,195 | $2.92 | 1d | 1 | 0.56mi |
| 625 W Vesta St Ontario, CA | 1.0–2.0 | 1.0–2.0 | 722 | $2,295 | $3.18 | 1d | 1 | 0.61mi |
| 311 N Beverly Ct Ontario, CA | 2.0 | 1.0 | 770 | $1,950 | $2.53 | 21d | 1 | 0.65mi |
| 313 N Beverly Ct Ontario, CA | 2.0 | 1.0 | 770 | $1,900 | $2.47 | 1d | 1 | 0.66mi |
| 1052 W Quince St Ontario, CA | 3.0 | 2.0 | 1040 | $2,900 | $2.79 | 1d | 1 | 0.70mi |
| 221 N Mountain Ave Unit 18 Ontario, CA | 1.0 | 1.0 | 819 | $2,400 | $2.93 | 1d | 1 | 0.70mi |
| 605 W D St Unit A Ontario, CA | 1.0 | 1.0 | 983 | $1,795 | $1.83 | 1d | 1 | 0.74mi |
| 1210 W Stoneridge Ct Unit 19 Ontario, CA | 1.0 | 1.0 | 576 | $1,600 | $2.78 | 10d | 1 | 0.74mi |
| 1210 W Stoneridge Ct Unit 26 Ontario, CA | 2.0 | 1.0 | 800 | $1,950 | $2.44 | 1d | 1 | 0.74mi |
| 1015 W E St Unit F Ontario, CA | 2.0 | 1.0 | 800 | $1,925 | $2.41 | 1d | 1 | 0.77mi |
| 1260 W Stoneridge Ct Unit 2 Ontario, CA | 1.0 | 1.0 | 600 | $1,595 | $2.66 | 1d | 1 | 0.81mi |
| 1336 W Stoneridge Ct Ontario, CA | 2.0 | 1.0 | 800 | $2,095 | $2.62 | 1d | 1 | 0.87mi |
| 1356 W Stoneridge Ct Unit 5 Ontario, CA | 1.0 | 1.0 | 635 | $1,825 | $2.87 | 1d | 1 | 0.90mi |
| 210 W D St Unit 216 Ontario, CA | 2.0 | 1.0 | 600 | $1,695 | $2.83 | 1d | 1 | 0.95mi |
| 216 W D St Ontario, CA | 2.0 | 1.0 | 600 | $1,695 | $2.83 | 1d | 1 | 0.96mi |
| 200 E Phillips St Unit 202 Ontario, CA | 2.0 | 1.0 | 720 | $2,000 | $2.78 | 1d | 1 | 0.96mi |
| 1455 W Stoneridge Ct Unit 1 Ontario, CA | 2.0 | 1.0 | 850 | $2,100 | $2.47 | 17d | 1 | 0.99mi |
| 543 W G St Ontario, CA | 2.0 | 2.0 | 900 | $2,900 | $3.22 | 1d | 1 | 0.99mi |
| 320 N Euclid Ave Ontario, CA | 1.0–2.0 | 1.0–2.0 | 1005 | $3,034 | $3.02 | 1d | 8 | 1.01mi |
| 501 W G St Unit 633N Ontario, CA | 2.0 | 1.0 | 850 | $2,045 | $2.41 | 3d | 2 | 1.03mi |
| 501 W G St Unit 627 Ontario, CA | 2.0 | 1.0 | 850 | $1,995 | $2.35 | 1d | 1 | 1.05mi |
| 501 W G St Unit 503 Ontario, CA | 2.0 | 1.0 | 850 | $2,095 | $2.46 | 1d | 1 | 1.05mi |
| 1459 S Euclid Ave Unit 8 Ontario, CA | 3.0 | 1.0 | 1000 | $2,500 | $2.50 | 23d | 1 | 1.09mi |
| 1616 S Euclid Ave Unit C Ontario, CA | 2.0 | 1.0 | 830 | $2,350 | $2.83 | 1d | 1 | 1.13mi |
| 1377 S Sultana Ave Ontario, CA | 2.0 | 1.0 | 780 | $2,800 | $3.59 | 1d | 1 | 1.20mi |
| 1415 S Sultana Ave Ontario, CA | 2.0 | 1.0 | 980 | $2,900 | $2.96 | 2d | 1 | 1.21mi |
| 1135 W I St Ontario, CA | 2.0 | 1.5 | 840 | $2,050 | $2.44 | 1d | 1 | 1.23mi |
| 10228 Benson Ave Montclair, CA | 2.0 | 1.0 | 880 | $2,800 | $3.18 | 10d | 1 | 1.25mi |
| 233 W I St Unit 1 Ontario, CA | 2.0 | 1.0 | 900 | $2,600 | $2.89 | 14d | 1 | 1.32mi |
| 1204 W J St Unit 3 Ontario, CA | 2.0 | 2.0 | 850 | $2,000 | $2.35 | 14d | 1 | 1.42mi |
Listing history 39 events
-
2026-06-18days on market $74,900 Active 142 DOM
-
2026-06-17days on market $74,900 Active 141 DOM
-
2026-06-16days on market $74,900 Active 140 DOM
-
2026-06-15days on market $74,900 Active 139 DOM
-
2026-06-13days on market $74,900 Active 137 DOM
-
2026-06-13days on market $74,900 Active 136 DOM
-
2026-06-09days on market $74,900 Active 133 DOM
-
2026-06-08days on market $74,900 Active 132 DOM
-
2026-06-07days on market $74,900 Active 131 DOM
-
2026-06-04days on market $74,900 Active 128 DOM
-
2026-06-03days on market $74,900 Active 127 DOM
-
2026-06-02days on market $74,900 Active 126 DOM
-
2026-06-01days on market $74,900 Active 125 DOM
-
2026-05-31price $74,900 Active 124 DOM
-
2026-05-31days on market $79,900 Active 124 DOM
-
2026-04-30price $79,900
-
2026-04-06price $84,900
-
2026-03-10price $89,900
-
2026-02-20price $94,500
-
2026-01-27$98,500 Active
-
2025-11-02price $84,500
-
2025-10-23price $89,900
-
2025-10-15price $90,900
-
2025-10-06$95,500 Active
-
2025-03-10status Active
-
2025-02-09status Active
-
2025-01-11status Active
-
2024-12-09status Active
-
2024-08-22price $89,999
-
2024-06-28$95,000 Active
-
2024-06-14historical
-
2015-11-02historical
-
2015-11-02soldstatus $18,000 Closed Sale
-
2015-10-02status Pending Sale
-
2015-09-19price $20,000
-
2015-09-02price $25,000
-
2015-07-01price $30,000
-
2015-04-28price $37,000
-
2015-03-22$40,000 Active
ⓘ Source: listings_history table (triggers on properties + properties_extension) + one-shot
backfill from property_details.listing_events for pre-trigger history.
Climate risk First Street
- Flood 1/10 Low FEMA zone X (unshaded) · 0% chance over 30 yrs
- Wildfire 1/10 Low
- Heat 7/10 Severe 6 d/yr ≥100°F today · 18 d/yr by 30 yrs out
- Wind 1/10 Low
- Air quality 8/10 Severe 16 unhealthy d/yr today · 19 by 30 yrs out
Nearby sold comps map
Loading sold comps map…
Walkable amenities ~0.75 mi
Loading nearby amenities…
Taxation est. · year 1
- Rental income
- $27,436
- − Mortgage interest
- −$4,196
- − Property taxes
- −$1,124
- − Insurance
- −$374
- − Repairs & maintenance
- −$2,195
- − Management
- −$2,195
- − Depreciation
- −$2,179
- Taxable income
- $15,174
- Est. tax owed @ 24.0%
- −$3,642
- After-tax cash flow
- $11,822/yr
For passive investors: Depreciation is non-cash, so a rental often shows a tax loss while cash-flowing — sheltering income. Rental losses are passive: they offset passive income freely, and up to $25,000/yr can offset ordinary (W-2) income if you actively participate and your MAGI is under $100k (phasing out to $0 by $150k); unused losses carry forward. On sale, claimed depreciation is recaptured at up to 25%, and gains may owe capital-gains tax (a 1031 exchange can defer both). Figures are a year-1 estimate at your 24.0% rate — not tax advice; consult a CPA.
Schools (NCES district)
- District
- Ontario-Montclair
- NCES district ID
- 0628470
- Math proficiency
- 35% ▲ 4.00%
- Reading proficiency
- 44% ▲ 2.00%
- Median HH income
- $50,668
- Composite
- 36.57/100
- National rank
- #9282
- State rank
- #731 of 1400 in CA
Livability — Ontario
- Score
- 63/100
- State rank
- #435
- US rank
- #14949
Category grades
Schools grade is shown separately in the Schools card above.
Census & demographics
- Census place
- Ontario, CA
- County
- San Bernardino County · 2,030,291 people
- City population
- 183,440
- Metro
- Riverside-San Bernardino-Ontario, CA
- Population (ZIP)
- 64,235
- Household income
- $83,850
- Rent vs Own
- Severe rent burden
- 2644.0
Population outlook (San Bernardino County) Hauer SSP2
- Today (2025)
- 2,300,329 people
- By 2030
- 2,378,907 · +3.4%
- By 2040
- 2,523,137 · +9.7%
- By 2050
- 2,642,388 · +14.9%
- By 2075
- 2,880,769 · +25.2%
- By 2100
- 2,909,436 · +26.5%
Race, ethnicity, and origin ACS 2023
- Neighborhood character
- Predominantly Hispanic (69%)
- Race & ethnicity
- Hispanic / Latino 69% Two or more races 26% White 14% Asian 10% Black 5% Native American 1%
- Hispanic origin (detail)
- Mexican 58%
- Common ancestry
- Iranian 1%
- Foreign-born
- 30% · Canada, China, Vietnam
- Languages at home
- 43% English-only · Spanish 49% Chinese 3% Tagalog/Filipino 2%
Political lean MEDSL · San Bernardino
- 2024 margin
- Toss-up / Even · D 47.5% · R 49.7% · Other 2.8%
- 2008→2024 swing
- -8.5pp toward R · 2008: 6.3pp · 2024: -2.1pp
- All cycles
- 2024: R+2.1 2020: D+10.7 2016: D+9.8 2012: D+5.4 2008: D+6.3
Not yet ingested
- Civics
- —
Market trends
- HPI YoY
- ▼ -654.08%
- Current HPI
- 479.3773
- Rent YoY
- ▲ 2.97%
- Metro
- Riverside-San Bernardino-Ontario, CA
- State GDP YoY
- ▲ 3.21%
- F500 in state
- 116
Industry mix (Fortune 500 HQ in CA)
| Industry | F500 HQs | Revenue |
|---|---|---|
| Technology | 27 | $1,492B |
|
||
| Financial Services | 3 | $174B |
|
||
| Retail | 3 | $44B |
|
||
| Insurance | 3 | $26B |
|
||
| Media / Entertainment | 2 | $115B |
|
||
| Pharmaceuticals / Biotech | 2 | $62B |
|
||
Price history
+99.8% since first listed24 events — show timeline
- 2026-04-30 Price Changed $79,900 CRMLS
- 2026-04-06 Price Changed $84,900 CRMLS
- 2026-03-10 Price Changed $89,900 CRMLS
- 2026-02-20 Price Changed $94,500 CRMLS
- 2026-01-27 Listed $98,500 CRMLS
- 2025-11-02 Price Changed $84,500 CRMLS
- 2025-10-23 Price Changed $89,900 CRMLS
- 2025-10-15 Price Changed $90,900 CRMLS
- 2025-10-06 Listed $95,500 CRMLS
- 2025-03-10 Relisted — CRMLS
- 2025-02-09 Relisted — CRMLS
- 2025-01-11 Relisted — CRMLS
- 2024-12-09 Relisted — CRMLS
- 2024-08-22 Price Changed $89,999 CRMLS
- 2024-06-28 Listed $95,000 CRMLS
- 2024-06-14 Coming Soon — CRMLS
- 2015-11-02 Listing Removed — CRMLS
- 2015-11-02 Sold (MLS) $18,000 CRMLS
- 2015-10-02 Pending — CRMLS
- 2015-09-19 Price Changed $20,000 CRMLS
- 2015-09-02 Price Changed $25,000 CRMLS
- 2015-07-01 Price Changed $30,000 CRMLS
- 2015-04-28 Price Changed $37,000 CRMLS
- 2015-03-22 Listed $40,000 CRMLS
Property tax history
-8.7%/yrLatest (2025): $22 · +0.4% YoY. Source: county tax records.
Cash-flow waterfall
monthlySold comps — $/sqft
last 12 mo · ≤1 miLoading sold comps…