3321 Glenway Ave · Cincinnati, OH
Flood risk 1/10 · Minimal
- FEMA flood zone
- X (unshaded)
- Chance of flooding over 30 yrs
- 0.0%
- Est. flood insurance / yr
- $507 – $1,088
Fire risk 1/10 · Minimal
- Est. fire insurance / yr
- $713 – $1,323
Heat risk 4/10 · Minor
- Hot days now (above 103°F)
- 7 days/yr
- Hot days in 30 yrs
- 19 days/yr
Wind risk 2/10 · Minimal
- Chance of severe wind over 30 yrs
- 1.0%
Air-quality risk 3/10 · Minor
- Unhealthy air days now
- 3 days/yr
- Unhealthy air days in 30 yrs
- 5 days/yr
Risk factors via First Street. Map © Google.
Why this score? — see what drove the B+ grade
The composite is a weighted blend of 9 inputs, each scored 0–100. Each bar is that input's sub-score; the figure is the points it added to the 100-point composite (weight × sub-score).
- Cash flow +30.0/30.0
- ARV discount +15.0/15.0
- 1% rule +10.0/10.0
- DSCR +10.0/10.0
- Livability +4.0/5.0
- Rent growth +3.3/5.0
- Schools +2.5/10.0
- Condition / age +2.5/5.0
- Appreciation +0.0/10.0
$95,000
🖨 Deal sheet 📄 Offer letter ✓ Due diligence
Listing remarks MLS
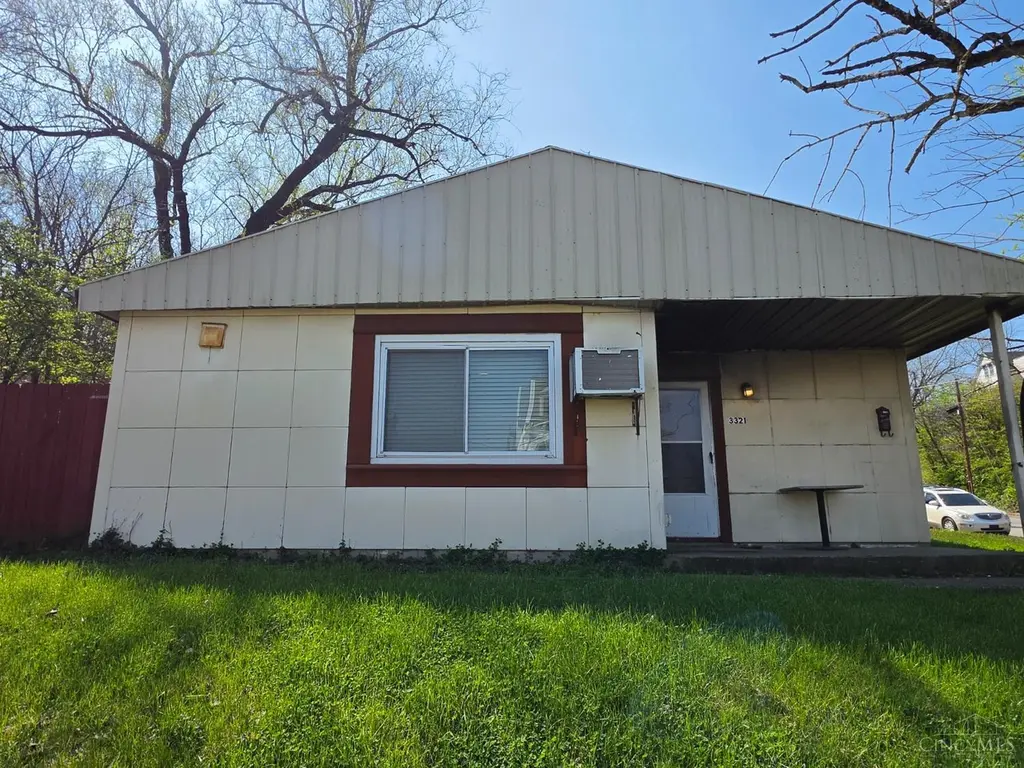
LIST PRICE IS THE ONLINE AUCTION OPENING BID. Own a piece of architectural history and experience the ULTIMATE LOW MAINTENANCE property. This Lustron home has everything you need: Nice corner lot - Check! Single level living - Check! Open floor plan - Check! The most convenient location: A quiet park with playground, a major grocery store, the library, bus stops, and more all within a couple blocks away - Check!, Check! and Check! Lustron homes are THE smart buy - they have a significant national following and are considered collector items by some. Join an elite and exclusive league of owners who know value, seize the opportunities at hand, and sustain throughout time. Bid today! Auction closes February 12, 2026 at 6PM.
Key facts
- Lustron home design
- 6,186 sq ft lot
- Built 1948
Tags
Property features AI
Finance
- Other: Lease not considered
- HOA & community: No HOA
Exterior
- Parking: On-street parking and driveway
- Utilities: Public water; Public sewer; Electric water heater; Gas-filled, double-pane and insulated windows (LowE, slider, casement, clerestory styles)
- Home design: Single-family home, historical style; One story; Slab foundation
- Construction: Other construction materials
- Exterior features: Corner lot with a porch; Privacy wood fencing; Metal roof; Busline nearby
Interior
- Kitchen: Walkout kitchen with wood cabinets and laminate flooring; Includes Oven/Range and Refrigerator
- Bedrooms: 2 bedrooms on main level — Primary ~13 x 12, Second ~14 x 10
- Flooring: Wall-to-wall carpet in living area; Laminate flooring in kitchen; WW carpet in dining area
- Bathrooms: 1 full bathroom on main level
- Heating & cooling: Electric baseboard heating; Ceiling fans and wall AC unit
- Interior features: Ceiling fan; Window treatments; Open dining area; Walkout from kitchen
- Laundry & utility: Main-level laundry room (~7 x 5)
Neighborhood map
What this means for you Summary
Snapshot
- This is a 3-bed/1.0-bath single-family listed at $95k.
Deal economics
- At list price, monthly cash flow is $502 ($6k/yr) — positive.
- The deal already cash-flows at list — no discount required.
- Meets the 1% rule at list price ($1k rent vs $95k).
- Recommended offer: $89k (6.0% below list) — sets the bar for market timing.
- Cap rate 12.6% vs local median 3.9% in Cincinnati — top-decile yield for the area; either an underpriced asset or a hidden risk that comps aren't pricing in. Stress-test before assuming the spread holds.
Location & tenants
- Location reads 80/100 on livability (#130 in OH, #1,856 nationally) — a professional / high-income tenant draw. Strengths: amenities A+, commute A+, cost of living A+; Watch: employment D, crime F.
- Cincinnati Public Schools (urban): math 25% / reading 36% proficiency, ranked #581 of 656 in OH (top 89%) — families likely to look elsewhere, expect single-tenant / working-renter base with shorter leases; 70% free/reduced lunch — lower-income household profile, screen leases tightly.
- Market conditions: Rents rising (+3.3%/yr); 69 active listings in the ZIP; 29 comparable units currently listed for rent nearby; rentals at typical pace (median 24d on market — plan ~3-4 weeks tenant-placement turnaround); lower-income renter base — watch delinquency; 801 units permitted in Hamilton County in 2024 (190 in 5+ unit buildings).
- This rent runs 39% of the median local income ($44k/yr) — at the standard rent-burdened threshold; future hikes will face affordability resistance.
Forward outlook
- Local home prices are declining (-3.0%/yr); year-one equity from $657 of loan paydown is wiped out by about $3k of value loss. Plan a longer hold.
- At projected returns (-3.0% appreciation + 3.3% rent growth), your $27k cash investment doubles in ~6 years — after that, you're playing with house money.
Negotiation context
- It's been on market 80 days — a 6% lower offer ($89k) is reasonable based on typical stale-listing flexibility.
- 6 sale attempts since 24y ago with the ask held roughly flat each time — persistent listings suggest the price (not the market) is what's stuck; bring a comps-based counter.
- Current owner paid $25k; list at $95k implies a 275% gain — meaningful room to come down on a strong offer.
Risks & watch-outs
- Watch-outs: built in 1948 — expect roof / HVAC / electrical / plumbing capex.
Questions for the listing agent
- It's been on market 80 days. Have you received any prior offers? Is the seller open to a 6% concession, seller financing, or rate buy-down credit?
- Built in 1948 — when were the roof, HVAC, electrical panel, plumbing, and water heater last replaced?
- Why hasn't it sold? Are there any deal-killer items the seller is aware of (foundation, flood, title, zoning, code violations)?
- Is there a deadline driving the sale (1031 exchange, divorce, estate, relocation)? That informs how much negotiation room exists.
- Schools are B-rated — typically a magnet for longer-tenancy family renters. What's the average tenant stay here, and is there a school-zone premium baked into asking?
- Crime grade is F in this area — have there been break-ins, vandalism, or insurance claims at this property in the last 3 years? What carrier currently insures it and at what premium?
- What's the average days-on-market for RENTAL listings here right now (not sales)? A rising rental-DOM trend means longer vacancies and softer asking-rent achievability than the comps imply.
- What's the recent tenant-quality profile in this submarket — average credit score on applications, eviction rate, late-payment / NSF rate, and stable-employment percentage? A property-management company in the area should have these aggregated.
- How much new for-sale + rental construction is in the pipeline within 1–3 miles? Heavy new supply typically softens prices + rents 12–24 months out; constrained supply supports both.
Investment metrics
- 1% rule
- 1.50% ✓
- Cap rate
- 12.64%
- Cash-on-cash
- 22.67%
- DSCR
- 2.01
- GRM
- 5.6
CMA / ARV
- ARV (on-the-fly)
- $146,885
- Comps found
- 12
Show comp detail 12 sales within ~0.75 mi
| Address | Dist | Beds/Ba | Sqft | Sold | Price | $/sf | Match |
|---|---|---|---|---|---|---|---|
| 1124 Elberon Ave | 0.03mi | 2/2.0 (-1) | 934 (-8%) | 1mo | $177,500 | $190 | 76 |
| 3627 W Liberty St | 0.37mi | 3/2.5 | 1,008 (-0%) | 5mo | $168,000 | $167 | 72 |
| 2911 Glenway Ave | 0.33mi | 2/1.0 (-1) | 1,056 (+4%) | 6mo | $40,000 | $38 | 67 |
| 1232 Fairbanks Ave | 0.18mi | 3/1.0 | 900 (-11%) | 8mo | $148,000 | $164 | 67 |
| 3634 W Liberty St | 0.40mi | 2/1.0 (-1) | 955 (-6%) | 6mo | $142,000 | $149 | 62 |
| 937 Purcell Ave | 0.32mi | 2/1.0 (-1) | 919 (-9%) | 6mo | $169,000 | $184 | 59 |
| 1248 Drott Ave | 0.25mi | 3/1.0 | 1,159 (+14%) | 8mo | $82,000 | $71 | 58 |
| 2245 Quebec Rd | 0.69mi | 3/1.0 | 948 (-6%) | 1mo | $137,900 | $145 | 57 |
| 2187 Quebec Rd | 0.60mi | 2/1.0 (-1) | 1,073 (+6%) | 1mo | $120,000 | $112 | 56 |
| 1702 Wyoming Ave | 0.66mi | 3/1.5 | 1,080 (+7%) | 7mo | $152,000 | $141 | 50 |
| 3631 W Eighth St | 0.65mi | 2/1.0 (-1) | 936 (-8%) | 6mo | $80,000 | $85 | 47 |
| 2703 Maryland Ave | 0.51mi | 2/1.0 (-1) | 864 (-15%) | 7mo | $116,500 | $135 | 41 |
Match score weights: distance 35% · size 25% · config 20% · recency 20%. Top-matched comps best support the ARV.
Projected returns pro-forma
-3.0% appreciation · 3.3% rent growth · sell at horizon
- IRR
- 15.9%
- Equity multiple
- 1.64×
- Total profit
- $17,040
- Equity at exit
- $14,165
- IRR
- 24.7%
- Equity multiple
- 3.17×
- Total profit
- $57,834
- Equity at exit
- $8,214
Cash invested: $26,600 (down + closing). Projections, not guarantees.
Landlord ↔ Tenant lean methodology
- Overall (STATE)
- 73 Landlord-Friendly
- State Ohio
- 73 Landlord-Friendly · R+6
- County
- — inherits STATE
- City
- — inherits STATE
ZIP-level market 45205
- Rents YoY
- 3.3%
- Active inventory
- 69
- Price-to-rent
- 5.6×
Monthly cashflow live
- Estimated rent
- $1,426 high interval (Pro) →
- Mortgage (P&I)
- −$498
- Tax from tax record
- −$86 /mo · $1,035/yr
- Insurance
- −$40
- HOA
- −$0
- Vacancy / Maint / Mgmt
- −$299
- Net cashflow
- $502
Break-even live
UW: 25.0% down · 7.5% · 30yr · 1.5% tax · 5.0% vac · 8.0% maint · 8.0% mgmt
Financing live
Cash to close
- Down payment
- $23,750
- Closing costs
- $2,850
- Reserves months
- —
- Total cash needed
- —
Loan-product check · same deal, 3 products live
Conventional
25% down · 7.5% · 30yr
- Down + closing
- —
- Monthly P&I
- —
- Monthly cashflow
- —
- DSCR
- —
- Eligible?
- —
Personal DTI + credit; lowest rate.
DSCR
20% down · 8.5% · 30yr
- Down + closing
- —
- Monthly P&I
- —
- Monthly cashflow
- —
- DSCR
- —
- Eligible?
- —
No personal income docs; deal must DSCR.
Hard money
10% down · 12.0% · 12mo
- Down + closing
- —
- Monthly P&I
- —
- Monthly cashflow
- —
- DSCR
- —
- Eligible?
- —
Short-term bridge; refi at stabilization.
Rent comps 29 comps
| Address | Beds | Baths | Sqft | Rent | $/sqft | DOM | Units | Dist |
|---|---|---|---|---|---|---|---|---|
| 944 Elberon Ave Cincinnati, OH | 2.0 | 1.0 | 900 | $1,200 | $1.33 | 23d | 1 | 0.29mi |
| 937 Grand Ave Cincinnati, OH | 2.0 | 1.0 | 825 | $1,395 | $1.69 | 23d | 1 | 0.39mi |
| 916 Fairbanks Ave Cincinnati, OH | 4.0 | 1.0 | 1438 | $1,695 | $1.18 | 23d | 1 | 0.40mi |
| 927 Chateau Ave Cincinnati, OH | 3.0 | 1.0 | 1354 | $1,550 | $1.14 | 21d | 1 | 0.44mi |
| 3666 Glenway Ave Cincinnati, OH | 3.0 | 1.0 | 1339 | $1,250 | $0.93 | 23d | 1 | 0.47mi |
| 717 Elberon Ave Unit Elberon 717 Cincinnati, OH | 2.0 | 1.0 | 1117 | $995 | $0.89 | 23d | 1 | 0.58mi |
| 3772 W Liberty St Cincinnati, OH | 3.0 | 1.0 | 1066 | $1,350 | $1.27 | 4d | 1 | 0.63mi |
| 3643 W 8th St Unit 1 Cincinnati, OH | 2.0 | 1.0 | 850 | $995 | $1.17 | 23d | 1 | 0.65mi |
| 810 Matson Pl Cincinnati, OH | 2.0 | 2.0 | 1196 | $2,100 | $1.76 | 1d | 1 | 0.67mi |
| 1607 Minion Ave Cincinnati, OH | 3.0 | 1.5 | 1066 | $1,675 | $1.57 | 23d | 1 | 0.67mi |
| 2600 Bushnell St Cincinnati, OH | 2.0 | 2.0 | 937 | $1,295 | $1.38 | 23d | 1 | 0.74mi |
| 1740 Minion Ave Cincinnati, OH | 2.0 | 1.0 | 1320 | $1,200 | $0.91 | 23d | 1 | 0.76mi |
| 1311 Manss Ave Cincinnati, OH | 4.0 | 1.0 | 1409 | $1,295 | $0.92 | 4d | 1 | 0.77mi |
| 633 Hawthorne Ave Unit 2 Cincinnati, OH | 3.0 | 1.0 | 1000 | $1,400 | $1.40 | 23d | 1 | 0.78mi |
| 868 Academy Ave Unit 2 Cincinnati, OH | 4.0 | 1.0 | 1100 | $1,699 | $1.54 | 23d | 1 | 0.79mi |
| 2361 Maryland Ave Cincinnati, OH | 2.0 | 1.0 | 750 | $1,200 | $1.60 | 23d | 1 | 0.86mi |
| 1214 Gilsey Ave Cincinnati, OH | 3.0 | 1.0 | 1300 | $1,300 | $1.00 | 20d | 1 | 0.87mi |
| 1214 Gilsey Ave Cincinnati, OH | 3.0 | 1.0 | 1300 | $1,300 | $1.00 | 23d | 1 | 0.87mi |
| 1905 Wyoming Ave Cincinnati, OH | 2.0 | 1.0 | 850 | $1,012 | $1.19 | 1d | 2 | 0.92mi |
| 1233 Dewey Ave Cincinnati, OH | 3.0 | 1.0 | 1411 | $1,375 | $0.97 | 4d | 1 | 0.94mi |
| 1240 Rosemont Ave Cincinnati, OH | 2.0 | 1.0 | 1280 | $1,100 | $0.86 | 20d | 1 | 0.97mi |
| 1057 Winfield Ave Unit 2 Cincinnati, OH | 2.0 | 1.0 | 1000 | $1,250 | $1.25 | 23d | 1 | 1.05mi |
| 1872 Sunset Ave Cincinnati, OH | 2.0 | 1.0 | 888 | $1,075 | $1.21 | 4d | 7 | 1.09mi |
| 2454 River Rd Unit 2 Cincinnati, OH | 4.0 | 1.0 | 1400 | $1,595 | $1.14 | 23d | 1 | 1.12mi |
| 1820 Sunset Ave Cincinnati, OH | 1.0–2.0 | 1.0 | 750 | $1,049 | $1.40 | 21d | 6 | 1.13mi |
| 2504 White St Apt 5 Cincinnati, OH | 3.0 | 2.0 | 1150 | $1,150 | $1.00 | 23d | 1 | 1.23mi |
| 1057 Schiff Ave Unit 1057-2 Cincinnati, OH | 4.0 | 1.0 | 1000 | $1,595 | $1.59 | 14d | 1 | 1.37mi |
| 2570 Sarvis Ct Unit 2572 12 Cincinnati, OH | 2.0 | 1.0 | 1000 | $1,250 | $1.25 | 23d | 1 | 1.42mi |
| 2570 Sarvis Ct Unit 2570 01 Cincinnati, OH | 2.0 | 1.0 | 1000 | $1,195 | $1.20 | 23d | 1 | 1.42mi |
Listing history 24 events
-
2026-06-18days on market $95,000 Active 80 DOM
-
2026-06-17days on market $95,000 Active 79 DOM
-
2026-06-16days on market $95,000 Active 78 DOM
-
2026-06-15days on market $95,000 Active 77 DOM
-
2026-06-13days on market $95,000 Active 75 DOM
-
2026-06-13days on market $95,000 Active 74 DOM
-
2026-06-09days on market $95,000 Active 71 DOM
-
2026-06-08days on market $95,000 Active 70 DOM
-
2026-06-07days on market $95,000 Active 69 DOM
-
2026-06-03days on market $95,000 Active 65 DOM
-
2026-06-02days on market $95,000 Active 64 DOM
-
2026-06-01days on market $95,000 Active 63 DOM
-
2026-05-31days on market $95,000 Active 62 DOM
-
2026-03-30$95,000 Active
-
2026-03-24historical 730-char remark
Show marketing remark (730 chars)
LIST PRICE IS THE ONLINE AUCTION OPENING BID. Own a piece of architectural history and experience the ULTIMATE LOW MAINTENANCE property. This Lustron home has everything you need: Nice corner lot - Check! Single level living - Check! Open floor plan - Check! The most convenient location: A quiet park with playground, a major grocery store, the library, bus stops, and more all within a couple blocks away - Check!, Check! and Check! Lustron homes are THE smart buy - they have a significant national following and are considered collector items by some. Join an elite and exclusive league of owners who know value, seize the opportunities at hand, and sustain throughout time. Bid today! Auction closes February 12, 2026 at 6PM.
-
2026-02-05$85,000 Active 730-char remark
Show marketing remark (730 chars)
LIST PRICE IS THE ONLINE AUCTION OPENING BID. Own a piece of architectural history and experience the ULTIMATE LOW MAINTENANCE property. This Lustron home has everything you need: Nice corner lot - Check! Single level living - Check! Open floor plan - Check! The most convenient location: A quiet park with playground, a major grocery store, the library, bus stops, and more all within a couple blocks away - Check!, Check! and Check! Lustron homes are THE smart buy - they have a significant national following and are considered collector items by some. Join an elite and exclusive league of owners who know value, seize the opportunities at hand, and sustain throughout time. Bid today! Auction closes February 12, 2026 at 6PM.
-
2005-09-14soldstatus $25,300 112-char remark
Show marketing remark (112 chars)
Sells at Absolute Auction, Saturday August 20 at 2:30 p.m. Sells to the highest Bidder No Minimum - No Reserve
-
2005-08-01historical
-
2005-07-27112-char remark
Show marketing remark (112 chars)
Sells at Absolute Auction, Saturday August 20 at 2:30 p.m. Sells to the highest Bidder No Minimum - No Reserve
-
2005-04-14$19,999
-
2003-12-23historical
-
2003-09-22$33,900
-
2002-09-06historical
-
2002-07-02$42,900
ⓘ Source: listings_history table (triggers on properties + properties_extension) + one-shot
backfill from property_details.listing_events for pre-trigger history.
Tax reassessment forecast OH · Partial reset (capped growth)
- Current annual tax
- $1,035 · $86/mo
- Projected year-2 tax
- $1,259 · $105/mo
- Expected delta
- +$223/yr (+$19/mo · 21.6%)
ⓘ Screening estimate from a state-policy table — verify with the county assessor before closing.
Climate risk First Street
- Flood 1/10 Low FEMA zone X (unshaded) · 0% chance over 30 yrs
- Wildfire 1/10 Low
- Heat 4/10 Moderate 7 d/yr ≥103°F today · 19 d/yr by 30 yrs out
- Wind 2/10 Low 100% chance of damaging wind over 30 yrs
- Air quality 3/10 Moderate 3 unhealthy d/yr today · 5 by 30 yrs out
Nearby sold comps map
Loading sold comps map…
Walkable amenities ~0.75 mi
Loading nearby amenities…
Taxation est. · year 1
- Rental income
- $17,111
- − Mortgage interest
- −$5,321
- − Property taxes
- −$1,035
- − Insurance
- −$475
- − Repairs & maintenance
- −$1,369
- − Management
- −$1,369
- − Depreciation
- −$2,764
- Taxable income
- $4,778
- Est. tax owed @ 24.0%
- −$1,147
- After-tax cash flow
- $4,883/yr
For passive investors: Depreciation is non-cash, so a rental often shows a tax loss while cash-flowing — sheltering income. Rental losses are passive: they offset passive income freely, and up to $25,000/yr can offset ordinary (W-2) income if you actively participate and your MAGI is under $100k (phasing out to $0 by $150k); unused losses carry forward. On sale, claimed depreciation is recaptured at up to 25%, and gains may owe capital-gains tax (a 1031 exchange can defer both). Figures are a year-1 estimate at your 24.0% rate — not tax advice; consult a CPA.
Schools (NCES district)
- District
- Cincinnati Public Schools
- NCES district ID
- 3904375
- Math proficiency
- 25% ▼ -19.00%
- Reading proficiency
- 36% ▼ -14.00%
- Median HH income
- $35,743
- Composite
- 25.21/100
- National rank
- #7508
- State rank
- #581 of 656 in OH
Livability — Cincinnati
- Score
- 80/100
- State rank
- #130
- US rank
- #1856
Category grades
Schools grade is shown separately in the Schools card above.
Census & demographics
- Census place
- Cincinnati, OH
- County
- Hamilton County · 701,295 people
- City population
- 505,555
- Metro
- Cincinnati, OH-KY-IN
- Population (ZIP)
- 18,651
- Household income
- $43,682
- Rent vs Own
- Severe rent burden
- 980.0
Population outlook (Hamilton County) Hauer SSP2
- Today (2025)
- 826,054 people
- By 2030
- 830,947 · +0.6%
- By 2040
- 832,319 · +0.8%
- By 2050
- 822,428 · -0.4%
- By 2075
- 788,688 · -4.5%
- By 2100
- 710,674 · -14.0%
Race, ethnicity, and origin ACS 2023
- Neighborhood character
- Diverse neighborhood (Simpson 0.69)
- Race & ethnicity
- Black 43% White 32% Hispanic / Latino 16% Two or more races 7% Asian 2%
- Hispanic origin (detail)
- Mexican 2%
- Common ancestry
- Lithuanian 1% Slovak 1% Serbian 1%
- Foreign-born
- 9% · Canada, India, China
- Languages at home
- 84% English-only · Spanish 10% Other Asian/Pacific 2% Other Indo-European 1%
Political lean MEDSL · Hamilton
- 2024 margin
- D (+14.9) · D 57.0% · R 42.1%
- 2008→2024 swing
- +7.9pp toward D · 2008: 7.0pp · 2024: 14.9pp
- All cycles
- 2024: D+14.9 2020: D+15.9 2016: D+9.5 2012: D+4.9 2008: D+7.0
Not yet ingested
- Civics
- —
Market trends
- HPI YoY
- ▼ -138.67%
- Current HPI
- 163.3375
- Rent YoY
- ▲ 3.30%
- Metro
- Cincinnati, OH-KY-IN
- State GDP YoY
- ▲ 1.98%
- F500 in state
- 48
Industry mix (Fortune 500 HQ in OH)
| Industry | F500 HQs | Revenue |
|---|---|---|
| Insurance | 3 | $145B |
|
||
| Industrial Machinery | 3 | $49B |
|
||
| Financial Services | 3 | $24B |
|
||
| Consumer Goods | 2 | $93B |
|
||
| Aerospace / Defense | 2 | $47B |
|
||
| Utilities | 2 | $33B |
|
||
Price history
+121.4% since first listed11 events — show timeline
- 2026-03-30 Listed $95,000 Cincy MLS
- 2026-03-24 Listing Removed — Cincy MLS
- 2026-02-05 Listed $85,000 Cincy MLS
- 2005-09-14 Sold (MLS) $25,300 Cincy MLS
- 2005-08-01 Listing Removed — Cincy MLS
- 2005-07-27 Listed — Cincy MLS
- 2005-04-14 Listed $19,999 Cincy MLS
- 2003-12-23 Listing Removed — Cincy MLS
- 2003-09-22 Listed $33,900 Cincy MLS
- 2002-09-06 Listing Removed — Cincy MLS
- 2002-07-02 Listed $42,900 Cincy MLS
Property tax history
+3.8%/yrLatest (2025): $1,035 · +0.1% YoY. Source: county tax records.
Cash-flow waterfall
monthlySold comps — $/sqft
last 12 mo · ≤1 miLoading sold comps…