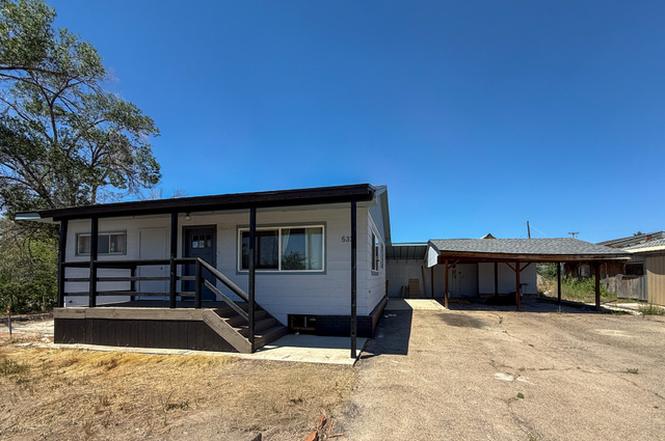
533 E 100 N · Price, UT
Flood risk No data
- FEMA flood zone
- —
- Chance of flooding over 30 yrs
- %
- Est. flood insurance / yr
- —
Fire risk No data
- Est. fire insurance / yr
- —
Heat risk No data
- Hot days now (above °F)
- days/yr
- Hot days in 30 yrs
- days/yr
Wind risk No data
- Chance of severe wind over 30 yrs
- %
Air-quality risk No data
- Unhealthy air days now
- days/yr
- Unhealthy air days in 30 yrs
- days/yr
Risk factors via First Street. Map © Google.
Why this score? — see what drove the D grade
The composite is a weighted blend of 9 inputs, each scored 0–100. Each bar is that input's sub-score; the figure is the points it added to the 100-point composite (weight × sub-score).
- Cash flow +15.4/30.0
- ARV discount +7.5/15.0
- DSCR +4.7/10.0
- 1% rule +4.2/10.0
- Livability +3.5/5.0
- Schools +3.4/10.0
- Rent growth +2.5/5.0
- Condition / age +2.5/5.0
- Appreciation +0.0/10.0
$249,000
🖨 Deal sheet (PDF) 📄 Offer letter ✓ Due diligence
Listing remarks
Updated 4-bedroom, 2-bath home ready for its new owner! Since 2023, this property has seen extensive updates, including a new roof, flooring, paint, fixtures, siding, and a fully refreshed kitchen and bathrooms - offering a clean, modern feel throughout. Located on 100 N in Price, the property also offers potential for commercial use, adding flexibility and value. The lot provides ample parking space, including room for trailers or an RV. Move-in ready with thoughtful updates - come make it your own! Currently being rented. Tenants will be out soon, and home will be cleaned and ready to show. Square footage figures are provided as a courtesy estimate only. Buyer is advised to obtain an inde
Key facts
- New siding
- New flooring
- New paint
Tags
Neighborhood map
What this means for you Summary
Snapshot
- This is a 4-bed/2.0-bath single-family listed at $249k.
Deal economics
- At list price, monthly cash flow is $96 ($1k/yr) — positive.
- The deal already cash-flows at list — no discount required.
- To meet the 1% rule (rent ≥ 1% of price), the offer needs to be $230k (7.6% below list).
- Recommended offer: $230k (7.6% below list) — sets the bar for 1% rule.
Location & tenants
- Location reads 69/100 on livability (#102 in UT) — a middle-class / working-renter tenant base. Strengths: cost of living A+, housing A+, crime A; Watch: schools C-, amenities F, commute F.
- Carbon District (town): math 36% / reading 43% proficiency, ranked #53 of 80 in UT (top 66%) — families likely to look elsewhere, expect single-tenant / working-renter base with shorter leases.
- Market conditions: 146 active listings in the ZIP; 1 comparable units currently listed for rent nearby; 196 units permitted in Carbon County in 2024 (168 in 5+ unit buildings).
Forward outlook
- Local home prices are declining (-3.0%/yr); year-one equity from $2k of loan paydown is wiped out by about $7k of value loss. Plan a longer hold.
- Carbon County population projected at -22% by 2050 — secular population decline; favor cash flow + early exit over multi-decade hold.
Negotiation context
- Only 5 days on market — expect competitive offers; lowballing is unlikely to land.
Risks & watch-outs
- Watch-outs: built in 1956 — expect roof / HVAC / electrical / plumbing capex.
Questions for the listing agent
- Built in 1956 — when were the roof, HVAC, electrical panel, plumbing, and water heater last replaced?
- Is there a deadline driving the sale (1031 exchange, divorce, estate, relocation)? That informs how much negotiation room exists.
- The area grade is low — what's the realistic commute time and amenity access for the typical tenant pool here? Any planned neighborhood developments (good or bad) we should know about?
- What's the average days-on-market for RENTAL listings here right now (not sales)? A rising rental-DOM trend means longer vacancies and softer asking-rent achievability than the comps imply.
- What's the recent tenant-quality profile in this submarket — average credit score on applications, eviction rate, late-payment / NSF rate, and stable-employment percentage? A property-management company in the area should have these aggregated.
- How much new for-sale + rental construction is in the pipeline within 1–3 miles? Heavy new supply typically softens prices + rents 12–24 months out; constrained supply supports both.
Investment metrics
- 1% rule
- 0.92% ✗
- Cap rate
- 6.76%
- Cash-on-cash
- 1.66%
- DSCR
- 1.07
- GRM
- 9.0
CMA / ARV
No comps found within radius.
Projected returns pro-forma
-3.0% appreciation · 3.0% rent growth · sell at horizon
- IRR
- -13.6%
- Equity multiple
- 0.51×
- Total profit
- $-34,186
- Equity at exit
- $37,127
- IRR
- -4.7%
- Equity multiple
- 0.69×
- Total profit
- $-21,737
- Equity at exit
- $21,529
Cash invested: $69,720 (down + closing). Projections, not guarantees.
Landlord ↔ Tenant lean methodology
- Overall (STATE)
- 86 Strongly Landlord-Friendly
- State Utah
- 86 Strongly Landlord-Friendly · R+15
- County
- — inherits STATE
- City
- — inherits STATE
ZIP-level market 84501
- Active inventory
- 146
- Price-to-rent
- 9.0×
Monthly cashflow live
- Estimated rent
- $2,300 medium interval (Pro) →
- Mortgage (P&I)
- −$1,306
- Tax est. 1.5%
- −$311 /mo · $3,735/yr
- Insurance
- −$104
- HOA
- −$0
- Vacancy / Maint / Mgmt
- −$483
- Net cashflow
- $96
Break-even live
Sensitivity live
| Price | -10% $268 | -5% $182 | +0% $96 | +5% $10 | +10% $-76 |
|---|---|---|---|---|---|
| Rent | -10% $-85 | -5% $5 | +0% $96 | +5% $187 | +10% $278 |
| Rate | -1.0pp $222 | -0.5pp $160 | base $96 | +0.5pp $32 | +1.0pp $-34 |
UW: 25.0% down · 7.5% · 30yr · 1.5% tax · 5.0% vac · 8.0% maint · 8.0% mgmt
Financing live
Cash to close
- Down payment
- $62,250
- Closing costs
- $7,470
- Reserves months
- —
- Total cash needed
- —
Loan-product check · same deal, 3 products live
Conventional
25% down · 7.5% · 30yr
- Down + closing
- —
- Monthly P&I
- —
- Monthly cashflow
- —
- DSCR
- —
- Eligible?
- —
Personal DTI + credit; lowest rate.
DSCR
20% down · 8.5% · 30yr
- Down + closing
- —
- Monthly P&I
- —
- Monthly cashflow
- —
- DSCR
- —
- Eligible?
- —
No personal income docs; deal must DSCR.
Hard money
10% down · 12.0% · 12mo
- Down + closing
- —
- Monthly P&I
- —
- Monthly cashflow
- —
- DSCR
- —
- Eligible?
- —
Short-term bridge; refi at stabilization.
Rent comps 1 comps
| Address | Beds | Baths | Sqft | Rent | $/sqft | DOM | Units | Dist |
|---|---|---|---|---|---|---|---|---|
| 533 E 100 N Price, UT | 4.0 | 2.0 | 2152 | $2,300 | $1.07 | 23d | 1 | 0.03mi |
Listing history 4 events
-
2026-06-22days on market $249,000 Active 5 DOM
-
2026-06-18days on market $249,000 Active 2 DOM
-
2026-06-17remarks 699-char remark
-
2026-06-17$249,000 Active 1 DOM
ⓘ Source: listings_history table (triggers on properties + properties_extension) + one-shot
backfill from property_details.listing_events for pre-trigger history.
Nearby sold comps map
Loading sold comps map…
Walkable amenities ~0.75 mi
Loading nearby amenities…
Taxation est. · year 1
- Rental income
- $27,600
- − Mortgage interest
- −$13,948
- − Property taxes
- −$3,735
- − Insurance
- −$1,245
- − Repairs & maintenance
- −$2,208
- − Management
- −$2,208
- − Depreciation
- −$7,244
- Taxable loss
- −$2,988
- Est. tax savings @ 24.0%
- +$717
- After-tax cash flow
- $1,872/yr
For passive investors: Depreciation is non-cash, so a rental often shows a tax loss while cash-flowing — sheltering income. Rental losses are passive: they offset passive income freely, and up to $25,000/yr can offset ordinary (W-2) income if you actively participate and your MAGI is under $100k (phasing out to $0 by $150k); unused losses carry forward. On sale, claimed depreciation is recaptured at up to 25%, and gains may owe capital-gains tax (a 1031 exchange can defer both). Figures are a year-1 estimate at your 24.0% rate — not tax advice; consult a CPA.
Schools (NCES district)
- District
- Carbon District
- NCES district ID
- 4900150
- Math proficiency
- 36% ▼ -7.00%
- Reading proficiency
- 43% ▼ -4.00%
- Median HH income
- $45,189
- Composite
- 33.6/100
- National rank
- #5416
- State rank
- #53 of 80 in UT
Livability — Price
- Score
- 69/100
- State rank
- #102
- US rank
- #8877
Category grades
Schools grade is shown separately in the Schools card above.
Census & demographics
- Census place
- Price, UT
- Population (ZIP)
- 13,002
Population outlook (Carbon County) Hauer SSP2
- Today (2025)
- 18,972 people
- By 2030
- 18,081 · -4.7%
- By 2040
- 16,260 · -14.3%
- By 2050
- 14,895 · -21.5%
- By 2075
- 13,123 · -30.8%
- By 2100
- 13,066 · -31.1%
Race, ethnicity, and origin ACS 2023
- Neighborhood character
- Predominantly White (81%)
- Race & ethnicity
- White 81% Hispanic / Latino 14% Two or more races 7%
- Hispanic origin (detail)
- Mexican 12%
- Common ancestry
- Italian 3% Scottish 2% Slovak 2%
- Foreign-born
- 3% · Canada
- Languages at home
- 93% English-only · Spanish 6% Other Indo-European 1%
Political lean MEDSL · Carbon
- 2024 margin
- Solid R (+44.4) · D 26.7% · R 71.1% · Other 2.1%
- 2008→2024 swing
- -36.4pp toward R · 2008: -8.0pp · 2024: -44.4pp
- All cycles
- 2024: R+44.4 2020: R+45.9 2016: R+44.6 2012: R+36.4 2008: R+8.0
Not yet ingested
- Civics
- —
Market trends
- HPI YoY
- ▼ -119.96%
- Current HPI
- 222.2891
- Rent YoY
- —
- Metro
- —
- State GDP YoY
- ▲ 3.54%
- F500 in state
- 2
Industry mix (Fortune 500 HQ in UT)
| Industry | F500 HQs | Revenue |
|---|---|---|
| Financial Services | 1 | $3B |
|
||
Cash-flow waterfall
monthlySold comps — $/sqft
last 12 mo · ≤1 miLoading sold comps…