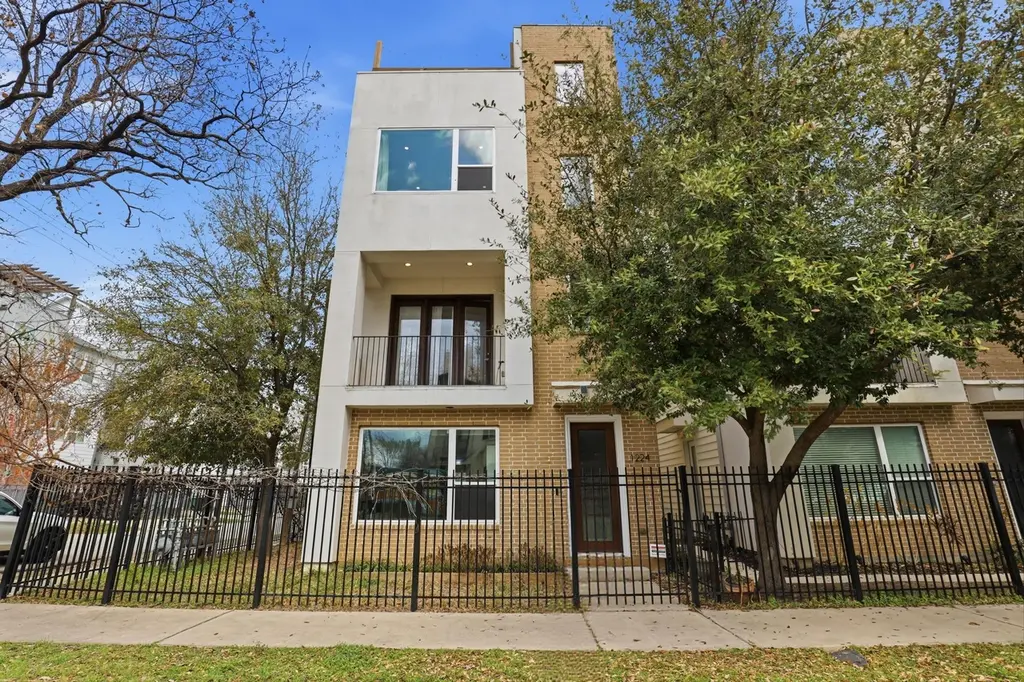
1224 Summer St · Houston, TX
Flood risk 5/10 · Moderate
- FEMA flood zone
- X (shaded)
- Chance of flooding over 30 yrs
- 0.24%
- Est. flood insurance / yr
- $507 – $1,088
Fire risk 1/10 · Minimal
- Est. fire insurance / yr
- $1,222 – $2,270
Heat risk 9/10 · Severe
- Hot days now (above 109°F)
- 7 days/yr
- Hot days in 30 yrs
- 24 days/yr
Wind risk 9/10 · Severe
- Chance of severe wind over 30 yrs
- 99.0%
Air-quality risk 3/10 · Minor
- Unhealthy air days now
- 2 days/yr
- Unhealthy air days in 30 yrs
- 3 days/yr
Risk factors via First Street. Map © Google.
Why this score? — see what drove the D- grade
The composite is a weighted blend of 9 inputs, each scored 0–100. Each bar is that input's sub-score; the figure is the points it added to the 100-point composite (weight × sub-score).
- Cash flow +11.3/30.0
- ARV discount +8.9/15.0
- 1% rule +3.9/10.0
- Livability +3.7/5.0
- DSCR +3.3/10.0
- Schools +2.7/10.0
- Condition / age +2.5/5.0
- Rent growth +2.3/5.0
- Appreciation +0.0/10.0
$495,000
🖨 Deal sheet (PDF) 📄 Offer letter ✓ Due diligence
Listing remarks
Like new four-level home located on a quiet street in First Ward. No HOA. Property is situated outside of a special flood hazard area. Zoned to highly rated schools. Great investment for Airbnb. This 3-bedroom, 3.5-bath home offers a spacious layout designed to feel like a single-family residence. The first floor includes a guest bedroom with a separate side-garden entrance. The second floor features an open living area with wood flooring, a half bath, and a kitchen equipped with a gas stove and a mini fridge built into the island, along with access to a covered balcony. The third floor includes the primary suite with a bathroom featuring a separate shower and tub, as well as an additional
Key facts
- Wood flooring
- Highly rated schools
- Open living area
Tags
Property features AI
Exterior
- Parking: Attached garage with 2 parking spaces
- Security: Smoke detectors
- Utilities: Public water; Public sewer
- Home design: Residential property; Entry level(s) include first, second, and third levels
- Construction: Built in 2014; Brick construction; Shingle and wood roof; Slab foundation
- Exterior features: Deck; Rooftop; Corner lot; Side yard; Other lot features
Interior
- Kitchen: Gas cooktop; Electric oven; Microwave; Dishwasher; Disposal; Breakfast bar (kitchen-adjacent)
- Bedrooms: Primary bedroom on third level (approx. 14 x 14); Bedroom on third level (approx. 12 x 11); Bedroom on first level (approx. 12 x 12)
- Flooring: Wood flooring; Carpet
- Bathrooms: Three full bathrooms; One half bathroom
- Heating & cooling: Central heating (gas); Central electric air conditioning
- Interior features: Breakfast bar; Balcony; High ceilings
- Laundry & utility: Washer; Dryer
Neighborhood map
What this means for you Summary
Snapshot
- This is a 3-bed/3.5-bath single-family listed at $495k.
Deal economics
- At list price, monthly cash flow is $-185 ($-2k/yr) — negative.
- To cash-flow at today's rent, offer at most $462k (6.6% below list).
- To meet the 1% rule (rent ≥ 1% of price), the offer needs to be $442k (10.6% below list).
- Recommended offer: $442k (10.6% below list) — sets the bar for 1% rule.
- Cap rate 5.8% vs local median 3.2% in Houston — top-decile yield for the area; either an underpriced asset or a hidden risk that comps aren't pricing in. Stress-test before assuming the spread holds.
Location & tenants
- Location reads 74/100 on livability (#184 in TX, #4,771 nationally) — a middle-class / working-renter tenant base. Strengths: amenities A+, cost of living A+, housing A+; Watch: crime F.
- Houston ISD (urban): math 27% / reading 35% proficiency, ranked #593 of 826 in TX (top 72%) — families likely to look elsewhere, expect single-tenant / working-renter base with shorter leases; 71% free/reduced lunch — lower-income household profile, screen leases tightly.
- Zoned schools: Crockett El (math 22% / reading 39%, grade F, #2,464 of 4,322 statewide, top 58%, 554 students, 63% FRL); Hogg Middle (math 44% / reading 48%, grade D+, #462 of 1,662 statewide, top 28%, 1,120 students, 52% FRL); Heights H S (math 27% / reading 57%, grade F, #730 of 1,632 statewide, top 47%, 2,476 students, 65% FRL).
- Market conditions: Rents soft (-0.8%/yr); 651 active listings in the ZIP; 40 comparable units currently listed for rent nearby; rentals at typical pace (median 21d on market — plan ~3-4 weeks tenant-placement turnaround); high-income renter base; 29,883 units permitted in Harris County in 2024 (8,621 in 5+ unit buildings).
- This rent runs 37% of the median local income ($145k/yr) — at the standard rent-burdened threshold; future hikes will face affordability resistance.
Forward outlook
- Local home prices are declining (-3.0%/yr); year-one equity from $3k of loan paydown is wiped out by about $15k of value loss. Plan a longer hold.
- Harris County population projected at +47% by 2050 — long-run rental-demand tailwind backs the buy-and-hold thesis.
Negotiation context
- It's been on market 37 days — a 3% lower offer ($480k) is reasonable based on typical stale-listing flexibility.
- 11 sale attempts since 12y ago with the ask held roughly flat each time — persistent listings suggest the price (not the market) is what's stuck; bring a comps-based counter.
Risks & watch-outs
- Climate carrying-cost: moderate flood risk; severe wind risk, 99% chance of damaging wind over 30y; extreme-heat days projected 7→24/yr by 2055 (HVAC capex compounding) — expect insurance premiums to compound above CPI over the hold.
Questions for the listing agent
- What do current leases actually rent for vs. the listed asking? Can we see a recent rent roll and the last 12 months of T-12 income?
- It's been on market 37 days. Have you received any prior offers? Is the seller open to a 11% concession, seller financing, or rate buy-down credit?
- Is there a deadline driving the sale (1031 exchange, divorce, estate, relocation)? That informs how much negotiation room exists.
- Schools are D-rated, which usually means shorter tenancies and higher turnover. Who's the typical renter profile here, and what's been the actual vacancy rate?
- Crime grade is F in this area — have there been break-ins, vandalism, or insurance claims at this property in the last 3 years? What carrier currently insures it and at what premium?
- The area grade is low — what's the realistic commute time and amenity access for the typical tenant pool here? Any planned neighborhood developments (good or bad) we should know about?
- What's the average days-on-market for RENTAL listings here right now (not sales)? A rising rental-DOM trend means longer vacancies and softer asking-rent achievability than the comps imply.
- What's the recent tenant-quality profile in this submarket — average credit score on applications, eviction rate, late-payment / NSF rate, and stable-employment percentage? A property-management company in the area should have these aggregated.
- How much new for-sale + rental construction is in the pipeline within 1–3 miles? Heavy new supply typically softens prices + rents 12–24 months out; constrained supply supports both.
Investment metrics
- 1% rule
- 0.89% ✗
- Cap rate
- 5.85%
- Cash-on-cash
- -1.60%
- DSCR
- 0.93
- GRM
- 9.3
CMA / ARV
- ARV (median comp)
- $511,017
- List price
- $495,000
- Delta
- -3.13%
- Verdict
- FAIR
- Comps
- 20 within 1.0 mi
Show comp detail 12 sales within ~0.75 mi
| Address | Dist | Beds/Ba | Sqft | Sold | Price | $/sf | Match |
|---|---|---|---|---|---|---|---|
| 1909 Hickory St | 0.15mi | 3/3.5 | 2,345 (-4%) | 3mo | $419,900 | $179 | 83 |
| 1702 Shearn St | 0.32mi | 3/3.5 | 2,465 (+0%) | 3mo | $549,000 | $223 | 82 |
| 1511 Alamo St | 0.30mi | 3/3.5 | 2,397 (-2%) | 1mo | $499,999 | $209 | 81 |
| 2020 Sabine St | 0.39mi | 3/3.0 | 2,485 (+1%) | 4mo | $475,000 | $191 | 75 |
| 1104 Dart St | 0.22mi | 3/2.5 | 2,580 (+5%) | 3mo | $599,900 | $233 | 74 |
| 1510 Johnson St | 0.23mi | 3/3.5 | 2,160 (-12%) | 2mo | $475,000 | $220 | 67 |
| 1211 Hickory St Unit D | 0.29mi | 3/3.5 | 2,099 (-14%) | 1mo | $465,000 | $222 | 62 |
| 2107 Crockett St | 0.59mi | 3/2.5 | 2,390 (-3%) | 3mo | $535,000 | $224 | 61 |
| 1819 Dart St | 0.46mi | 3/3.5 | 2,198 (-10%) | 2mo | $449,000 | $204 | 60 |
| 1817 Crockett St Unit C | 0.41mi | 3/3.5 | 2,132 (-13%) | 3mo | $497,000 | $233 | 57 |
| 2405 Freeman St | 0.73mi | 3/2.5 | 2,336 (-5%) | 2mo | $425,000 | $182 | 53 |
| 1706 Freeman Freeman St | 0.62mi | 3/2.5 | 2,207 (-10%) | 1mo | $469,000 | $213 | 50 |
Match score weights: distance 35% · size 25% · config 20% · recency 20%. Top-matched comps best support the ARV.
Projected returns pro-forma
-3.0% appreciation · 0.0% rent growth · sell at horizon
- IRR
- -22.6%
- Equity multiple
- 0.24×
- Total profit
- $-104,703
- Equity at exit
- $73,806
- IRR
- -28.2%
- Equity multiple
- -0.12×
- Total profit
- $-155,495
- Equity at exit
- $42,799
Cash invested: $138,600 (down + closing). Projections, not guarantees.
Landlord ↔ Tenant lean methodology
- Overall (STATE)
- 87 Strongly Landlord-Friendly
- State Texas
- 87 Strongly Landlord-Friendly · R+5
- County
- — inherits STATE
- City
- — inherits STATE
ZIP-level market 77007
- Rents YoY
- -0.8%
- Active inventory
- 651
- Price-to-rent
- 9.3×
Monthly cashflow live
- Estimated rent
- $4,424 high interval (Pro) →
- Mortgage (P&I)
- −$2,596
- Tax from tax record
- −$877 /mo · $10,529/yr
- Insurance
- −$206
- HOA
- −$0
- Vacancy / Maint / Mgmt
- −$929
- Net cashflow
- $-185
Break-even live
Sensitivity live
| Price | -10% $96 | -5% $-44 | +0% $-185 | +5% $-325 | +10% $-465 |
|---|---|---|---|---|---|
| Rent | -10% $-534 | -5% $-359 | +0% $-185 | +5% $-10 | +10% $165 |
| Rate | -1.0pp $65 | -0.5pp $-59 | base $-185 | +0.5pp $-313 | +1.0pp $-443 |
UW: 25.0% down · 7.5% · 30yr · 1.5% tax · 5.0% vac · 8.0% maint · 8.0% mgmt
Financing live
Cash to close
- Down payment
- $123,750
- Closing costs
- $14,850
- Reserves months
- —
- Total cash needed
- —
Loan-product check · same deal, 3 products live
Conventional
25% down · 7.5% · 30yr
- Down + closing
- —
- Monthly P&I
- —
- Monthly cashflow
- —
- DSCR
- —
- Eligible?
- —
Personal DTI + credit; lowest rate.
DSCR
20% down · 8.5% · 30yr
- Down + closing
- —
- Monthly P&I
- —
- Monthly cashflow
- —
- DSCR
- —
- Eligible?
- —
No personal income docs; deal must DSCR.
Hard money
10% down · 12.0% · 12mo
- Down + closing
- —
- Monthly P&I
- —
- Monthly cashflow
- —
- DSCR
- —
- Eligible?
- —
Short-term bridge; refi at stabilization.
Rent comps 40 comps
| Address | Beds | Baths | Sqft | Rent | $/sqft | DOM | Units | Dist |
|---|---|---|---|---|---|---|---|---|
| 1510 Crockett St Houston, TX | 2.0 | 3.0 | 1912 | $2,800 | $1.46 | 45d | 1 | 0.19mi |
| 1512 Crockett St Unit A Houston, TX | 2.0 | 2.5 | 1808 | $2,800 | $1.55 | 45d | 1 | 0.19mi |
| 2114 Sabine St Unit 1257735P Houston, TX | 3.0 | 3.5 | 2594 | $6,588 | $2.54 | 45d | 1 | 0.41mi |
| 2114 Sabine St Houston, TX | 3.0 | 4.0 | 2020 | $3,200 | $1.58 | 45d | 1 | 0.41mi |
| 410 James St Houston, TX | 3.0 | 2.0 | 1602 | $6,750 | $4.21 | 45d | 1 | 0.48mi |
| 410 James St Unit 1031793P Houston, TX | 3.0 | 2.0 | 1593 | $5,668 | $3.56 | 1d | 1 | 0.48mi |
| 2018 Crockett St Unit 1029793P Houston, TX | 3.0 | 3.5 | 2507 | $6,482 | $2.59 | 7d | 1 | 0.54mi |
| 2018 Crockett St Unit 2018 Houston, TX | 3.0 | 3.5 | 2514 | $8,000 | $3.18 | 45d | 1 | 0.54mi |
| 2403 Everett St Unit A Houston, TX | 3.0 | 3.5 | 2093 | $2,800 | $1.34 | 45d | 1 | 0.79mi |
| 150 Sabine St Houston, TX | 1.0–2.0 | 1.0–2.0 | 1187 | $2,882 | $2.43 | 5d | 15 | 0.81mi |
| 414 Milam St Unit 3165 Houston, TX | 3.0 | 2.0 | 2421 | $9,002 | $3.72 | 0d | 1 | 0.83mi |
| 414 Milam St Unit 437 Houston, TX | 2.0 | 2.0 | 1585 | $3,857 | $2.43 | 13d | 1 | 0.83mi |
| 414 Milam St Unit 447 Houston, TX | 3.0 | 2.0 | 2421 | $8,973 | $3.71 | 45d | 1 | 0.83mi |
| 414 Milam St Unit 447 Houston, TX | 3.0 | 2.0 | 2421 | $8,991 | $3.71 | 13d | 1 | 0.83mi |
| 414 Milam St Unit 422 Houston, TX | 2.0 | 2.0 | 1585 | $3,833 | $2.42 | 9d | 1 | 0.83mi |
| 414 Milam St Unit 2187 Houston, TX | 2.0 | 2.0 | 1585 | $3,857 | $2.43 | 5d | 1 | 0.83mi |
| 414 Milam St Unit 2165 Houston, TX | 2.0 | 2.0 | 1585 | $3,817 | $2.41 | 1d | 1 | 0.83mi |
| 414 Milam St Unit 510 Houston, TX | 3.0 | 2.0 | 2421 | $9,230 | $3.81 | 16d | 1 | 0.83mi |
| 414 Milam St Unit 2162 Houston, TX | 2.0 | 2.0 | 1585 | $3,833 | $2.42 | 7d | 1 | 0.83mi |
| 414 Milam St Unit 2148 Houston, TX | 2.0 | 2.0 | 1585 | $3,868 | $2.44 | 0d | 1 | 0.83mi |
| 414 Milam St Ph 2-4602 Houston, TX | 2.0 | 2.0 | 2158 | $8,990 | $4.17 | 45d | 1 | 0.83mi |
| 414 Milam St Houston, TX | 2.0 | 2.5 | 1585 | $3,845 | $2.43 | 24d | 1 | 0.83mi |
| 414 Milam St Unit B1-2003 Houston, TX | 2.0 | 2.0 | 1585 | $4,513 | $2.85 | 45d | 1 | 0.83mi |
| 909 Texas Ave Houston, TX | 2.0 | 1.0–2.0 | 1262 | $3,129 | $2.48 | 3d | 36 | 0.93mi |
| 2013 Cochran St Houston, TX | 3.0 | 4.0 | 1888 | $2,600 | $1.38 | 0d | 1 | 0.96mi |
| 915 Texas Ave Unit 420 Houston, TX | 3.0 | 2.0 | 2366 | $4,655 | $1.97 | 45d | 1 | 0.98mi |
| 915 Texas Ave Unit 420 Houston, TX | 3.0 | 2.0 | 2366 | $4,655 | $1.97 | 20d | 1 | 0.98mi |
| 717 Fannin St Houston, TX | 2.0 | 2.0 | 1700 | $3,800 | $2.24 | 45d | 1 | 1.13mi |
| 2706 Cochran St Houston, TX | 3.0 | 3.5 | 1791 | $2,700 | $1.51 | 21d | 1 | 1.23mi |
| 1475 Texas St Houston, TX | 3.0 | 1.0–2.0 | 1304 | $6,350 | $4.87 | 45d | 28 | 1.25mi |
| 822 Ruthven St Houston, TX | 2.0 | 2.0 | 1846 | $2,400 | $1.30 | 1d | 1 | 1.28mi |
| 1116 Woodland St Houston, TX | 3.0 | 2.0 | 2400 | $4,000 | $1.67 | 45d | 1 | 1.33mi |
| 1399 Fannin St Houston, TX | 2.0 | 2.0 | 1595 | $3,846 | $2.41 | 26d | 1 | 1.36mi |
| 15 N Chenevert St Houston, TX | 2.0 | 1.0–2.0 | 1351 | $4,000 | $2.96 | 0d | 16 | 1.37mi |
| 1406 McKinney St Houston, TX | 2.0 | 2.0 | 1987 | $5,075 | $2.55 | 26d | 1 | 1.39mi |
| 600 Studemont St Houston, TX | 1.0–2.0 | 1.0–2.5 | 1227 | $2,799 | $2.28 | 1d | 25 | 1.39mi |
| 808 Crawford St Houston, TX | 1.0–3.0 | 1.0–3.5 | 1740 | $12,645 | $7.27 | 0d | 27 | 1.40mi |
| 1400 McKinney St Houston, TX | 1.0–2.0 | 1.0–2.5 | 2166 | $12,100 | $5.59 | 0d | 9 | 1.41mi |
| 1801 Smith St Houston, TX | 2.0 | 1.0–2.5 | 1110 | $4,867 | $4.38 | 0d | 27 | 1.44mi |
| 1757 Walker St Houston, TX | 2.0 | 2.0 | 1575 | $4,350 | $2.76 | 26d | 1 | 1.44mi |
Listing history 50 events
-
2026-06-21days on market $495,000 Active 37 DOM
-
2026-06-18days on market $495,000 Active 34 DOM
-
2026-06-17days on market $495,000 Active 33 DOM
-
2026-06-16days on market $495,000 Active 32 DOM
-
2026-06-15days on market $495,000 Active 31 DOM
-
2026-06-13days on market $495,000 Active 29 DOM
-
2026-06-10days on market $495,000 Active 25 DOM
-
2026-06-08days on market $495,000 Active 24 DOM
-
2026-06-07days on market $495,000 Active 23 DOM
-
2026-06-04days on market $495,000 Active 20 DOM
-
2026-06-01days on market $495,000 Active 17 DOM
-
2026-05-31days on market $495,000 Active 16 DOM
-
2026-05-15$495,000 Active 982-char remark
-
2026-05-15historical
-
2026-05-09price $495,000
-
2026-04-13price $549,000
-
2026-03-31$549,999 Active
-
2026-03-23historical
-
2026-02-23$549,999 Active
-
2026-02-23historical
-
2026-01-26price $549,999
-
2026-01-26$449,999 Active
-
2025-11-11historical $2,999
-
2025-09-26price $2,999
-
2025-09-17price $3,399
-
2025-08-20price $3,499
-
2025-08-05$3,700
-
2022-04-07soldstatus
-
2022-04-05soldstatus Sold
-
2022-03-09status Pending
-
2022-03-01status Option Pending
-
2022-02-24status Active
-
2022-01-30status Pending
-
2022-01-18status Option Pending
-
2022-01-12status Pending
-
2022-01-06status Option Pending
-
2022-01-03historical
-
2021-11-27$495,000 Active
-
2021-11-20historical
-
2021-10-27status Active
-
2021-10-20status Option Pending
-
2021-10-06status Active
-
2021-10-01status Option Pending
-
2021-08-04price $469,000
-
2021-07-07$480,000 Active
-
2014-11-19soldstatus Sold
-
2014-10-27historical
-
2014-10-27$469,000
-
1997-03-31soldstatus
-
1997-03-31soldstatus
ⓘ Source: listings_history table (triggers on properties + properties_extension) + one-shot
backfill from property_details.listing_events for pre-trigger history.
Tax reassessment forecast TX · Resets to sale price
- Current annual tax
- $10,529 · $877/mo
- Projected year-2 tax
- $10,529 · $877/mo
- Expected delta
- $0/yr ($0/mo · 0.0%)
ⓘ Screening estimate from a state-policy table — verify with the county assessor before closing.
Climate risk First Street
- Flood 5/10 Major FEMA zone X (shaded) · 24% chance over 30 yrs
- Wildfire 1/10 Low
- Heat 9/10 Extreme 7 d/yr ≥109°F today · 24 d/yr by 30 yrs out
- Wind 9/10 Extreme 99% chance of damaging wind over 30 yrs
- Air quality 3/10 Moderate 2 unhealthy d/yr today · 3 by 30 yrs out
Nearby sold comps map
Loading sold comps map…
Walkable amenities ~0.75 mi
Loading nearby amenities…
Taxation est. · year 1
- Rental income
- $53,088
- − Mortgage interest
- −$27,728
- − Property taxes
- −$10,529
- − Insurance
- −$2,475
- − Repairs & maintenance
- −$4,247
- − Management
- −$4,247
- − Depreciation
- −$14,400
- Taxable loss
- −$10,538
- Est. tax savings @ 24.0%
- +$2,529
- After-tax cash flow
- $315/yr
For passive investors: Depreciation is non-cash, so a rental often shows a tax loss while cash-flowing — sheltering income. Rental losses are passive: they offset passive income freely, and up to $25,000/yr can offset ordinary (W-2) income if you actively participate and your MAGI is under $100k (phasing out to $0 by $150k); unused losses carry forward. On sale, claimed depreciation is recaptured at up to 25%, and gains may owe capital-gains tax (a 1031 exchange can defer both). Figures are a year-1 estimate at your 24.0% rate — not tax advice; consult a CPA.
Schools (NCES district)
- District
- Houston ISD
- NCES district ID
- 4823640
- Math proficiency
- 27% ▼ -18.00%
- Reading proficiency
- 35% ▼ -6.00%
- Median HH income
- $46,054
- Composite
- 26.63/100
- National rank
- #7173
- State rank
- #593 of 826 in TX
Livability — Houston
- Score
- 74/100
- State rank
- #184
- US rank
- #4771
Category grades
Schools grade is shown separately in the Schools card above.
Census & demographics
- Census place
- Houston, TX
- County
- Harris County · 4,702,590 people
- City population
- 3,226,434
- Metro
- Houston-The Woodlands-Sugar Land, TX
- Population (ZIP)
- 47,808
- Household income
- $144,911
- Rent vs Own
- Severe rent burden
- 1812.0
Population outlook (Harris County) Hauer SSP2
- Today (2025)
- 5,571,493 people
- By 2030
- 6,089,821 · +9.3%
- By 2040
- 7,142,806 · +28.2%
- By 2050
- 8,185,864 · +46.9%
- By 2075
- 10,574,329 · +89.8%
- By 2100
- 12,109,958 · +117.4%
Race, ethnicity, and origin ACS 2023
- Neighborhood character
- Diverse neighborhood (Simpson 0.63)
- Race & ethnicity
- White 57% Hispanic / Latino 17% Two or more races 13% Asian 11% Black 9%
- Hispanic origin (detail)
- Mexican 12%
- Common ancestry
- Slovak 3% Romanian 3% Italian 3%
- Foreign-born
- 19% · Canada, China, South Korea
- Languages at home
- 75% English-only · Spanish 12% Other Indo-European 4% Chinese 2%
Political lean MEDSL · Harris
- 2024 margin
- Lean D (+5.5) · D 52.0% · R 46.4% · Other 1.6%
- 2008→2024 swing
- +3.9pp toward D · 2008: 1.6pp · 2024: 5.5pp
- All cycles
- 2024: D+5.5 2020: D+13.3 2016: D+12.4 2012: D+0.1 2008: D+1.6
Not yet ingested
- Civics
- —
Market trends
- HPI YoY
- ▼ -219.42%
- Current HPI
- 159.8157
- Rent YoY
- ▼ -0.83%
- Metro
- Houston-The Woodlands-Sugar Land, TX
- State GDP YoY
- ▲ 3.95%
- F500 in state
- 110
Industry mix (Fortune 500 HQ in TX)
| Industry | F500 HQs | Revenue |
|---|---|---|
| Energy | 16 | $1,198B |
|
||
| Technology | 5 | $198B |
|
||
| Engineering / Construction | 4 | $72B |
|
||
| Energy Services | 3 | $60B |
|
||
| Utilities | 3 | $41B |
|
||
| Healthcare | 2 | $330B |
|
||
Price history
+5.5% since first listed39 events — show timeline
- 2026-05-15 Listing Removed — HARMLS
- 2026-05-15 Listed $495,000 HARMLS
- 2026-05-09 Price Changed $495,000 HARMLS
- 2026-04-13 Price Changed $549,000 HARMLS
- 2026-03-31 Listed $549,999 HARMLS
- 2026-03-23 Listing Removed — HARMLS
- 2026-02-23 Listing Removed — HARMLS
- 2026-02-23 Listed $549,999 HARMLS
- 2026-01-26 Price Changed $549,999 HARMLS
- 2026-01-26 Listed $449,999 HARMLS
- 2025-11-11 Rental Removed $2,999 HARMLS
- 2025-09-26 Price Changed $2,999 HARMLS
- 2025-09-17 Price Changed $3,399 HARMLS
- 2025-08-20 Price Changed $3,499 HARMLS
- 2025-08-05 Listed for Rent $3,700 HARMLS
- 2022-04-07 Sold (Public Records) — Public Records
- 2022-04-05 Sold (MLS) — HARMLS
- 2022-03-09 Pending — HARMLS
- 2022-03-01 Pending — HARMLS
- 2022-02-24 Relisted — HARMLS
- 2022-01-30 Pending — HARMLS
- 2022-01-18 Pending — HARMLS
- 2022-01-12 Pending — HARMLS
- 2022-01-06 Pending — HARMLS
- 2022-01-03 Listing Removed — HARMLS
- 2021-11-27 Listed $495,000 HARMLS
- 2021-11-20 Listing Removed — HARMLS
- 2021-10-27 Relisted — HARMLS
- 2021-10-20 Pending — HARMLS
- 2021-10-06 Relisted — HARMLS
- 2021-10-01 Pending — HARMLS
- 2021-08-04 Price Changed $469,000 HARMLS
- 2021-07-07 Listed $480,000 HARMLS
- 2014-11-19 Sold (MLS) — HARMLS
- 2014-10-27 Listed $469,000 HARMLS
- 2014-10-27 Listing Removed — HARMLS
- 1997-03-31 Sold (Public Records) — Public Records
- 1997-03-31 Sold (Public Records) — Public Records
- 1997-03-31 Sold (Public Records) — Public Records
Property tax history
+17.7%/yrLatest (2025): $10,529 · +2.2% YoY. Source: county tax records.
Cash-flow waterfall
monthlySold comps — $/sqft
last 12 mo · ≤1 miLoading sold comps…