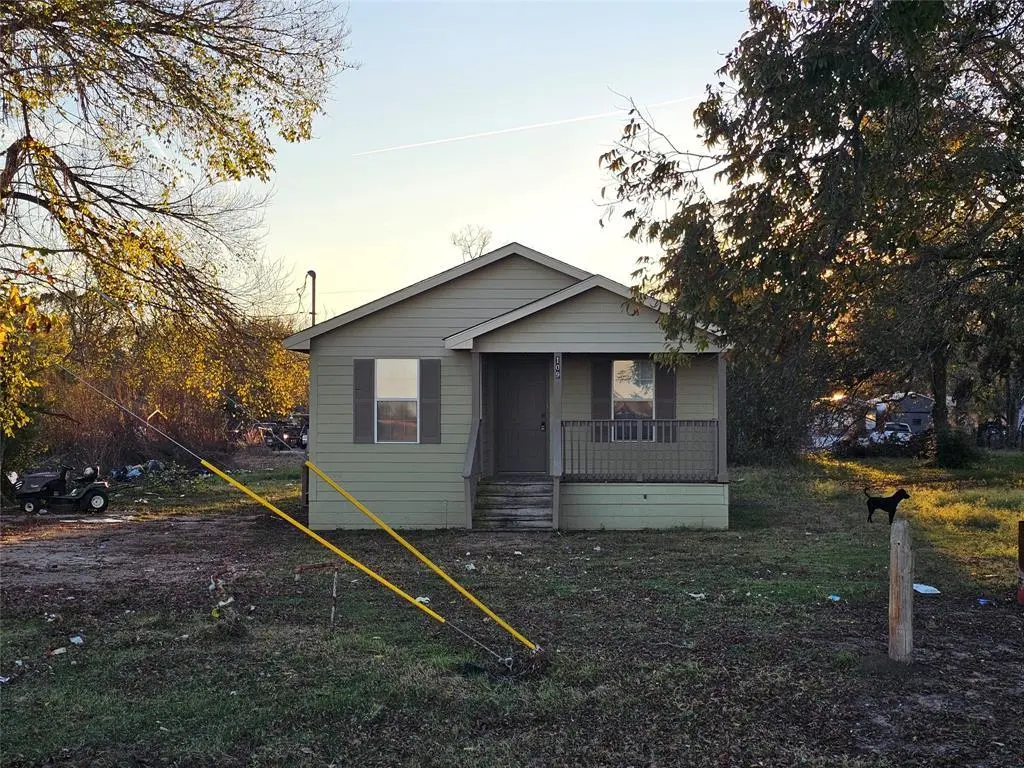
109 State Highway 309 · Goodlow, TX
Flood risk 1/10 · Minimal
- FEMA flood zone
- X (unshaded)
- Chance of flooding over 30 yrs
- 0.0%
- Est. flood insurance / yr
- $507 – $1,088
Fire risk 5/10 · Moderate
- Est. fire insurance / yr
- $1,222 – $2,270
Heat risk 7/10 · Major
- Hot days now (above 110°F)
- 7 days/yr
- Hot days in 30 yrs
- 25 days/yr
Wind risk 7/10 · Major
- Chance of severe wind over 30 yrs
- 78.0%
Air-quality risk 2/10 · Minimal
- Unhealthy air days now
- 0 days/yr
- Unhealthy air days in 30 yrs
- 1 days/yr
Risk factors via First Street. Map © Google.
Why this score? — see what drove the C- grade
The composite is a weighted blend of 9 inputs, each scored 0–100. Each bar is that input's sub-score; the figure is the points it added to the 100-point composite (weight × sub-score).
- Cash flow +15.4/30.0
- ARV discount +8.8/15.0
- Appreciation +7.8/10.0
- DSCR +4.7/10.0
- 1% rule +4.1/10.0
- Schools +3.1/10.0
- Livability +2.9/5.0
- Rent growth +2.5/5.0
- Condition / age +2.5/5.0
$125,000
🖨 Deal sheet (PDF) 📄 Offer letter ✓ Due diligence
Listing remarks MLS
Come and make this completely renovated home your own! Located at 109 State Highway 309 in Goodlow, TX (Kerens, TX 75144), this 3-bedroom, 2-bathroom 1222 square foot home features new waterproof laminate floors, fresh paint throughout, and new carpet in the bedrooms. The property has also an updated plumbing system. The home comes with a fridge, microwave, and stove. This single-family residence, built in 2006 on a 6,098 sq ft lot, is conveniently located near outdoor amenities. It is close to Richland Chambers Reservoir and Cedar Creek Lake, and just a short drive to either Corsicana or Athens.
Key facts
- Fresh paint
- New carpet
- Completely renovated
Tags
Neighborhood map
What this means for you Summary
Snapshot
- This is a 3-bed/2.0-bath single-family listed at $125k.
Deal economics
- At list price, monthly cash flow is $48 ($577/yr) — positive.
- The deal already cash-flows at list — no discount required.
- To meet the 1% rule (rent ≥ 1% of price), the offer needs to be $114k (8.9% below list).
- Recommended offer: $110k (12.0% below list) — sets the bar for market timing.
Location & tenants
- Location reads 58/100 on livability (#1,208 in TX) — a working-class tenant base; expect higher turnover. Strengths: cost of living A+, housing A+; Watch: schools F, crime F, amenities F.
- Kerens ISD (rural): math 37% / reading 37% proficiency, ranked #495 of 826 in TX (top 60%) — families likely to look elsewhere, expect single-tenant / working-renter base with shorter leases; 68% free/reduced lunch — lower-income household profile, screen leases tightly.
- Market conditions: 183 active listings in the ZIP; 522 units permitted in Navarro County in 2024 (0 in 5+ unit buildings).
Forward outlook
- In year one you build about $8k of equity ($864 loan paydown + $7k appreciation (5.6% local appreciation)).
- Navarro County population projected to shrink 4% by 2050 — rents likely to lag national; underwrite the cash flow, not the appreciation.
- At projected returns (5.6% appreciation + 3.0% rent growth), your $35k cash investment doubles in ~4 years — after that, you're playing with house money.
- By year 5, paydown + projected appreciation supports a ~$34k cash-out refi (75% LTV) — recoverable capital for the next deal without selling this one.
Negotiation context
- It's been on market 217 days — a 12% lower offer ($110k) is reasonable based on typical stale-listing flexibility.
- 4 sale attempts since 3y ago; this cycle's ask is 10317% above the opening price — seller raised mid-cycle; expect resistance to lowballs.
Risks & watch-outs
- Climate carrying-cost: major wind risk, 78% chance of damaging wind over 30y; moderate wildfire risk; extreme-heat days projected 7→25/yr by 2055 (HVAC capex compounding) — expect insurance premiums to compound above CPI over the hold.
Questions for the listing agent
- It's been on market 217 days. Have you received any prior offers? Is the seller open to a 12% concession, seller financing, or rate buy-down credit?
- Why hasn't it sold? Are there any deal-killer items the seller is aware of (foundation, flood, title, zoning, code violations)?
- Is there a deadline driving the sale (1031 exchange, divorce, estate, relocation)? That informs how much negotiation room exists.
- Schools are F-rated, which usually means shorter tenancies and higher turnover. Who's the typical renter profile here, and what's been the actual vacancy rate?
- Crime grade is F in this area — have there been break-ins, vandalism, or insurance claims at this property in the last 3 years? What carrier currently insures it and at what premium?
- What's the average days-on-market for RENTAL listings here right now (not sales)? A rising rental-DOM trend means longer vacancies and softer asking-rent achievability than the comps imply.
- What's the recent tenant-quality profile in this submarket — average credit score on applications, eviction rate, late-payment / NSF rate, and stable-employment percentage? A property-management company in the area should have these aggregated.
- How much new for-sale + rental construction is in the pipeline within 1–3 miles? Heavy new supply typically softens prices + rents 12–24 months out; constrained supply supports both.
Investment metrics
- 1% rule
- 0.91% ✗
- Cap rate
- 6.75%
- Cash-on-cash
- 1.65%
- DSCR
- 1.07
- GRM
- 9.1
CMA / ARV
- ARV (median comp)
- $128,584
- List price
- $125,000
- Delta
- -2.79%
- Verdict
- FAIR
- Comps
- 10 within 1.0 mi
Projected returns pro-forma
5.61% appreciation · 3.0% rent growth · sell at horizon
- IRR
- 15.8%
- Equity multiple
- 2.04×
- Total profit
- $36,283
- Equity at exit
- $75,515
- IRR
- 16.0%
- Equity multiple
- 4.00×
- Total profit
- $105,174
- Equity at exit
- $134,372
Cash invested: $35,000 (down + closing). Projections, not guarantees.
Landlord ↔ Tenant lean methodology
- Overall (STATE)
- 87 Strongly Landlord-Friendly
- State Texas
- 87 Strongly Landlord-Friendly · R+5
- County
- — inherits STATE
- City
- — inherits STATE
ZIP-level market 75144
- Home prices YoY
- 2.4%
- Active inventory
- 183
- Price-to-rent
- 9.1×
Monthly cashflow live
- Estimated rent
- $1,139 medium interval (Pro) →
- Mortgage (P&I)
- −$656
- Tax from tax record
- −$144 /mo · $1,732/yr
- Insurance
- −$52
- HOA
- −$0
- Lot rent
- −$0
- Vacancy / Maint / Mgmt
- −$239
- Net cashflow
- $48
Break-even live
Sensitivity live
| Price | -10% $119 | -5% $83 | +0% $48 | +5% $13 | +10% $-23 |
|---|---|---|---|---|---|
| Rent | -10% $-42 | -5% $3 | +0% $48 | +5% $93 | +10% $138 |
| Rate | -1.0pp $111 | -0.5pp $80 | base $48 | +0.5pp $16 | +1.0pp $-17 |
UW: 25.0% down · 7.5% · 30yr · 1.5% tax · 5.0% vac · 8.0% maint · 8.0% mgmt
Financing live
Cash to close
- Down payment
- $31,250
- Closing costs
- $3,750
- Reserves months
- —
- Total cash needed
- —
Loan-product check · same deal, 3 products live
Conventional
25% down · 7.5% · 30yr
- Down + closing
- —
- Monthly P&I
- —
- Monthly cashflow
- —
- DSCR
- —
- Eligible?
- —
Personal DTI + credit; lowest rate.
DSCR
20% down · 8.5% · 30yr
- Down + closing
- —
- Monthly P&I
- —
- Monthly cashflow
- —
- DSCR
- —
- Eligible?
- —
No personal income docs; deal must DSCR.
Hard money
10% down · 12.0% · 12mo
- Down + closing
- —
- Monthly P&I
- —
- Monthly cashflow
- —
- DSCR
- —
- Eligible?
- —
Short-term bridge; refi at stabilization.
Listing history 36 events
-
2026-06-22days on market $125,000 Active 217 DOM
-
2026-06-21days on market $125,000 Active 216 DOM
-
2026-06-21days on market $125,000 Active 215 DOM
-
2026-06-18remarks 668-char remark
-
2026-06-18days on market $125,000 Active 213 DOM
-
2026-06-17days on market $125,000 Active 212 DOM
-
2026-06-16days on market $125,000 Active 211 DOM
-
2026-06-15days on market $125,000 Active 210 DOM
-
2026-06-13days on market $125,000 Active 208 DOM
-
2026-06-12days on market $125,000 Active 207 DOM
-
2026-06-10days on market $125,000 Active 204 DOM
-
2026-06-08days on market $125,000 Active 203 DOM
-
2026-06-08days on market $125,000 Active 202 DOM
-
2026-06-07days on market $125,000 Active 201 DOM
-
2026-06-03days on market $125,000 Active 198 DOM
-
2026-06-02days on market $125,000 Active 197 DOM
-
2026-06-01days on market $125,000 Active 196 DOM
-
2026-05-31days on market $125,000 Active 195 DOM
-
2026-05-09$1,200
-
2026-01-21price $125,000 604-char remark
Show marketing remark (604 chars)
Come and make this completely renovated home your own! Located at 109 State Highway 309 in Goodlow, TX (Kerens, TX 75144), this 3-bedroom, 2-bathroom 1222 square foot home features new waterproof laminate floors, fresh paint throughout, and new carpet in the bedrooms. The property has also an updated plumbing system. The home comes with a fridge, microwave, and stove. This single-family residence, built in 2006 on a 6,098 sq ft lot, is conveniently located near outdoor amenities. It is close to Richland Chambers Reservoir and Cedar Creek Lake, and just a short drive to either Corsicana or Athens.
-
2025-11-17$134,999 Active 604-char remark
Show marketing remark (604 chars)
Come and make this completely renovated home your own! Located at 109 State Highway 309 in Goodlow, TX (Kerens, TX 75144), this 3-bedroom, 2-bathroom 1222 square foot home features new waterproof laminate floors, fresh paint throughout, and new carpet in the bedrooms. The property has also an updated plumbing system. The home comes with a fridge, microwave, and stove. This single-family residence, built in 2006 on a 6,098 sq ft lot, is conveniently located near outdoor amenities. It is close to Richland Chambers Reservoir and Cedar Creek Lake, and just a short drive to either Corsicana or Athens.
-
2025-04-01historical
-
2024-08-21price $139,900
-
2024-07-17price $146,900
-
2024-05-15price $149,900
-
2024-04-17$150,000 Active
-
2023-12-26soldstatus
-
2023-12-22status Pending
-
2023-12-22soldstatus Closed
-
2023-11-17soldstatus
-
2023-11-16$67,500 Active
-
2006-06-06soldstatus
-
1996-11-14soldstatus
-
1979-05-04soldstatus
-
1968-06-12soldstatus
-
1944-06-24soldstatus
ⓘ Source: listings_history table (triggers on properties + properties_extension) + one-shot
backfill from property_details.listing_events for pre-trigger history.
Tax reassessment forecast TX · Resets to sale price
- Current annual tax
- $1,732 · $144/mo
- Projected year-2 tax
- $2,288 · $191/mo
- Expected delta
- +$555/yr (+$46/mo · 32.0%)
ⓘ Screening estimate from a state-policy table — verify with the county assessor before closing.
Climate risk First Street
- Flood 1/10 Low FEMA zone X (unshaded) · 0% chance over 30 yrs
- Wildfire 5/10 Major
- Heat 7/10 Severe 7 d/yr ≥110°F today · 25 d/yr by 30 yrs out
- Wind 7/10 Severe 78% chance of damaging wind over 30 yrs
- Air quality 2/10 Low 0 unhealthy d/yr today · 1 by 30 yrs out
Nearby sold comps map
Loading sold comps map…
Walkable amenities ~0.75 mi
Loading nearby amenities…
Taxation est. · year 1
- Rental income
- $13,672
- − Mortgage interest
- −$7,002
- − Property taxes
- −$1,732
- − Insurance
- −$625
- − Repairs & maintenance
- −$1,094
- − Management
- −$1,094
- − Depreciation
- −$3,636
- Taxable loss
- −$1,511
- Est. tax savings @ 24.0%
- +$363
- After-tax cash flow
- $940/yr
For passive investors: Depreciation is non-cash, so a rental often shows a tax loss while cash-flowing — sheltering income. Rental losses are passive: they offset passive income freely, and up to $25,000/yr can offset ordinary (W-2) income if you actively participate and your MAGI is under $100k (phasing out to $0 by $150k); unused losses carry forward. On sale, claimed depreciation is recaptured at up to 25%, and gains may owe capital-gains tax (a 1031 exchange can defer both). Figures are a year-1 estimate at your 24.0% rate — not tax advice; consult a CPA.
Schools (NCES district)
- District
- Kerens ISD
- NCES district ID
- 4825530
- Math proficiency
- 37% ▼ -9.00%
- Reading proficiency
- 37% ▲ 3.00%
- Median HH income
- $37,364
- Composite
- 30.81/100
- National rank
- #6142
- State rank
- #495 of 826 in TX
Livability — Goodlow
- Score
- 58/100
- State rank
- #1208
- US rank
- #21056
Category grades
Schools grade is shown separately in the Schools card above.
Census & demographics
- Census place
- Goodlow, TX
- City population
- 3,798
- Population (ZIP)
- 3,798
Population outlook (Navarro County) Hauer SSP2
- Today (2025)
- 48,397 people
- By 2030
- 48,096 · -0.6%
- By 2040
- 47,394 · -2.1%
- By 2050
- 46,541 · -3.8%
- By 2075
- 44,940 · -7.1%
- By 2100
- 42,288 · -12.6%
Race, ethnicity, and origin ACS 2023
- Neighborhood character
- Majority White (64%)
- Race & ethnicity
- White 64% Black 18% Hispanic / Latino 12% Two or more races 8%
- Hispanic origin (detail)
- Mexican 9%
- Common ancestry
- Lithuanian 3% Serbian 1% Italian 1%
- Foreign-born
- 5% · Canada
- Languages at home
- 92% English-only · Spanish 8%
Political lean MEDSL · Navarro
- 2024 margin
- Solid R (+51.8) · D 23.7% · R 75.6%
- 2008→2024 swing
- -18.7pp toward R · 2008: -33.1pp · 2024: -51.8pp
- All cycles
- 2024: R+51.8 2020: R+45.5 2016: R+48.8 2012: R+42.4 2008: R+33.1
Not yet ingested
- Civics
- —
Market trends
- HPI YoY
- ▲ 5.61%
- Current HPI
- 236.2915
- Rent YoY
- —
- Metro
- —
- State GDP YoY
- ▲ 3.95%
- F500 in state
- 110
Industry mix (Fortune 500 HQ in TX)
| Industry | F500 HQs | Revenue |
|---|---|---|
| Energy | 16 | $1,198B |
|
||
| Technology | 5 | $198B |
|
||
| Engineering / Construction | 4 | $72B |
|
||
| Energy Services | 3 | $60B |
|
||
| Utilities | 3 | $41B |
|
||
| Healthcare | 2 | $330B |
|
||
Price history
-98.2% since first listed18 events — show timeline
- 2026-05-09 Listed for Rent $1,200 NTREIS
- 2026-01-21 Price Changed $125,000 NTREIS
- 2025-11-17 Listed $134,999 NTREIS
- 2025-04-01 Listing Removed — NTREIS
- 2024-08-21 Price Changed $139,900 NTREIS
- 2024-07-17 Price Changed $146,900 NTREIS
- 2024-05-15 Price Changed $149,900 NTREIS
- 2024-04-17 Listed $150,000 NTREIS
- 2023-12-26 Sold (Public Records) — Public Records
- 2023-12-22 Pending — CBMLS
- 2023-12-22 Sold (MLS) — CBMLS
- 2023-11-17 Sold (Public Records) — Public Records
- 2023-11-16 Listed $67,500 CBMLS
- 2006-06-06 Sold (Public Records) — Public Records
- 1996-11-14 Sold (Public Records) — Public Records
- 1979-05-04 Sold (Public Records) — Public Records
- 1968-06-12 Sold (Public Records) — Public Records
- 1944-06-24 Sold (Public Records) — Public Records
Property tax history
+5.0%/yrLatest (2025): $1,732 · -6.3% YoY. Source: county tax records.
Cash-flow waterfall
monthlySold comps — $/sqft
last 12 mo · ≤1 miLoading sold comps…