202 Mcneil St · Palestine, TX
Flood risk 1/10 · Minimal
- FEMA flood zone
- X (unshaded)
- Chance of flooding over 30 yrs
- 0.0%
- Est. flood insurance / yr
- $507 – $1,088
Fire risk 4/10 · Minor
- Est. fire insurance / yr
- $1,222 – $2,270
Heat risk 7/10 · Major
- Hot days now (above 110°F)
- 7 days/yr
- Hot days in 30 yrs
- 27 days/yr
Wind risk 7/10 · Major
- Chance of severe wind over 30 yrs
- 78.0%
Air-quality risk 1/10 · Minimal
- Unhealthy air days now
- 0 days/yr
- Unhealthy air days in 30 yrs
- 0 days/yr
Risk factors via First Street. Map © Google.
Why this score? — see what drove the B- grade
The composite is a weighted blend of 9 inputs, each scored 0–100. Each bar is that input's sub-score; the figure is the points it added to the 100-point composite (weight × sub-score).
- Cash flow +30.0/30.0
- 1% rule +10.0/10.0
- DSCR +10.0/10.0
- ARV discount +7.5/15.0
- Livability +3.3/5.0
- Schools +3.0/10.0
- Rent growth +2.5/5.0
- Condition / age +1.0/5.0
- Appreciation +0.0/10.0
$45,589
🖨 Deal sheet (PDF) 📄 Offer letter ✓ Due diligence
Listing remarks MLS
INVESTOR FIXER UPPER! Welcome to 202 McNeil St, a potential-filled property in Palestine, TX, presenting a great investment opportunity. This one bedroom, one bathroom home is situated on a 6,000 Sq. Ft. corner lot, offering both a convenient location and plenty of yard space. This property is being sold AS IS but has lots of potential. WE MAKE IT EASY TO OWN. This is a great opportunity! Don't wait, call us today to get more information on the owner's easy terms and smooth process that may be able to put the deed in your name and make this your dream investment. Call us, we have OTHER INVESTMENT PROPERTIES in the Palestine Area.
Key facts
- 6,000 sq ft lot
- Built 1940
- Listed 435 days
Neighborhood map
What this means for you Summary
Snapshot
- This is a 1-bed/1.0-bath single-family listed at $46k. Condition is rated poor.
Deal economics
- At list price, monthly cash flow is $439 ($5k/yr) — positive.
- The deal already cash-flows at list — no discount required.
- Meets the 1% rule at list price ($954 rent vs $46k).
- Recommended offer: $40k (12.0% below list) — sets the bar for market timing.
- Cap rate 17.8% vs local median 3.9% in Palestine — top-decile yield for the area; either an underpriced asset or a hidden risk that comps aren't pricing in. Stress-test before assuming the spread holds.
Location & tenants
- Location reads 66/100 on livability (#657 in TX) — a middle-class / working-renter tenant base. Strengths: cost of living A+, housing A+; Watch: crime D+, schools D, employment D.
- Palestine ISD (town): math 36% / reading 37% proficiency, ranked #509 of 826 in TX (top 62%) — families likely to look elsewhere, expect single-tenant / working-renter base with shorter leases; 67% free/reduced lunch — lower-income household profile, screen leases tightly.
- Market conditions: 196 active listings in the ZIP; 29 units permitted in Anderson County in 2024 (0 in 5+ unit buildings).
Forward outlook
- Local home prices are declining (-3.0%/yr); year-one equity from $315 of loan paydown is wiped out by about $1k of value loss. Plan a longer hold.
- Anderson County population projected at +4% by 2050 — modest demand growth; plan on rents tracking national, not racing it.
- At projected returns (-3.0% appreciation + 3.0% rent growth), your $13k cash investment doubles in ~3 years — after that, you're playing with house money.
Negotiation context
- It's been on market 436 days — a 12% lower offer ($40k) is reasonable based on typical stale-listing flexibility.
Risks & watch-outs
- Watch-outs: built in 1940 — expect roof / HVAC / electrical / plumbing capex.
- Climate carrying-cost: major wind risk, 78% chance of damaging wind over 30y; extreme-heat days projected 7→27/yr by 2055 (HVAC capex compounding) — expect insurance premiums to compound above CPI over the hold.
Questions for the listing agent
- It's been on market 436 days. Have you received any prior offers? Is the seller open to a 12% concession, seller financing, or rate buy-down credit?
- Have any recent inspections been done? Can we get a copy of the seller's disclosures and any deferred-maintenance estimates?
- Built in 1940 — when were the roof, HVAC, electrical panel, plumbing, and water heater last replaced?
- Why hasn't it sold? Are there any deal-killer items the seller is aware of (foundation, flood, title, zoning, code violations)?
- Is there a deadline driving the sale (1031 exchange, divorce, estate, relocation)? That informs how much negotiation room exists.
- Schools are D-rated, which usually means shorter tenancies and higher turnover. Who's the typical renter profile here, and what's been the actual vacancy rate?
- Crime grade is D in this area — have there been break-ins, vandalism, or insurance claims at this property in the last 3 years? What carrier currently insures it and at what premium?
- What's the average days-on-market for RENTAL listings here right now (not sales)? A rising rental-DOM trend means longer vacancies and softer asking-rent achievability than the comps imply.
- What's the recent tenant-quality profile in this submarket — average credit score on applications, eviction rate, late-payment / NSF rate, and stable-employment percentage? A property-management company in the area should have these aggregated.
- How much new for-sale + rental construction is in the pipeline within 1–3 miles? Heavy new supply typically softens prices + rents 12–24 months out; constrained supply supports both.
Investment metrics
- 1% rule
- 2.09% ✓
- Cap rate
- 17.84%
- Cash-on-cash
- 41.24%
- DSCR
- 2.83
- GRM
- 4.0
CMA / ARV
- ARV (median comp)
- $111,777
- List price
- $45,589
- Delta
- -59.21%
- Verdict
- UNDERPRICED
- Comps
- 2 within 1.0 mi
Show comp detail 1 sale within ~0.75 mi
| Address | Dist | Beds/Ba | Sqft | Sold | Price | $/sf | Match |
|---|---|---|---|---|---|---|---|
| 1618 Eilenstein St | 0.19mi | 2/2.0 (+1) | 600 (0%) | 22mo | $116,999 | $195 | 64 |
Match score weights: distance 35% · size 25% · config 20% · recency 20%. Top-matched comps best support the ARV.
Projected returns pro-forma
-3.0% appreciation · 3.0% rent growth · sell at horizon
- IRR
- 37.8%
- Equity multiple
- 2.61×
- Total profit
- $20,567
- Equity at exit
- $6,797
- IRR
- 44.3%
- Equity multiple
- 5.23×
- Total profit
- $53,944
- Equity at exit
- $3,942
Cash invested: $12,765 (down + closing). Projections, not guarantees.
Landlord ↔ Tenant lean methodology
- Overall (STATE)
- 87 Strongly Landlord-Friendly
- State Texas
- 87 Strongly Landlord-Friendly · R+5
- County
- — inherits STATE
- City
- — inherits STATE
ZIP-level market 75801
- Home prices YoY
- -35.0%
- Active inventory
- 196
- Price-to-rent
- 4.0×
Monthly cashflow live
- Estimated rent
- $954 medium interval (Pro) →
- Mortgage (P&I)
- −$239
- Tax est. 1.5%
- −$57 /mo · $684/yr
- Insurance
- −$19
- HOA
- −$0
- Vacancy / Maint / Mgmt
- −$200
- Net cashflow
- $439
Break-even live
Sensitivity live
| Price | -10% $470 | -5% $454 | +0% $439 | +5% $423 | +10% $407 |
|---|---|---|---|---|---|
| Rent | -10% $363 | -5% $401 | +0% $439 | +5% $476 | +10% $514 |
| Rate | -1.0pp $462 | -0.5pp $450 | base $439 | +0.5pp $427 | +1.0pp $415 |
UW: 25.0% down · 7.5% · 30yr · 1.5% tax · 5.0% vac · 8.0% maint · 8.0% mgmt
Financing live
Cash to close
- Down payment
- $11,397
- Closing costs
- $1,368
- Reserves months
- —
- Total cash needed
- —
Loan-product check · same deal, 3 products live
Conventional
25% down · 7.5% · 30yr
- Down + closing
- —
- Monthly P&I
- —
- Monthly cashflow
- —
- DSCR
- —
- Eligible?
- —
Personal DTI + credit; lowest rate.
DSCR
20% down · 8.5% · 30yr
- Down + closing
- —
- Monthly P&I
- —
- Monthly cashflow
- —
- DSCR
- —
- Eligible?
- —
No personal income docs; deal must DSCR.
Hard money
10% down · 12.0% · 12mo
- Down + closing
- —
- Monthly P&I
- —
- Monthly cashflow
- —
- DSCR
- —
- Eligible?
- —
Short-term bridge; refi at stabilization.
Listing history 16 events
-
2026-06-19days on market $45,589 Active 436 DOM
-
2026-06-18days on market $45,589 Active 435 DOM
-
2026-06-17days on market $45,589 Active 434 DOM
-
2026-06-16days on market $45,589 Active 433 DOM
-
2026-06-15days on market $45,589 Active 432 DOM
-
2026-06-14days on market $45,589 Active 430 DOM
-
2026-06-12days on market $45,589 Active 429 DOM
-
2026-06-09days on market $45,589 Active 426 DOM
-
2026-06-08days on market $45,589 Active 425 DOM
-
2026-06-07days on market $45,589 Active 424 DOM
-
2026-06-04days on market $45,589 Active 420 DOM
-
2026-06-02days on market $45,589 Active 419 DOM
-
2026-06-01days on market $45,589 Active 418 DOM
-
2026-05-31days on market $45,589 Active 417 DOM
-
2026-05-31days on market $45,589 Active 416 DOM
-
2025-04-09$45,589 Active 637-char remark
Show marketing remark (637 chars)
INVESTOR FIXER UPPER! Welcome to 202 McNeil St, a potential-filled property in Palestine, TX, presenting a great investment opportunity. This one bedroom, one bathroom home is situated on a 6,000 Sq. Ft. corner lot, offering both a convenient location and plenty of yard space. This property is being sold AS IS but has lots of potential. WE MAKE IT EASY TO OWN. This is a great opportunity! Don't wait, call us today to get more information on the owner's easy terms and smooth process that may be able to put the deed in your name and make this your dream investment. Call us, we have OTHER INVESTMENT PROPERTIES in the Palestine Area.
ⓘ Source: listings_history table (triggers on properties + properties_extension) + one-shot
backfill from property_details.listing_events for pre-trigger history.
Climate risk First Street
- Flood 1/10 Low FEMA zone X (unshaded) · 0% chance over 30 yrs
- Wildfire 4/10 Moderate
- Heat 7/10 Severe 7 d/yr ≥110°F today · 27 d/yr by 30 yrs out
- Wind 7/10 Severe 78% chance of damaging wind over 30 yrs
- Air quality 1/10 Low 0 unhealthy d/yr today · 0 by 30 yrs out
Nearby sold comps map
Loading sold comps map…
Walkable amenities ~0.75 mi
Loading nearby amenities…
Taxation est. · year 1
- Rental income
- $11,449
- − Mortgage interest
- −$2,554
- − Property taxes
- −$684
- − Insurance
- −$228
- − Repairs & maintenance
- −$916
- − Management
- −$916
- − Depreciation
- −$1,326
- Taxable income
- $4,826
- Est. tax owed @ 24.0%
- −$1,158
- After-tax cash flow
- $4,106/yr
For passive investors: Depreciation is non-cash, so a rental often shows a tax loss while cash-flowing — sheltering income. Rental losses are passive: they offset passive income freely, and up to $25,000/yr can offset ordinary (W-2) income if you actively participate and your MAGI is under $100k (phasing out to $0 by $150k); unused losses carry forward. On sale, claimed depreciation is recaptured at up to 25%, and gains may owe capital-gains tax (a 1031 exchange can defer both). Figures are a year-1 estimate at your 24.0% rate — not tax advice; consult a CPA.
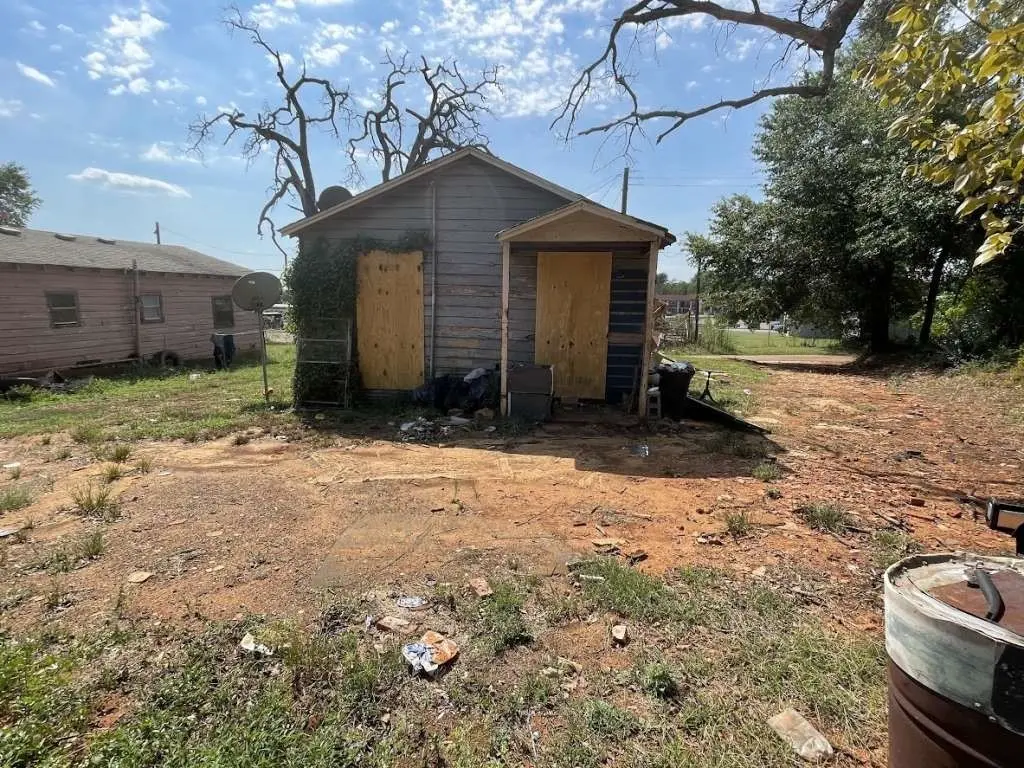
Condition & rehab AI · 6 photos
This property requires extensive repairs and maintenance, including exterior siding, roof, and interior repairs. Landscaping and curb appeal improvements are also needed. Significant investment is required to bring the property up to a livable condition.
Repairs flagged
- Major Exterior siding — Severe damage and missing sections
- Major Roof — Visible damage
- Major Interior walls — Boarded up and in poor condition
- Major Flooring — Likely damaged given the overall condition
- Major Systems — Likely in poor condition
Value-add opportunities
- Both Landscaping and exterior repairs — Improving curb appeal and property value
- Both Interior repairs and updates — Enhancing living space and increasing rental potential
- Both Roof repair — Critical for structural integrity and safety
- Both Exterior siding repair — Improves property appearance and value
Renovation cost estimate screening
| Repair item | Severity | Est. cost |
|---|---|---|
| Exterior siding · Severe damage and missing sections | Major | $15,000–50,000 |
| Roof · Visible damage | Major | $15,000–50,000 |
| Interior walls · Boarded up and in poor condition | Major | $15,000–50,000 |
| Flooring · Likely damaged given the overall condition | Major | $15,000–50,000 |
| Systems · Likely in poor condition | Major | $15,000–50,000 |
| Total estimated repair cost · 5 items | $75,000–250,000 |
Value-add ROI direction
- Both Landscaping and exterior repairs — Improving curb appeal and property value ↑
- Both Interior repairs and updates — Enhancing living space and increasing rental potential ↑
- Both Roof repair — Critical for structural integrity and safety ↑
- Both Exterior siding repair — Improves property appearance and value ↑
ⓘ Cost ranges are severity-bucket heuristics (US national rule-of-thumb). Get contractor quotes + a written scope before underwriting a rehab budget.
Schools (NCES district)
- District
- Palestine ISD
- NCES district ID
- 4834050
- Math proficiency
- 36% ▼ -12.00%
- Reading proficiency
- 37% ▼ -1.00%
- Median HH income
- $36,881
- Composite
- 30.34/100
- National rank
- #6267
- State rank
- #509 of 826 in TX
Livability — Palestine
- Score
- 66/100
- State rank
- #657
- US rank
- #12357
Category grades
Schools grade is shown separately in the Schools card above.
Census & demographics
- Census place
- Palestine, TX
- County
- Anderson County · 17,531 people
- City population
- 17,531
- Metro
- Palestine, TX
- Population (ZIP)
- 17,531
- Household income
- $56,787
- Rent vs Own
- Severe rent burden
- 609.0
Population outlook (Anderson County) Hauer SSP2
- Today (2025)
- 56,663 people
- By 2030
- 57,373 · +1.3%
- By 2040
- 58,960 · +4.1%
- By 2050
- 59,073 · +4.3%
- By 2075
- 53,737 · -5.2%
- By 2100
- 42,516 · -25.0%
Race, ethnicity, and origin ACS 2023
- Neighborhood character
- Diverse neighborhood (Simpson 0.67)
- Race & ethnicity
- White 48% Black 27% Hispanic / Latino 17% Two or more races 15% Native American 3%
- Hispanic origin (detail)
- Mexican 12%
- Common ancestry
- Lithuanian 2% Iranian 1% Slovak 1%
- Foreign-born
- 8% · Canada
- Languages at home
- 85% English-only · Spanish 12%
Political lean MEDSL · Anderson
- 2024 margin
- Solid R (+61.8) · D 18.8% · R 80.6%
- 2008→2024 swing
- -18.3pp toward R · 2008: -43.5pp · 2024: -61.8pp
- All cycles
- 2024: R+61.8 2020: R+58.0 2016: R+58.1 2012: R+52.2 2008: R+43.5
Not yet ingested
- Civics
- —
Market trends
- HPI YoY
- ▼ -83.17%
- Current HPI
- 154.6138
- Rent YoY
- —
- Metro
- Palestine, TX
- State GDP YoY
- ▲ 3.95%
- F500 in state
- 110
Industry mix (Fortune 500 HQ in TX)
| Industry | F500 HQs | Revenue |
|---|---|---|
| Energy | 16 | $1,198B |
|
||
| Technology | 5 | $198B |
|
||
| Engineering / Construction | 4 | $72B |
|
||
| Energy Services | 3 | $60B |
|
||
| Utilities | 3 | $41B |
|
||
| Healthcare | 2 | $330B |
|
||
Price history
1 event — show timeline
- 2025-04-09 Listed $45,589 HARMLS
Cash-flow waterfall
monthlySold comps — $/sqft
last 12 mo · ≤1 miLoading sold comps…