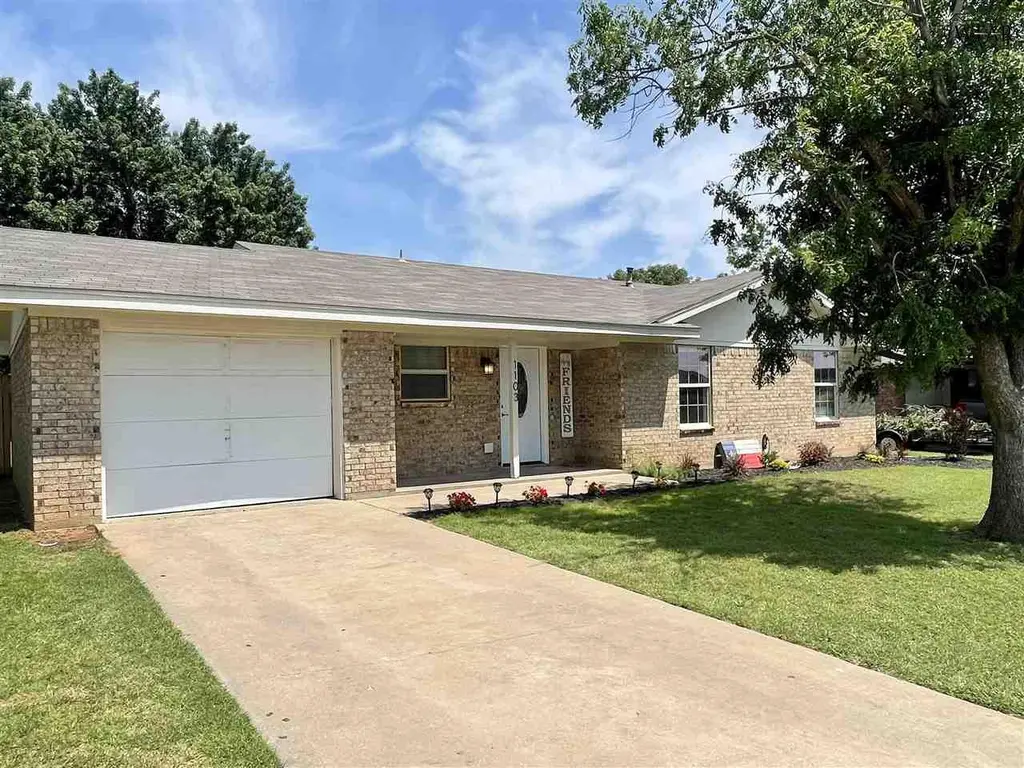
1103 Lisa Ln · Burkburnett, TX
Flood risk 1/10 · Minimal
- FEMA flood zone
- X (unshaded)
- Chance of flooding over 30 yrs
- 0.0%
- Est. flood insurance / yr
- $507 – $1,088
Fire risk 8/10 · Major
- Est. fire insurance / yr
- $1,222 – $2,270
Heat risk 7/10 · Major
- Hot days now (above 109°F)
- 7 days/yr
- Hot days in 30 yrs
- 20 days/yr
Wind risk 4/10 · Minor
- Chance of severe wind over 30 yrs
- 9.0%
Air-quality risk 1/10 · Minimal
- Unhealthy air days now
- 0 days/yr
- Unhealthy air days in 30 yrs
- 0 days/yr
Risk factors via First Street. Map © Google.
Why this score? — see what drove the D- grade
The composite is a weighted blend of 9 inputs, each scored 0–100. Each bar is that input's sub-score; the figure is the points it added to the 100-point composite (weight × sub-score).
- Cash flow +13.9/30.0
- ARV discount +6.1/15.0
- DSCR +4.2/10.0
- 1% rule +3.8/10.0
- Livability +3.5/5.0
- Schools +2.9/10.0
- Rent growth +2.5/5.0
- Condition / age +2.5/5.0
- Appreciation +0.0/10.0
$179,900
🖨 Deal sheet 📄 Offer letter ✓ Due diligence
Listing remarks MLS
Beautifully remodeled 3bed/2bath home with a 1-car garage! This gem boasts floor-to-ceiling cabinets, subway tile, and granite countertops in the kitchen. The hall bathroom has been tastefully updated. Neutral tones throughout create a soothing ambiance. Enjoy the covered patio and admire the lovely landscaping. Plus, there's an outbuilding for extra storage space. Don't miss out on this fantastic property!
Key facts
- Privacy fence
- Beautiful backyard
- Fantastic workshop
Tags
Property features AI
Exterior
- Parking: Attached garage with garage door opener
- Security: Security system
- Utilities: Public water; Public sewer
- Home design: Single-family residence; Single story; Faces west
- Construction: Brick and vinyl siding exterior; Composition roof; Slab foundation; Residential property
- Exterior features: Fenced yard; Workshop
Interior
- Kitchen: Range; Oven; Electric oven; Dishwasher; Disposal
- Flooring: Laminate
- Heating & cooling: Central heating (natural gas); Central air conditioning
- Interior features: Security system
Neighborhood map
What this means for you Summary
Snapshot
- This is a 3-bed/2.0-bath single-family listed at $180k.
Deal economics
- At list price, monthly cash flow is $18 ($219/yr) — positive.
- The deal already cash-flows at list — no discount required.
- To meet the 1% rule (rent ≥ 1% of price), the offer needs to be $157k (12.5% below list).
- Recommended offer: $157k (12.5% below list) — sets the bar for 1% rule.
Location & tenants
- Location reads 70/100 on livability (#345 in TX) — a middle-class / working-renter tenant base. Strengths: cost of living A+, housing A+, crime A-; Watch: health & safety C-, employment D+, amenities F.
- Burkburnett ISD (town): math 35% / reading 32% proficiency, ranked #529 of 826 in TX (top 64%) — families likely to look elsewhere, expect single-tenant / working-renter base with shorter leases.
- Zoned schools: Burkburnett Middle (math 35% / reading 33%, grade F, #892 of 1,662 statewide, top 55%, 736 students, 53% FRL); Burkburnett H S (math 39% / reading 40%, grade F, #821 of 1,632 statewide, top 53%, 834 students, 45% FRL).
- Market conditions: 71 active listings in the ZIP; 3 comparable units currently listed for rent nearby; rentals lingering (median 44d on market — plan ~5-8 weeks vacancy on turnover, expect pricing pressure); 100% of comp listings sitting > 30 days — soft ceiling on asking rent; 231 units permitted in Wichita County in 2024 (10 in 5+ unit buildings).
Forward outlook
- Local home prices are declining (-3.0%/yr); year-one equity from $1k of loan paydown is wiped out by about $5k of value loss. Plan a longer hold.
- Wichita County population projected to shrink 7% by 2050 — rents likely to lag national; underwrite the cash flow, not the appreciation.
Negotiation context
- Only 14 days on market — expect competitive offers; lowballing is unlikely to land.
- 2 sale attempts since 3y ago with the ask held roughly flat each time — persistent listings suggest the price (not the market) is what's stuck; bring a comps-based counter.
Risks & watch-outs
- Climate carrying-cost: severe wildfire risk; extreme-heat days projected 7→20/yr by 2055 (HVAC capex compounding) — expect insurance premiums to compound above CPI over the hold.
Questions for the listing agent
- Is there a deadline driving the sale (1031 exchange, divorce, estate, relocation)? That informs how much negotiation room exists.
- Schools are D-rated, which usually means shorter tenancies and higher turnover. Who's the typical renter profile here, and what's been the actual vacancy rate?
- The area grade is low — what's the realistic commute time and amenity access for the typical tenant pool here? Any planned neighborhood developments (good or bad) we should know about?
- What's the average days-on-market for RENTAL listings here right now (not sales)? A rising rental-DOM trend means longer vacancies and softer asking-rent achievability than the comps imply.
- What's the recent tenant-quality profile in this submarket — average credit score on applications, eviction rate, late-payment / NSF rate, and stable-employment percentage? A property-management company in the area should have these aggregated.
- How much new for-sale + rental construction is in the pipeline within 1–3 miles? Heavy new supply typically softens prices + rents 12–24 months out; constrained supply supports both.
Investment metrics
- 1% rule
- 0.88% ✗
- Cap rate
- 6.41%
- Cash-on-cash
- 0.44%
- DSCR
- 1.02
- GRM
- 9.5
CMA / ARV
- ARV (on-the-fly)
- $174,344
- Comps found
- 2
Show comp detail 2 sales within ~0.75 mi
| Address | Dist | Beds/Ba | Sqft | Sold | Price | $/sf | Match |
|---|---|---|---|---|---|---|---|
| 1109 Ruby Rd | 0.26mi | 3/1.5 | 1,080 (-8%) | 12mo | $159,900 | $148 | 62 |
| 1002 E Beverly Loop | 0.49mi | 2/1.0 (-1) | 1,251 (+6%) | 8mo | $115,100 | $92 | 51 |
Match score weights: distance 35% · size 25% · config 20% · recency 20%. Top-matched comps best support the ARV.
Projected returns pro-forma
-3.0% appreciation · 3.0% rent growth · sell at horizon
- IRR
- -15.6%
- Equity multiple
- 0.44×
- Total profit
- $-27,974
- Equity at exit
- $26,824
- IRR
- -7.1%
- Equity multiple
- 0.55×
- Total profit
- $-22,808
- Equity at exit
- $15,554
Cash invested: $50,372 (down + closing). Projections, not guarantees.
Landlord ↔ Tenant lean methodology
- Overall (STATE)
- 87 Strongly Landlord-Friendly
- State Texas
- 87 Strongly Landlord-Friendly · R+5
- County
- — inherits STATE
- City
- — inherits STATE
ZIP-level market 76354
- Home prices YoY
- -34.5%
- Active inventory
- 71
- Price-to-rent
- 9.5×
Monthly cashflow live
- Estimated rent
- $1,574 medium interval (Pro) →
- Mortgage (P&I)
- −$943
- Tax from tax record
- −$207 /mo · $2,484/yr
- Insurance
- −$75
- HOA
- −$0
- Vacancy / Maint / Mgmt
- −$331
- Net cashflow
- $18
Break-even live
UW: 25.0% down · 7.5% · 30yr · 1.5% tax · 5.0% vac · 8.0% maint · 8.0% mgmt
Financing live
Cash to close
- Down payment
- $44,975
- Closing costs
- $5,397
- Reserves months
- —
- Total cash needed
- —
Loan-product check · same deal, 3 products live
Conventional
25% down · 7.5% · 30yr
- Down + closing
- —
- Monthly P&I
- —
- Monthly cashflow
- —
- DSCR
- —
- Eligible?
- —
Personal DTI + credit; lowest rate.
DSCR
20% down · 8.5% · 30yr
- Down + closing
- —
- Monthly P&I
- —
- Monthly cashflow
- —
- DSCR
- —
- Eligible?
- —
No personal income docs; deal must DSCR.
Hard money
10% down · 12.0% · 12mo
- Down + closing
- —
- Monthly P&I
- —
- Monthly cashflow
- —
- DSCR
- —
- Eligible?
- —
Short-term bridge; refi at stabilization.
Rent comps 3 comps
| Address | Beds | Baths | Sqft | Rent | $/sqft | DOM | Units | Dist |
|---|---|---|---|---|---|---|---|---|
| 1310 Eleanor St Burkburnett, TX | 4.0 | 2.0 | 1403 | $2,400 | $1.71 | 43d | 1 | 0.45mi |
| 1505 Sheppard Rd #40 Burkburnett, TX | 3.0 | 2.0 | 1120 | $1,195 | $1.07 | 43d | 1 | 0.53mi |
| 908 Sycamore Dr Burkburnett, TX | 2.0 | 2.0 | 1194 | $1,100 | $0.92 | 43d | 1 | 0.55mi |
Listing history 12 events
-
2026-06-19days on market $179,900 Active 14 DOM
-
2026-06-18days on market $179,900 Active 13 DOM
-
2026-06-17days on market $179,900 Active 12 DOM
-
2026-06-16days on market $179,900 Active 11 DOM
-
2026-06-15days on market $179,900 Active 10 DOM
-
2026-06-14days on market $179,900 Active 8 DOM
-
2026-06-13days on market $179,900 Active 7 DOM
-
2026-06-10days on market $179,900 Active 5 DOM
-
2026-06-09days on market $179,900 Active 4 DOM
-
2026-06-08days on market $179,900 Active 3 DOM
-
2026-06-07remarks 506-char remark
-
2026-06-07$179,900 Active 2 DOM
ⓘ Source: listings_history table (triggers on properties + properties_extension) + one-shot
backfill from property_details.listing_events for pre-trigger history.
Tax reassessment forecast TX · Resets to sale price
- Current annual tax
- $2,484 · $207/mo
- Projected year-2 tax
- $3,292 · $274/mo
- Expected delta
- +$808/yr (+$67/mo · 32.5%)
ⓘ Screening estimate from a state-policy table — verify with the county assessor before closing.
Climate risk First Street
- Flood 1/10 Low FEMA zone X (unshaded) · 0% chance over 30 yrs
- Wildfire 8/10 Severe
- Heat 7/10 Severe 7 d/yr ≥109°F today · 20 d/yr by 30 yrs out
- Wind 4/10 Moderate 9% chance of damaging wind over 30 yrs
- Air quality 1/10 Low 0 unhealthy d/yr today · 0 by 30 yrs out
Nearby sold comps map
Loading sold comps map…
Walkable amenities ~0.75 mi
Loading nearby amenities…
Taxation est. · year 1
- Rental income
- $18,892
- − Mortgage interest
- −$10,077
- − Property taxes
- −$2,484
- − Insurance
- −$900
- − Repairs & maintenance
- −$1,511
- − Management
- −$1,511
- − Depreciation
- −$5,233
- Taxable loss
- −$2,826
- Est. tax savings @ 24.0%
- +$678
- After-tax cash flow
- $898/yr
For passive investors: Depreciation is non-cash, so a rental often shows a tax loss while cash-flowing — sheltering income. Rental losses are passive: they offset passive income freely, and up to $25,000/yr can offset ordinary (W-2) income if you actively participate and your MAGI is under $100k (phasing out to $0 by $150k); unused losses carry forward. On sale, claimed depreciation is recaptured at up to 25%, and gains may owe capital-gains tax (a 1031 exchange can defer both). Figures are a year-1 estimate at your 24.0% rate — not tax advice; consult a CPA.
Schools (NCES district)
- District
- Burkburnett ISD
- NCES district ID
- 4812120
- Math proficiency
- 35% ▼ -6.00%
- Reading proficiency
- 32% ▼ -6.00%
- Median HH income
- $53,346
- Composite
- 29.44/100
- National rank
- #6519
- State rank
- #529 of 826 in TX
Livability — Burkburnett
- Score
- 70/100
- State rank
- #345
- US rank
- #7548
Category grades
Schools grade is shown separately in the Schools card above.
Census & demographics
- Census place
- Burkburnett, TX
- Population (ZIP)
- 11,822
Population outlook (Wichita County) Hauer SSP2
- Today (2025)
- 129,638 people
- By 2030
- 128,366 · -1.0%
- By 2040
- 124,466 · -4.0%
- By 2050
- 120,499 · -7.0%
- By 2075
- 113,884 · -12.2%
- By 2100
- 101,818 · -21.5%
Race, ethnicity, and origin ACS 2023
- Neighborhood character
- Predominantly White (79%)
- Race & ethnicity
- White 79% Hispanic / Latino 14% Two or more races 8% Black 1%
- Hispanic origin (detail)
- Mexican 11% Puerto Rican 1%
- Common ancestry
- Slovak 5% Iranian 4% Italian 3%
- Foreign-born
- 3% · Canada
- Languages at home
- 95% English-only · Spanish 5% Other Indo-European 1%
Political lean MEDSL · Wichita
- 2024 margin
- Solid R (+44.0) · D 27.5% · R 71.5%
- 2008→2024 swing
- -5.2pp toward R · 2008: -38.9pp · 2024: -44.0pp
- All cycles
- 2024: R+44.0 2020: R+41.1 2016: R+49.7 2012: R+47.1 2008: R+38.9
Not yet ingested
- Civics
- —
Market trends
- HPI YoY
- ▼ -87.48%
- Current HPI
- 166.3827
- Rent YoY
- —
- Metro
- —
- State GDP YoY
- ▲ 3.95%
- F500 in state
- 110
Industry mix (Fortune 500 HQ in TX)
| Industry | F500 HQs | Revenue |
|---|---|---|
| Energy | 16 | $1,198B |
|
||
| Technology | 5 | $198B |
|
||
| Engineering / Construction | 4 | $72B |
|
||
| Energy Services | 3 | $60B |
|
||
| Utilities | 3 | $41B |
|
||
| Healthcare | 2 | $330B |
|
||
Price history
+12.5% since first listed8 events — show timeline
- 2026-06-05 Listed $179,900 WFAOR
- 2023-06-30 Sold (Public Records) — Public Records
- 2023-06-30 Sold (MLS) — WFAOR
- 2023-06-12 Delisted — WFAOR
- 2023-05-22 Listed $159,900 WFAOR
- 2020-07-30 Sold (Public Records) — Public Records
- 2016-01-19 Sold (Public Records) — Public Records
- 2010-06-23 Sold (Public Records) — Public Records
Property tax history
+2.8%/yrLatest (2025): $2,484 · +4.9% YoY. Source: county tax records.
Cash-flow waterfall
monthlySold comps — $/sqft
last 12 mo · ≤1 miLoading sold comps…