 6-Plex
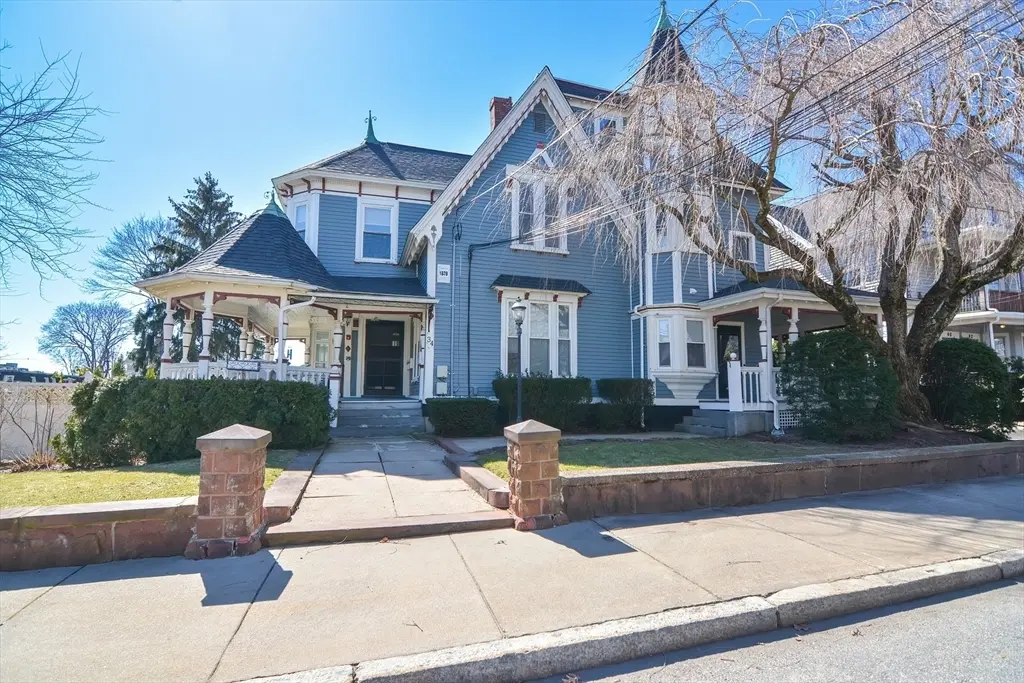
34 High St · North Attleborough Town, MA
Flood risk 1/10 · Minimal
- FEMA flood zone
- X (unshaded)
- Chance of flooding over 30 yrs
- 0.0%
- Est. flood insurance / yr
- $473 – $860
Fire risk 1/10 · Minimal
- Est. fire insurance / yr
- $915 – $1,699
Heat risk 5/10 · Moderate
- Hot days now (above 96°F)
- 7 days/yr
- Hot days in 30 yrs
- 16 days/yr
Wind risk 6/10 · Moderate
- Chance of severe wind over 30 yrs
- 64.0%
Air-quality risk 2/10 · Minimal
- Unhealthy air days now
- 1 days/yr
- Unhealthy air days in 30 yrs
- 2 days/yr
Risk factors via First Street. Map © Google.
Why this score? — see what drove the B+ grade
The composite is a weighted blend of 9 inputs, each scored 0–100. Each bar is that input's sub-score; the figure is the points it added to the 100-point composite (weight × sub-score).
- Cash flow +30.0/30.0
- ARV discount +13.7/15.0
- 1% rule +10.0/10.0
- DSCR +10.0/10.0
- Schools +4.8/10.0
- Rent growth +3.2/5.0
- Livability +2.5/5.0
- Condition / age +2.5/5.0
- Appreciation +0.0/10.0
$999,900
🖨 Deal sheet (PDF) 📄 Offer letter ✓ Due diligence
Multi-family units
County records classify this as Multi-Family (5+ Unit). Listing-text estimate: 6 units. confirmed
5+ unit building — per-unit beds/baths from public records are typically unavailable; the breakdown below (if shown) is an estimate from the listing text.
Listing remarks MLS
EXCELLENT LOT IN PHASE III OF HIGHLAND MEADOWS. UNIQUE COLONIAL W/FARMERS PORCH + 2 CAR GAR. OFFERS HARDWOOD IN DINING RM. W/TRAY CEILING-OPEN 2 STORY FOYER - VERY SPACIOUS FLOOR PLAN.POSSIBLE RM OVER GARAGE AND 3RD FL WALK-UP.
Key facts
- New siding
- Newer roof
- New alarm system
Tags
Property features AI
Finance
- Other: Property total building area approximately 5,351 (above grade finished area listed as 5,351); Gentle sloping 0.28-acre lot
- HOA & community: Community amenities nearby include public transportation, shopping, pool, tennis courts, parks, walk/jog trails, golf, medical facilities, laundromat, bike path, conservation area, highway access, house of worship, nearby schools, T-station and sidewalks
Exterior
- Parking: On-site garage (1 covered/garage space); Additional covered parking (1); Open parking for about 8 vehicles; Total of 9 parking spaces; Paved driveway and off-street parking
- Utilities: Public water; Public sewer; Electricity individually metered (varies per unit); Gas and/or electric range hookups (varies per unit)
- Home design: 5-9 family property; Five total stories; Certified historic and renovated since original construction
- Construction: Frame, brick and stone construction; Stone and brick/mortar foundation; Shingle roof; Built historically (year per public records); renovated since
- Exterior features: Porch; Covered wood deck; Professional landscaping; Garden; Stone wall; Shed(s); Gentle sloping lot; Paved road frontage on a public, publicly maintained road
Interior
- Kitchen: Range; Refrigerator; Country-style kitchen
- Bedrooms: Multiple bedrooms across units (see unit-level details)
- Flooring: Hardwood; Parquet; Tile; Vinyl; Carpet; Varied flooring by area/unit
- Bathrooms: 6 full bathrooms
- Heating & cooling: Baseboard heating (natural gas) with unit control; Window cooling units; Thermostats (varies per unit)
- Interior features: Open floor plan; Remodeled; Crown molding; Ceiling fan(s); Storage; Upgraded cabinets; Upgraded countertops; Walk-in closet(s); Bathroom with shower stall; Bathroom with tub; Country kitchen; Living room; Dining room; Kitchen; Laundry room; 21 total rooms; Insulated doors; Picture, bay/box/bow, stained glass, insulated and storm windows
- Laundry & utility: Laundry room; Unit-dependent utility setups
Neighborhood map
What this means for you Summary
Snapshot
- This is a 6 × 8-bed/6.0-bath units multifamily listed at $1000k.
Deal economics
- At list price, monthly cash flow is $9k ($105k/yr) — positive. Per door: $1k/mo.
- The deal already cash-flows at list — no discount required.
- Meets the 1% rule at list price ($19k rent vs $1000k).
- Recommended offer: $985k (1.5% below list) — sets the bar for market timing.
- Cap rate 16.8% vs local median 2.9% in North Attleborough Town — top-decile yield for the area; either an underpriced asset or a hidden risk that comps aren't pricing in. Stress-test before assuming the spread holds.
Location & tenants
- Location reads: area grade B — affects rentability + tenant quality, not the cash-flow math above.
- North Attleborough (suburban): math 46% / reading 60% proficiency, ranked #98 of 302 in MA (top 32%) — acceptable for families but not a draw, mixed tenant base, ~2y average lease; only 15% free/reduced lunch — higher-income household profile.
- Zoned schools: North Attleborough Middle (math 41% / reading 60%, grade C, #80 of 305 statewide, top 26%, 956 students, 0% FRL); North Attleboro High (math 64% / reading 72%, grade B, #93 of 343 statewide, top 28%, 1,107 students, 0% FRL) — zoned schools average 0% FRL vs 15% district-wide (15 pts lower); this property's tenant base skews higher-income than the district average.
- Market conditions: Rents rising (+2.9%/yr); 42 active listings in the ZIP; high-income renter base; 760 units permitted in Bristol County in 2024 (142 in 5+ unit buildings).
Forward outlook
- Local home prices are declining (-3.0%/yr); year-one equity from $7k of loan paydown is wiped out by about $30k of value loss. Plan a longer hold.
- Bristol County population projected to shrink 3% by 2050 — rents likely to lag national; underwrite the cash flow, not the appreciation.
- At projected returns (-3.0% appreciation + 2.9% rent growth), your $280k cash investment doubles in ~4 years — after that, you're playing with house money.
Negotiation context
- It's been on market 25 days — a 2% lower offer ($985k) is reasonable based on typical stale-listing flexibility.
- 2 sale attempts since 27y ago with the ask held roughly flat each time — persistent listings suggest the price (not the market) is what's stuck; bring a comps-based counter.
- Current owner paid $310k; list at $1000k implies a 223% gain — meaningful room to come down on a strong offer.
Risks & watch-outs
- Watch-outs: built in 1878 — expect roof / HVAC / electrical / plumbing capex.
- Climate carrying-cost: major wind risk, 64% chance of damaging wind over 30y; extreme-heat days projected 7→16/yr by 2055 (HVAC capex compounding) — expect insurance premiums to compound above CPI over the hold.
Questions for the listing agent
- Can we see the unit-by-unit rent roll, current vacancy, and any below-market leases? What's the average tenancy length?
- What capital expenditures (roof, boiler, parking lot, exteriors) have been made in the last 5 years, and what's planned in the next 2?
- Built in 1878 — when were the roof, HVAC, electrical panel, plumbing, and water heater last replaced?
- Is there a deadline driving the sale (1031 exchange, divorce, estate, relocation)? That informs how much negotiation room exists.
- What's the average days-on-market for RENTAL listings here right now (not sales)? A rising rental-DOM trend means longer vacancies and softer asking-rent achievability than the comps imply.
- What's the recent tenant-quality profile in this submarket — average credit score on applications, eviction rate, late-payment / NSF rate, and stable-employment percentage? A property-management company in the area should have these aggregated.
- How much new apartment / multifamily construction is in the pipeline within 1–3 miles? Heavy new supply (>2% of stock underway) typically softens rents 12–24 months out; light construction supports rent growth.
Investment metrics
- 1% rule
- 1.94% ✓
- Cap rate
- 16.84%
- Cash-on-cash
- 37.67%
- DSCR
- 2.68
- GRM
- 4.3
CMA / ARV
- ARV (on-the-fly)
- $1,161,167
- Comps found
- 1
Show comp detail 1 sale within ~0.75 mi
| Address | Dist | Beds/Ba | Sqft | Sold | Price | $/sf | Match |
|---|---|---|---|---|---|---|---|
| 194 Smith St | 0.50mi | 8/4.0 (+1) | 4,662 (-13%) | 5mo | $1,010,000 | $217 | 38 |
Match score weights: distance 35% · size 25% · config 20% · recency 20%. Top-matched comps best support the ARV.
Projected returns pro-forma
-3.0% appreciation · 2.88% rent growth · sell at horizon
- IRR
- 33.5%
- Equity multiple
- 2.41×
- Total profit
- $395,490
- Equity at exit
- $149,088
- IRR
- 40.4%
- Equity multiple
- 4.77×
- Total profit
- $1,055,845
- Equity at exit
- $86,453
Cash invested: $279,972 (down + closing). Projections, not guarantees.
Landlord ↔ Tenant lean methodology
- Overall (STATE)
- 20 Strongly Tenant-Friendly
- State Massachusetts
- 20 Strongly Tenant-Friendly · D+15
- County
- — inherits STATE
- City
- — inherits STATE
ZIP-level market 02760
- Rents YoY
- 2.9%
- Active inventory
- 42
- Price-to-rent
- 25.8×
Monthly cashflow live
- Estimated rent
- $19,358 medium interval (Pro) →
- Mortgage (P&I)
- −$5,244
- Tax from tax record
- −$843 /mo · $10,117/yr
- Insurance
- −$417
- HOA
- −$0
- Vacancy / Maint / Mgmt
- −$4,065
- Net cashflow
- $8,790
Break-even live
Sensitivity live
| Price | -10% $9,356 | -5% $9,073 | +0% $8,790 | +5% $8,507 | +10% $8,224 |
|---|---|---|---|---|---|
| Rent | -10% $7,260 | -5% $8,025 | +0% $8,790 | +5% $9,554 | +10% $10,319 |
| Rate | -1.0pp $9,293 | -0.5pp $9,044 | base $8,790 | +0.5pp $8,530 | +1.0pp $8,267 |
6-unit breakdown (identical units grouped — click to expand)
| Units | Beds | Baths | Est. rent |
|---|---|---|---|
| 6× units | 8 | 6 | $19,356 |
| #1 | 8 | 6 | $3,226 |
| #2 | 8 | 6 | $3,226 |
| #3 | 8 | 6 | $3,226 |
| #4 | 8 | 6 | $3,226 |
| #5 | 8 | 6 | $3,226 |
| #6 | 8 | 6 | $3,226 |
| Total (6 units) | $19,358 | ||
UW: 25.0% down · 7.5% · 30yr · 1.5% tax · 5.0% vac · 8.0% maint · 8.0% mgmt
Financing live
Cash to close
- Down payment
- $249,975
- Closing costs
- $29,997
- Reserves months
- —
- Total cash needed
- —
Loan-product check · same deal, 3 products live
Conventional
25% down · 7.5% · 30yr
- Down + closing
- —
- Monthly P&I
- —
- Monthly cashflow
- —
- DSCR
- —
- Eligible?
- —
Personal DTI + credit; lowest rate.
DSCR
20% down · 8.5% · 30yr
- Down + closing
- —
- Monthly P&I
- —
- Monthly cashflow
- —
- DSCR
- —
- Eligible?
- —
No personal income docs; deal must DSCR.
Hard money
10% down · 12.0% · 12mo
- Down + closing
- —
- Monthly P&I
- —
- Monthly cashflow
- —
- DSCR
- —
- Eligible?
- —
Short-term bridge; refi at stabilization.
Listing history 20 events
-
2026-06-21days on market $999,900 Active 25 DOM
-
2026-06-18days on market $999,900 Active 22 DOM
-
2026-06-17days on market $999,900 Active 21 DOM
-
2026-06-16days on market $999,900 Active 20 DOM
-
2026-06-15days on market $999,900 Active 19 DOM
-
2026-06-13days on market $999,900 Active 17 DOM
-
2026-06-13days on market $999,900 Active 16 DOM
-
2026-06-09days on market $999,900 Active 13 DOM
-
2026-06-08days on market $999,900 Active 12 DOM
-
2026-06-07days on market $999,900 Active 11 DOM
-
2026-06-03days on market $999,900 Active 7 DOM
-
2026-06-02days on market $999,900 Active 6 DOM
-
2026-06-01days on market $999,900 Active 5 DOM
-
2026-05-31statusdays on market $999,900 Active 4 DOM
-
2026-05-27$999,900 New
-
2000-05-22soldstatus $309,900 227-char remark
Show marketing remark (227 chars)
EXCELLENT LOT IN PHASE III OF HIGHLAND MEADOWS. UNIQUE COLONIAL W/FARMERS PORCH + 2 CAR GAR. OFFERS HARDWOOD IN DINING RM. W/TRAY CEILING-OPEN 2 STORY FOYER - VERY SPACIOUS FLOOR PLAN.POSSIBLE RM OVER GARAGE AND 3RD FL WALK-UP.
-
2000-02-14historical 227-char remark
Show marketing remark (227 chars)
EXCELLENT LOT IN PHASE III OF HIGHLAND MEADOWS. UNIQUE COLONIAL W/FARMERS PORCH + 2 CAR GAR. OFFERS HARDWOOD IN DINING RM. W/TRAY CEILING-OPEN 2 STORY FOYER - VERY SPACIOUS FLOOR PLAN.POSSIBLE RM OVER GARAGE AND 3RD FL WALK-UP.
-
1999-08-12$269,000 227-char remark
Show marketing remark (227 chars)
EXCELLENT LOT IN PHASE III OF HIGHLAND MEADOWS. UNIQUE COLONIAL W/FARMERS PORCH + 2 CAR GAR. OFFERS HARDWOOD IN DINING RM. W/TRAY CEILING-OPEN 2 STORY FOYER - VERY SPACIOUS FLOOR PLAN.POSSIBLE RM OVER GARAGE AND 3RD FL WALK-UP.
-
1987-11-10soldstatus $3,163,580
-
1987-11-01soldstatus $288,580
ⓘ Source: listings_history table (triggers on properties + properties_extension) + one-shot
backfill from property_details.listing_events for pre-trigger history.
Tax reassessment forecast MA · Partial reset (capped growth)
- Current annual tax
- $10,117 · $843/mo
- Projected year-2 tax
- $11,208 · $934/mo
- Expected delta
- +$1,091/yr (+$91/mo · 10.8%)
ⓘ Screening estimate from a state-policy table — verify with the county assessor before closing.
Climate risk First Street
- Flood 1/10 Low FEMA zone X (unshaded) · 0% chance over 30 yrs
- Wildfire 1/10 Low
- Heat 5/10 Major 7 d/yr ≥96°F today · 16 d/yr by 30 yrs out
- Wind 6/10 Major 64% chance of damaging wind over 30 yrs
- Air quality 2/10 Low 1 unhealthy d/yr today · 2 by 30 yrs out
Nearby sold comps map
Loading sold comps map…
Walkable amenities ~0.75 mi
Loading nearby amenities…
Taxation est. · year 1
- Rental income
- $232,296
- − Mortgage interest
- −$56,010
- − Property taxes
- −$10,117
- − Insurance
- −$5,000
- − Repairs & maintenance
- −$18,584
- − Management
- −$18,584
- − Depreciation
- −$29,088
- Taxable income
- $94,914
- Est. tax owed @ 24.0%
- −$22,779
- After-tax cash flow
- $82,695/yr
For passive investors: Depreciation is non-cash, so a rental often shows a tax loss while cash-flowing — sheltering income. Rental losses are passive: they offset passive income freely, and up to $25,000/yr can offset ordinary (W-2) income if you actively participate and your MAGI is under $100k (phasing out to $0 by $150k); unused losses carry forward. On sale, claimed depreciation is recaptured at up to 25%, and gains may owe capital-gains tax (a 1031 exchange can defer both). Figures are a year-1 estimate at your 24.0% rate — not tax advice; consult a CPA.
Schools (NCES district)
- District
- North Attleborough
- NCES district ID
- 2508730
- Math proficiency
- 46% ▼ -12.00%
- Reading proficiency
- 60% ▼ -1.00%
- Median HH income
- $80,560
- Composite
- 48.14/100
- National rank
- #2180
- State rank
- #98 of 302 in MA
Livability — North Attleborough Town
No livability data for this city. (Only ~50 U.S. cities are tracked.)
Census & demographics
- Census place
- North Attleborough Town, MA
- County
- Bristol County · 342,083 people
- City population
- 30,842
- Metro
- Providence-Warwick, RI-MA
- Population (ZIP)
- 29,177
- Household income
- $112,027
- Rent vs Own
- Severe rent burden
- 681.0
Population outlook (Bristol County) Hauer SSP2
- Today (2025)
- 570,212 people
- By 2030
- 571,181 · +0.2%
- By 2040
- 565,389 · -0.8%
- By 2050
- 552,141 · -3.2%
- By 2075
- 520,923 · -8.6%
- By 2100
- 474,363 · -16.8%
Race, ethnicity, and origin ACS 2023
- Neighborhood character
- Predominantly White (84%)
- Race & ethnicity
- White 84% Asian 6% Two or more races 5% Hispanic / Latino 4% Black 2%
- Common ancestry
- Lithuanian 9% Romanian 6% Russian 5%
- Foreign-born
- 9% · Canada, China
- Languages at home
- 89% English-only · Other Indo-European 4% Spanish 3% Other Asian/Pacific 2%
Political lean MEDSL · Bristol
- 2024 margin
- Toss-up / Even · D 49.8% · R 48.5% · Other 1.8%
- 2008→2024 swing
- -21.9pp toward R · 2008: 23.2pp · 2024: 1.3pp
- All cycles
- 2024: D+1.3 2020: D+12.0 2016: D+9.3 2012: D+20.5 2008: D+23.2
Not yet ingested
- Civics
- —
Market trends
- HPI YoY
- ▼ -575.93%
- Current HPI
- 302.0435
- Rent YoY
- ▲ 2.88%
- Metro
- Providence-Warwick, RI-MA
- State GDP YoY
- ▲ 2.28%
- F500 in state
- 38
Industry mix (Fortune 500 HQ in MA)
| Industry | F500 HQs | Revenue |
|---|---|---|
| Technology | 3 | $17B |
|
||
| Insurance | 2 | $84B |
|
||
| Retail | 2 | $76B |
|
||
| Life Sciences | 1 | $43B |
|
||
| Energy Technology | 1 | $31B |
|
||
| Aerospace / Defense | 1 | $18B |
|
||
Price history
+246.5% since first listed6 events — show timeline
- 2026-05-27 Listed $999,900 MLS PIN
- 2000-05-22 Sold (MLS) $309,900 MLS PIN
- 2000-02-14 Listing Removed — MLS PIN
- 1999-08-12 Listed $269,000 MLS PIN
- 1987-11-10 Sold (Public Records) $3,163,580 Public Records
- 1987-11-01 Sold (Public Records) $288,580 Public Records
Property tax history
+5.3%/yrLatest (2023): $10,117 · +18.7% YoY. Source: county tax records.
Cash-flow waterfall
monthlySold comps — $/sqft
last 12 mo · ≤1 miLoading sold comps…