203 Scooter Hill Rd · Mantachie, MS
Flood risk No data
- FEMA flood zone
- —
- Chance of flooding over 30 yrs
- —
- Est. flood insurance / yr
- —
Fire risk No data
- Est. fire insurance / yr
- —
Heat risk No data
- Hot days now (above threshold)
- —
- Hot days in 30 yrs
- —
Wind risk No data
- Chance of severe wind over 30 yrs
- —
Air-quality risk No data
- Unhealthy air days now
- —
- Unhealthy air days in 30 yrs
- —
Risk factors via First Street. Map © Google.
Why this score? — see what drove the D- grade
The composite is a weighted blend of 9 inputs, each scored 0–100. Each bar is that input's sub-score; the figure is the points it added to the 100-point composite (weight × sub-score).
- Appreciation +9.7/10.0
- ARV discount +7.5/15.0
- Cash flow +7.2/30.0
- Livability +3.2/5.0
- Schools +2.7/10.0
- Rent growth +2.5/5.0
- Condition / age +2.5/5.0
- 1% rule +2.0/10.0
- DSCR +1.4/10.0
$189,000
🖨 Deal sheet (PDF) 📄 Offer letter ✓ Due diligence
Listing remarks MLS
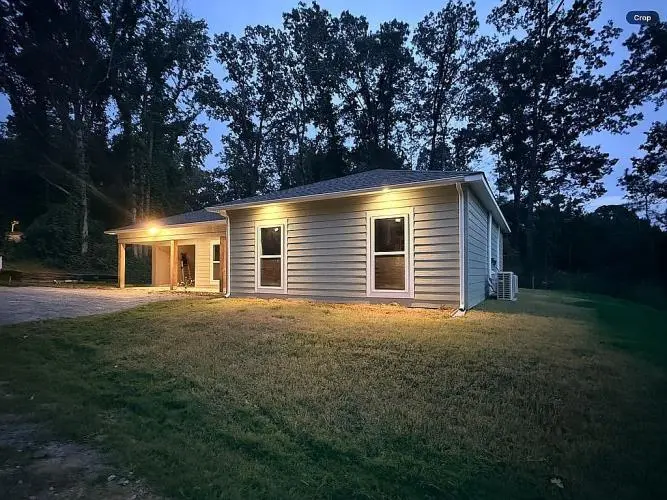
Brand new construction on a spacious ½-acre lot in Mantachie! This beautifully built 3-bedroom, 2-bath home offers approximately 1,200 square feet of efficient, modern living space with quality finishes throughout. Inside, you’ll find a well-designed layout that maximizes space and natural light. The home features custom tile showers, stylish bathrooms, and a clean, modern finish that gives it a high-end feel without the high-end price. The open living area flows comfortably into the kitchen and dining space, making it ideal for everyday living or entertaining. The generous 0.5-acre lot provides room to enjoy outdoor living, add a shop, or create your own backyard retreat — all while being conveniently located in Mantachie. If you’re looking for low-maintenance, move-in-ready construction with custom touches and room to grow, this property is a must-see.
Key facts
- New construction
- Custom tile showers
- Spacious lot
Tags
Neighborhood map
What this means for you Summary
Snapshot
- This is a 3-bed/2.0-bath single-family listed at $189k.
Deal economics
- At list price, monthly cash flow is $-261 ($-3k/yr) — negative.
- To cash-flow at today's rent, offer at most $151k (20.0% below list).
- To meet the 1% rule (rent ≥ 1% of price), the offer needs to be $132k (30.0% below list).
- Recommended offer: $132k (30.0% below list) — sets the bar for 1% rule.
Location & tenants
- Location reads 65/100 on livability (#111 in MS) — a middle-class / working-renter tenant base. Strengths: crime A+, cost of living A+, housing A+; Watch: employment D+, amenities F, commute F.
- Itawamba County School District (rural): math 35% / reading 31% proficiency, ranked #58 of 130 in MS (top 45%) — families likely to look elsewhere, expect single-tenant / working-renter base with shorter leases.
- Zoned schools: Itawamba Attendance Center (math 37% / reading 34%, grade F, #150 of 375 statewide, top 40%, 1,163 students, 100% FRL); Itawamba Agricultural High School (math 32% / reading 32%, grade F, #80 of 197 statewide, top 42%, 556 students, 100% FRL) — zoned schools average 100% FRL vs 54% district-wide (45 pts higher); higher-poverty schools than district average — tighter screening recommended.
- Market conditions: 15 active listings in the ZIP; 4 units permitted in Itawamba County in 2024 (0 in 5+ unit buildings).
Forward outlook
- In year one you build about $19k of equity ($1k loan paydown + $18k appreciation (9.4% local appreciation)).
- Itawamba County population projected to shrink 4% by 2050 — rents likely to lag national; underwrite the cash flow, not the appreciation.
- By year 2, paydown + projected appreciation supports a ~$31k cash-out refi (75% LTV) — recoverable capital for the next deal without selling this one.
Negotiation context
- It's been on market 97 days — a 9% lower offer ($172k) is reasonable based on typical stale-listing flexibility.
- 2 sale attempts with the ask held roughly flat each time — persistent listings suggest the price (not the market) is what's stuck; bring a comps-based counter.
Questions for the listing agent
- What do current leases actually rent for vs. the listed asking? Can we see a recent rent roll and the last 12 months of T-12 income?
- It's been on market 97 days. Have you received any prior offers? Is the seller open to a 30% concession, seller financing, or rate buy-down credit?
- Why hasn't it sold? Are there any deal-killer items the seller is aware of (foundation, flood, title, zoning, code violations)?
- Is there a deadline driving the sale (1031 exchange, divorce, estate, relocation)? That informs how much negotiation room exists.
- Schools are D-rated, which usually means shorter tenancies and higher turnover. Who's the typical renter profile here, and what's been the actual vacancy rate?
- The area grade is low — what's the realistic commute time and amenity access for the typical tenant pool here? Any planned neighborhood developments (good or bad) we should know about?
- What's the average days-on-market for RENTAL listings here right now (not sales)? A rising rental-DOM trend means longer vacancies and softer asking-rent achievability than the comps imply.
- What's the recent tenant-quality profile in this submarket — average credit score on applications, eviction rate, late-payment / NSF rate, and stable-employment percentage? A property-management company in the area should have these aggregated.
- How much new for-sale + rental construction is in the pipeline within 1–3 miles? Heavy new supply typically softens prices + rents 12–24 months out; constrained supply supports both.
Investment metrics
- 1% rule
- 0.70% ✗
- Cap rate
- 4.64%
- Cash-on-cash
- -5.92%
- DSCR
- 0.74
- GRM
- 11.9
CMA / ARV
No comps found within radius.
Projected returns pro-forma
9.37% appreciation · 3.0% rent growth · sell at horizon
- IRR
- 18.7%
- Equity multiple
- 2.48×
- Total profit
- $78,179
- Equity at exit
- $161,599
- IRR
- 17.4%
- Equity multiple
- 5.56×
- Total profit
- $241,464
- Equity at exit
- $339,665
Cash invested: $52,920 (down + closing). Projections, not guarantees.
Landlord ↔ Tenant lean methodology
- Overall (STATE)
- 90 Strongly Landlord-Friendly
- State Mississippi
- 90 Strongly Landlord-Friendly · R+11
- County
- — inherits STATE
- City
- — inherits STATE
ZIP-level market 38855
- Home prices YoY
- 7.4%
- Active inventory
- 15
- Price-to-rent
- 11.9×
Monthly cashflow live
- Estimated rent
- $1,323 medium interval (Pro) →
- Mortgage (P&I)
- −$991
- Tax est. 1.5%
- −$236 /mo · $2,835/yr
- Insurance
- −$79
- HOA
- −$0
- Lot rent
- −$0
- Vacancy / Maint / Mgmt
- −$278
- Net cashflow
- $-261
Break-even live
Sensitivity live
| Price | -10% $-130 | -5% $-196 | +0% $-261 | +5% $-326 | +10% $-392 |
|---|---|---|---|---|---|
| Rent | -10% $-366 | -5% $-313 | +0% $-261 | +5% $-209 | +10% $-157 |
| Rate | -1.0pp $-166 | -0.5pp $-213 | base $-261 | +0.5pp $-310 | +1.0pp $-360 |
UW: 25.0% down · 7.5% · 30yr · 1.5% tax · 5.0% vac · 8.0% maint · 8.0% mgmt
Financing live
Cash to close
- Down payment
- $47,250
- Closing costs
- $5,670
- Reserves months
- —
- Total cash needed
- —
Loan-product check · same deal, 3 products live
Conventional
25% down · 7.5% · 30yr
- Down + closing
- —
- Monthly P&I
- —
- Monthly cashflow
- —
- DSCR
- —
- Eligible?
- —
Personal DTI + credit; lowest rate.
DSCR
20% down · 8.5% · 30yr
- Down + closing
- —
- Monthly P&I
- —
- Monthly cashflow
- —
- DSCR
- —
- Eligible?
- —
No personal income docs; deal must DSCR.
Hard money
10% down · 12.0% · 12mo
- Down + closing
- —
- Monthly P&I
- —
- Monthly cashflow
- —
- DSCR
- —
- Eligible?
- —
Short-term bridge; refi at stabilization.
Listing history 18 events
-
2026-06-22days on market $189,000 Active 97 DOM
-
2026-06-19days on market $189,000 Active 94 DOM
-
2026-06-18days on market $189,000 Active 93 DOM
-
2026-06-17days on market $189,000 Active 92 DOM
-
2026-06-16days on market $189,000 Active 91 DOM
-
2026-06-15days on market $189,000 Active 90 DOM
-
2026-06-14days on market $189,000 Active 88 DOM
-
2026-06-12days on market $189,000 Active 87 DOM
-
2026-06-09days on market $189,000 Active 84 DOM
-
2026-06-08days on market $189,000 Active 83 DOM
-
2026-06-07days on market $189,000 Active 82 DOM
-
2026-06-05days on market $189,000 Active 79 DOM
-
2026-06-02days on market $189,000 Active 77 DOM
-
2026-06-01days on market $189,000 Active 76 DOM
-
2026-05-31days on market $189,000 Active 75 DOM
-
2026-05-30days on market $189,000 Active 74 DOM
-
2026-03-13$189,000 Active 891-char remark
Show marketing remark (891 chars)
Brand new construction on a spacious ½-acre lot in Mantachie! This beautifully built 3-bedroom, 2-bath home offers approximately 1,200 square feet of efficient, modern living space with quality finishes throughout. Inside, you’ll find a well-designed layout that maximizes space and natural light. The home features custom tile showers, stylish bathrooms, and a clean, modern finish that gives it a high-end feel without the high-end price. The open living area flows comfortably into the kitchen and dining space, making it ideal for everyday living or entertaining. The generous 0.5-acre lot provides room to enjoy outdoor living, add a shop, or create your own backyard retreat — all while being conveniently located in Mantachie. If you’re looking for low-maintenance, move-in-ready construction with custom touches and room to grow, this property is a must-see.
-
2026-03-05$193,000 Active 867-char remark
Show marketing remark (867 chars)
Brand new construction on a spacious 0.5 acre lot in Mantachie! This beautifully built 3-bedroom, 2-bath home offers approximately 1,200 square feet of efficient, modern living space with quality finishes throughout. Inside, you'll find a well-designed layout that maximizes space and natural light. The home features custom tile showers, stylish bathrooms, and a clean, modern finish that gives it a high-end feel without the high-end price. The open living area flows comfortably into the kitchen and dining space, making it ideal for everyday living or entertaining. The generous 0.5-acre lot provides room to enjoy outdoor living, add a shop, or create your own backyard retreat all while being conveniently located in Mantachie. If you're looking for low-maintenance, move-in-ready construction with custom touches and room to grow, this property is a must-see.
ⓘ Source: listings_history table (triggers on properties + properties_extension) + one-shot
backfill from property_details.listing_events for pre-trigger history.
Nearby sold comps map
Loading sold comps map…
Walkable amenities ~0.75 mi
Loading nearby amenities…
Taxation est. · year 1
- Rental income
- $15,874
- − Mortgage interest
- −$10,587
- − Property taxes
- −$2,835
- − Insurance
- −$945
- − Repairs & maintenance
- −$1,270
- − Management
- −$1,270
- − Depreciation
- −$5,498
- Taxable loss
- −$6,531
- Est. tax savings @ 24.0%
- +$1,567
- After-tax cash flow
- $-1,566/yr
For passive investors: Depreciation is non-cash, so a rental often shows a tax loss while cash-flowing — sheltering income. Rental losses are passive: they offset passive income freely, and up to $25,000/yr can offset ordinary (W-2) income if you actively participate and your MAGI is under $100k (phasing out to $0 by $150k); unused losses carry forward. On sale, claimed depreciation is recaptured at up to 25%, and gains may owe capital-gains tax (a 1031 exchange can defer both). Figures are a year-1 estimate at your 24.0% rate — not tax advice; consult a CPA.
Schools (NCES district)
- District
- Itawamba County School District
- NCES district ID
- 2802100
- Math proficiency
- 35% ▼ -19.00%
- Reading proficiency
- 31% ▼ -14.00%
- Median HH income
- $37,158
- Composite
- 27.48/100
- National rank
- #6956
- State rank
- #58 of 130 in MS
Livability — Mantachie
- Score
- 65/100
- State rank
- #111
- US rank
- #12712
Category grades
Schools grade is shown separately in the Schools card above.
Census & demographics
- Census place
- Mantachie, MS
- City population
- 5,298
- Population (ZIP)
- 5,298
Population outlook (Itawamba County) Hauer SSP2
- Today (2025)
- 24,011 people
- By 2030
- 23,999 · +-0.0%
- By 2040
- 23,738 · -1.1%
- By 2050
- 22,962 · -4.4%
- By 2075
- 20,240 · -15.7%
- By 2100
- 16,503 · -31.3%
Race, ethnicity, and origin ACS 2023
- Neighborhood character
- Predominantly White (92%)
- Race & ethnicity
- White 92% Hispanic / Latino 4% Black 2% Two or more races 1%
- Common ancestry
- Slovak 2% Serbian 2% Lithuanian 2%
- Foreign-born
- 0%
Political lean MEDSL · Itawamba
- 2024 margin
- Solid R (+80.0) · D 9.7% · R 89.7%
- 2008→2024 swing
- -23.9pp toward R · 2008: -56.1pp · 2024: -80.0pp
- All cycles
- 2024: R+80.0 2020: R+75.6 2016: R+75.6 2012: R+61.0 2008: R+56.1
Not yet ingested
- Civics
- —
Market trends
- HPI YoY
- ▲ 9.37%
- Current HPI
- 136.711
- Rent YoY
- —
- Metro
- —
- State GDP YoY
- —
- F500 in state
- 0
Price history
-2.1% since first listed2 events — show timeline
- 2026-03-13 Listed $189,000 Fizber.com
- 2026-03-05 Listed $193,000 ForSaleByOwner.com
Cash-flow waterfall
monthlySold comps — $/sqft
last 12 mo · ≤1 miLoading sold comps…