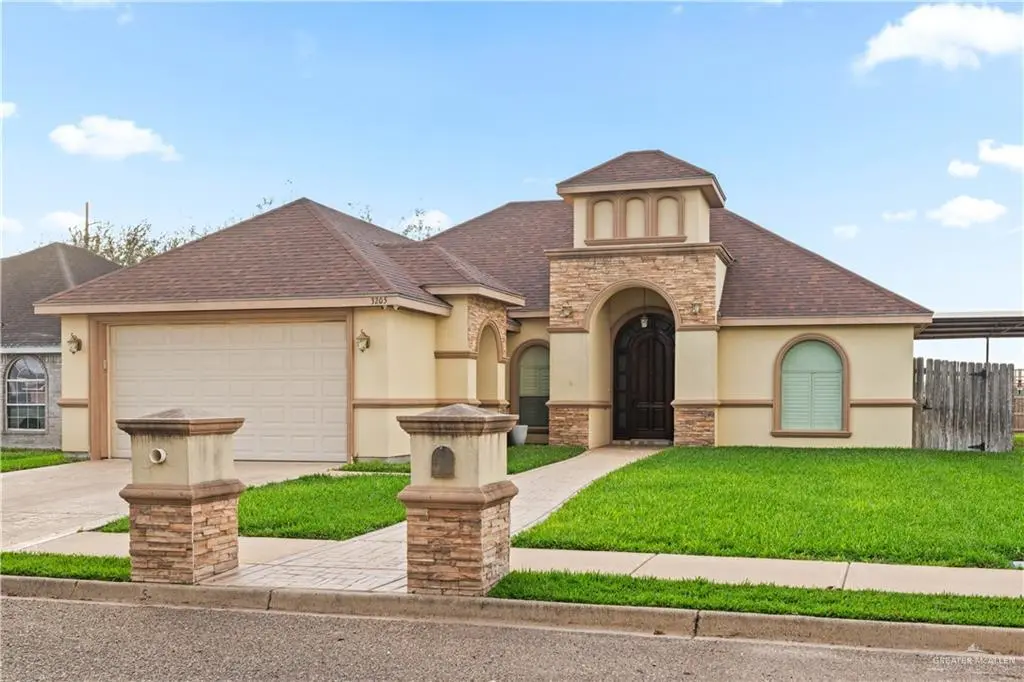
3205 Washington Ave · Mission, TX
Flood risk 1/10 · Minimal
- FEMA flood zone
- X
- Chance of flooding over 30 yrs
- 0.0%
- Est. flood insurance / yr
- $507 – $1,088
Fire risk 3/10 · Minor
- Est. fire insurance / yr
- $1,222 – $2,270
Heat risk 9/10 · Severe
- Hot days now (above 111°F)
- 7 days/yr
- Hot days in 30 yrs
- 22 days/yr
Wind risk 8/10 · Major
- Chance of severe wind over 30 yrs
- 94.0%
Air-quality risk 2/10 · Minimal
- Unhealthy air days now
- 1 days/yr
- Unhealthy air days in 30 yrs
- 2 days/yr
Risk factors via First Street. Map © Google.
Why this score? — see what drove the D- grade
The composite is a weighted blend of 9 inputs, each scored 0–100. Each bar is that input's sub-score; the figure is the points it added to the 100-point composite (weight × sub-score).
- ARV discount +11.3/15.0
- Appreciation +10.0/10.0
- Cash flow +3.8/30.0
- Livability +3.8/5.0
- Rent growth +3.1/5.0
- Condition / age +2.5/5.0
- Schools +1.7/10.0
- 1% rule +1.0/10.0
- DSCR +0.0/10.0
$270,000
🖨 Deal sheet 📄 Offer letter ✓ Due diligence
Listing remarks MLS
The residence features 3 Bedrooms and 2 Bathrooms. Single Family Residence built in 2012; this home offers 1828 sq.ft. of interior living space on a 7692 square foot lot. It is situated in Hidalgo County and falls within the Mission Consolidated Independent School District. The home features tile flooring throughout. The exterior finish is predominantly stucco. Sprinkler system to the front area. The house has a storage bulding in the back patio of 160sq.ft.
Key facts
- 7,693 sq ft lot
- 2 garage spots
- Built 2012
Neighborhood map
What this means for you Summary
Snapshot
- This is a 3-bed/2.0-bath single-family listed at $270k.
Deal economics
- At list price, monthly cash flow is $-781 ($-9k/yr) — negative.
- To cash-flow at today's rent, offer at most $132k (51.1% below list).
- To meet the 1% rule (rent ≥ 1% of price), the offer needs to be $161k (40.5% below list).
- Recommended offer: $132k (51.1% below list) — sets the bar for cash-flow.
Location & tenants
- Location reads 75/100 on livability (#148 in TX, #4,155 nationally) — a middle-class / working-renter tenant base. Strengths: cost of living A+, housing A+, health & safety A+; Watch: schools C-, amenities F, commute F.
- Mission CISD (urban): math 15% / reading 28% proficiency, ranked #775 of 826 in TX (top 94%) — low school quality limits family demand, transient renter base, plan for 1-2y turnover; 78% free/reduced lunch — lower-income household profile, screen leases tightly.
- Market conditions: Rents rising (+2.5%/yr); 623 active listings in the ZIP; 6 comparable units currently listed for rent nearby; rentals lingering (median 44d on market — plan ~5-8 weeks vacancy on turnover, expect pricing pressure); 50% of comp listings sitting > 30 days — soft ceiling on asking rent; 7,378 units permitted in Hidalgo County in 2024 (641 in 5+ unit buildings).
- This rent runs 35% of the median local income ($55k/yr) — at the standard rent-burdened threshold; future hikes will face affordability resistance.
Forward outlook
- In year one you build about $29k of equity ($2k loan paydown + $27k appreciation (10.0% local appreciation)).
- Hidalgo County population projected at +28% by 2050 — long-run rental-demand tailwind backs the buy-and-hold thesis.
- By year 2, paydown + projected appreciation supports a ~$46k cash-out refi (75% LTV) — recoverable capital for the next deal without selling this one.
Negotiation context
- It's been on market 161 days — a 12% lower offer ($238k) is reasonable based on typical stale-listing flexibility.
Risks & watch-outs
- Climate carrying-cost: severe wind risk, 94% chance of damaging wind over 30y; extreme-heat days projected 7→22/yr by 2055 (HVAC capex compounding) — expect insurance premiums to compound above CPI over the hold.
Questions for the listing agent
- What do current leases actually rent for vs. the listed asking? Can we see a recent rent roll and the last 12 months of T-12 income?
- It's been on market 161 days. Have you received any prior offers? Is the seller open to a 51% concession, seller financing, or rate buy-down credit?
- Why hasn't it sold? Are there any deal-killer items the seller is aware of (foundation, flood, title, zoning, code violations)?
- Is there a deadline driving the sale (1031 exchange, divorce, estate, relocation)? That informs how much negotiation room exists.
- The area grade is low — what's the realistic commute time and amenity access for the typical tenant pool here? Any planned neighborhood developments (good or bad) we should know about?
- What's the average days-on-market for RENTAL listings here right now (not sales)? A rising rental-DOM trend means longer vacancies and softer asking-rent achievability than the comps imply.
- What's the recent tenant-quality profile in this submarket — average credit score on applications, eviction rate, late-payment / NSF rate, and stable-employment percentage? A property-management company in the area should have these aggregated.
- How much new for-sale + rental construction is in the pipeline within 1–3 miles? Heavy new supply typically softens prices + rents 12–24 months out; constrained supply supports both.
Investment metrics
- 1% rule
- 0.60% ✗
- Cap rate
- 2.82%
- Cash-on-cash
- -12.40%
- DSCR
- 0.45
- GRM
- 14.0
CMA / ARV
- ARV (median comp)
- $294,697
- List price
- $270,000
- Delta
- -8.38%
- Verdict
- FAIR
- Comps
- 20 within 1.0 mi
Show comp detail 12 sales within ~0.75 mi
| Address | Dist | Beds/Ba | Sqft | Sold | Price | $/sf | Match |
|---|---|---|---|---|---|---|---|
| 3006 Washington Ave | 0.04mi | 3/2.5 | 1,910 (+4%) | 4mo | $364,000 | $191 | 85 |
| 3004 Washington Ave | 0.04mi | 3/2.5 | 1,730 (-5%) | 3mo | $332,000 | $192 | 84 |
| 3007 Silver Oak Ave | 0.19mi | 3/2.5 | 1,780 (-3%) | 3mo | $332,000 | $187 | 82 |
| 900 Ramirez St | 0.29mi | 3/3.0 | 1,761 (-4%) | 1mo | $320,000 | $182 | 75 |
| 3007 Washington Ave | 0.02mi | 3/2.5 | 1,600 (-12%) | 2mo | $331,000 | $207 | 75 |
| 904 Ramirez St | 0.29mi | 3/2.0 | 1,688 (-8%) | 2mo | $320,000 | $190 | 72 |
| 3001 Silver Oak Ave | 0.37mi | 3/2.5 | 1,720 (-6%) | 0mo | $335,000 | $195 | 70 |
| 3011 Tulipan St | 0.53mi | 3/2.5 | 1,785 (-2%) | 3mo | $185,000 | $104 | 67 |
| 3018 Nickel Ave | 0.50mi | 4/2.5 (+1) | 1,888 (+3%) | 1mo | $245,000 | $130 | 63 |
| 3901 Crimson Ave | 0.64mi | 3/2.5 | 1,904 (+4%) | 4mo | $323,000 | $170 | 58 |
| 3101 Timberwood Ave | 0.65mi | 4/3.5 (+1) | 1,910 (+4%) | 0mo | $398,000 | $208 | 51 |
| 2101 W Sandstone Dr | 0.69mi | 3/2.5 | 1,559 (-15%) | 2mo | $260,000 | $167 | 40 |
Match score weights: distance 35% · size 25% · config 20% · recency 20%. Top-matched comps best support the ARV.
Projected returns pro-forma
10.0% appreciation · 2.45% rent growth · sell at horizon
- IRR
- 15.5%
- Equity multiple
- 2.28×
- Total profit
- $96,551
- Equity at exit
- $243,237
- IRR
- 15.0%
- Equity multiple
- 5.26×
- Total profit
- $321,971
- Equity at exit
- $524,551
Cash invested: $75,600 (down + closing). Projections, not guarantees.
Landlord ↔ Tenant lean methodology
- Overall (STATE)
- 87 Strongly Landlord-Friendly
- State Texas
- 87 Strongly Landlord-Friendly · R+5
- County
- — inherits STATE
- City
- — inherits STATE
ZIP-level market 78573
- Home prices YoY
- 8.0%
- Rents YoY
- 2.5%
- Active inventory
- 623
- Price-to-rent
- 14.0×
Monthly cashflow live
- Estimated rent
- $1,607 high interval (Pro) →
- Mortgage (P&I)
- −$1,416
- Tax from tax record
- −$522 /mo · $6,263/yr
- Insurance
- −$112
- HOA
- −$0
- Vacancy / Maint / Mgmt
- −$337
- Net cashflow
- $-781
Break-even live
UW: 25.0% down · 7.5% · 30yr · 1.5% tax · 5.0% vac · 8.0% maint · 8.0% mgmt
Financing live
Cash to close
- Down payment
- $67,500
- Closing costs
- $8,100
- Reserves months
- —
- Total cash needed
- —
Loan-product check · same deal, 3 products live
Conventional
25% down · 7.5% · 30yr
- Down + closing
- —
- Monthly P&I
- —
- Monthly cashflow
- —
- DSCR
- —
- Eligible?
- —
Personal DTI + credit; lowest rate.
DSCR
20% down · 8.5% · 30yr
- Down + closing
- —
- Monthly P&I
- —
- Monthly cashflow
- —
- DSCR
- —
- Eligible?
- —
No personal income docs; deal must DSCR.
Hard money
10% down · 12.0% · 12mo
- Down + closing
- —
- Monthly P&I
- —
- Monthly cashflow
- —
- DSCR
- —
- Eligible?
- —
Short-term bridge; refi at stabilization.
Rent comps 6 comps
| Address | Beds | Baths | Sqft | Rent | $/sqft | DOM | Units | Dist |
|---|---|---|---|---|---|---|---|---|
| 3102 Gabriel St Mission, TX | 3.0 | 2.0 | 1370 | $1,800 | $1.31 | 44d | 1 | 0.29mi |
| 3006 Gabriel St Mission, TX | 3.0 | 2.0 | 1433 | $1,600 | $1.12 | 44d | 1 | 0.30mi |
| 1806 W 31st 1/2 St Mission, TX | 4.0 | 2.0 | 1509 | $1,800 | $1.19 | 21d | 1 | 0.32mi |
| 2104 Magnolia St Mission, TX | 3.0 | 2.5 | 1382 | $1,500 | $1.09 | 44d | 1 | 0.99mi |
| 702 W 25th St Mission, TX | 3.0 | 2.0 | 1375 | $1,650 | $1.20 | 19d | 1 | 1.08mi |
| 3209 Black Oak Ln Mission, TX | 3.0 | 2.5 | 1672 | $1,700 | $1.02 | 14d | 1 | 1.23mi |
Listing history 17 events
-
2026-06-18days on market $270,000 Active 161 DOM
-
2026-06-17days on market $270,000 Active 160 DOM
-
2026-06-16days on market $270,000 Active 159 DOM
-
2026-06-15days on market $270,000 Active 158 DOM
-
2026-06-14days on market $270,000 Active 156 DOM
-
2026-06-10days on market $270,000 Active 153 DOM
-
2026-06-09days on market $270,000 Active 152 DOM
-
2026-06-08days on market $270,000 Active 151 DOM
-
2026-06-07days on market $270,000 Active 150 DOM
-
2026-06-03days on market $270,000 Active 146 DOM
-
2026-06-02days on market $270,000 Active 145 DOM
-
2026-06-01days on market $270,000 Active 144 DOM
-
2026-05-31days on market $270,000 Active 143 DOM
-
2026-05-31days on market $270,000 Active 142 DOM
-
2026-01-08$270,000 Active 465-char remark
Show marketing remark (465 chars)
The residence features 3 Bedrooms and 2 Bathrooms. Single Family Residence built in 2012; this home offers 1828 sq.ft. of interior living space on a 7692 square foot lot. It is situated in Hidalgo County and falls within the Mission Consolidated Independent School District. The home features tile flooring throughout. The exterior finish is predominantly stucco. Sprinkler system to the front area. The house has a storage bulding in the back patio of 160sq.ft.
-
2014-03-18soldstatus
-
2005-06-20soldstatus
ⓘ Source: listings_history table (triggers on properties + properties_extension) + one-shot
backfill from property_details.listing_events for pre-trigger history.
Tax reassessment forecast TX · Resets to sale price
- Current annual tax
- $6,263 · $522/mo
- Projected year-2 tax
- $6,263 · $522/mo
- Expected delta
- $0/yr ($0/mo · 0.0%)
ⓘ Screening estimate from a state-policy table — verify with the county assessor before closing.
Climate risk First Street
- Flood 1/10 Low FEMA zone X · 0% chance over 30 yrs
- Wildfire 3/10 Moderate
- Heat 9/10 Extreme 7 d/yr ≥111°F today · 22 d/yr by 30 yrs out
- Wind 8/10 Severe 94% chance of damaging wind over 30 yrs
- Air quality 2/10 Low 1 unhealthy d/yr today · 2 by 30 yrs out
Nearby sold comps map
Loading sold comps map…
Walkable amenities ~0.75 mi
Loading nearby amenities…
Taxation est. · year 1
- Rental income
- $19,279
- − Mortgage interest
- −$15,124
- − Property taxes
- −$6,263
- − Insurance
- −$1,350
- − Repairs & maintenance
- −$1,542
- − Management
- −$1,542
- − Depreciation
- −$7,855
- Taxable loss
- −$14,398
- Est. tax savings @ 24.0%
- +$3,455
- After-tax cash flow
- $-5,918/yr
For passive investors: Depreciation is non-cash, so a rental often shows a tax loss while cash-flowing — sheltering income. Rental losses are passive: they offset passive income freely, and up to $25,000/yr can offset ordinary (W-2) income if you actively participate and your MAGI is under $100k (phasing out to $0 by $150k); unused losses carry forward. On sale, claimed depreciation is recaptured at up to 25%, and gains may owe capital-gains tax (a 1031 exchange can defer both). Figures are a year-1 estimate at your 24.0% rate — not tax advice; consult a CPA.
Schools (NCES district)
- District
- Mission CISD
- NCES district ID
- 4831040
- Math proficiency
- 15% ▼ -35.00%
- Reading proficiency
- 28% ▼ -15.00%
- Median HH income
- $32,855
- Composite
- 17.47/100
- National rank
- #9061
- State rank
- #775 of 826 in TX
Livability — Mission
- Score
- 75/100
- State rank
- #148
- US rank
- #4155
Category grades
Schools grade is shown separately in the Schools card above.
Census & demographics
- Census place
- Mission, TX
- County
- Hidalgo County · 623,128 people
- City population
- 78,024
- Metro
- McAllen-Edinburg-Mission, TX
- Population (ZIP)
- 44,809
- Household income
- $55,000
- Rent vs Own
- Severe rent burden
- 855.0
Population outlook (Hidalgo County) Hauer SSP2
- Today (2025)
- 955,232 people
- By 2030
- 1,009,774 · +5.7%
- By 2040
- 1,120,332 · +17.3%
- By 2050
- 1,225,036 · +28.2%
- By 2075
- 1,439,189 · +50.7%
- By 2100
- 1,533,429 · +60.5%
Race, ethnicity, and origin ACS 2023
- Neighborhood character
- Predominantly Hispanic (96%)
- Race & ethnicity
- Hispanic / Latino 96% Two or more races 63% White 3%
- Hispanic origin (detail)
- Mexican 94%
- Foreign-born
- 28% · Canada
- Languages at home
- 12% English-only · Spanish 88%
Political lean MEDSL · Hidalgo
- 2024 margin
- Toss-up / Even · D 48.1% · R 51.0%
- 2008→2024 swing
- -41.6pp toward R · 2008: 38.7pp · 2024: -2.9pp
- All cycles
- 2024: R+2.9 2020: D+17.1 2016: D+40.5 2012: D+41.8 2008: D+38.7
Not yet ingested
- Civics
- —
Market trends
- HPI YoY
- ▲ 17.95%
- Current HPI
- 242.0711
- Rent YoY
- ▲ 2.45%
- Metro
- McAllen-Edinburg-Mission, TX
- State GDP YoY
- ▲ 3.95%
- F500 in state
- 110
Industry mix (Fortune 500 HQ in TX)
| Industry | F500 HQs | Revenue |
|---|---|---|
| Energy | 16 | $1,198B |
|
||
| Technology | 5 | $198B |
|
||
| Engineering / Construction | 4 | $72B |
|
||
| Energy Services | 3 | $60B |
|
||
| Utilities | 3 | $41B |
|
||
| Healthcare | 2 | $330B |
|
||
Price history
3 events — show timeline
- 2026-01-08 Listed $270,000 MCALLENMLS
- 2014-03-18 Sold (Public Records) — Public Records
- 2005-06-20 Sold (Public Records) — Public Records
Property tax history
+5.3%/yrLatest (2025): $6,263 · +13.6% YoY. Source: county tax records.
Cash-flow waterfall
monthlySold comps — $/sqft
last 12 mo · ≤1 miLoading sold comps…