 6-Plex
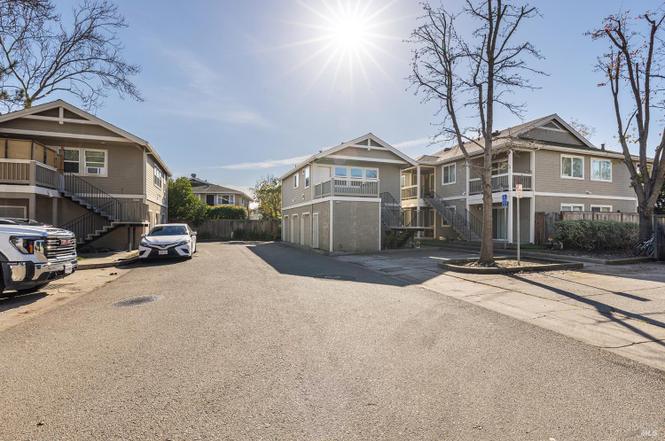
2131 Naomi Pl · Santa Rosa, CA
Flood risk 1/10 · Minimal
- FEMA flood zone
- X (unshaded)
- Chance of flooding over 30 yrs
- 0.0%
- Est. flood insurance / yr
- $507 – $1,088
Fire risk 1/10 · Minimal
- Est. fire insurance / yr
- $659 – $1,223
Heat risk 4/10 · Minor
- Hot days now (above 92°F)
- 7 days/yr
- Hot days in 30 yrs
- 16 days/yr
Wind risk 1/10 · Minimal
- Chance of severe wind over 30 yrs
- —
Air-quality risk 10/10 · Severe
- Unhealthy air days now
- 21 days/yr
- Unhealthy air days in 30 yrs
- 21 days/yr
Risk factors via First Street. Map © Google.
Why this score? — see what drove the B- grade
The composite is a weighted blend of 9 inputs, each scored 0–100. Each bar is that input's sub-score; the figure is the points it added to the 100-point composite (weight × sub-score).
- Cash flow +30.0/30.0
- DSCR +10.0/10.0
- 1% rule +9.5/10.0
- ARV discount +7.5/15.0
- Livability +3.8/5.0
- Schools +3.7/10.0
- Rent growth +2.5/5.0
- Condition / age +2.5/5.0
- Appreciation +0.0/10.0
$1,495,000
🖨 Deal sheet 📄 Offer letter ✓ Due diligence
Multi-family units
County records classify this as Multi-Family (5+ Unit). Listing-text estimate: 6 units. confirmed
5+ unit building — per-unit beds/baths from public records are typically unavailable; the breakdown below (if shown) is an estimate from the listing text.
Listing remarks
Located at the end of a private cul-de-sac in desirable West Santa Rosa, this well-maintained multi-unit property offers a compelling opportunity for investors seeking stable cash flow with upside. The property consists of six units across three separate buildings, including four spacious two-bedroom, two-bath units and two one-bedroom, one-bath units. Built in 2002 and in excellent condition, each unit features its own detached one-car garage and on-street parking. All units are currently rented below market, presenting a clear value-add opportunity through future rent growth while maintaining strong occupancy. Conveniently located near shopping, dining, and entertainment, with easy access
Key facts
- Six units
- Multi-unit property
- Private cul-de-sac
Tags
Property features AI
Finance
- HOA & community: No association
Exterior
- Parking: Garage parking and street parking available; 1 garage space
- Utilities: Public sewer
- Home design: Residential income property; Building contains five or more units; Original condition
- Exterior features: Court-front lot
Interior
- Bedrooms: Six total residential units: four 1-bedroom units and two 2-bedroom units; Unit types include apartments
- Bathrooms: 1 bathroom in each 1-bedroom unit; 2 full and 2 partial bathrooms listed for one 2-bedroom unit
- Heating & cooling: Central heating; Gas heating; No cooling
- Interior features: Laundry in each unit; No basement; Two levels
- Laundry & utility: Laundry located in each unit
Neighborhood map
What this means for you Summary
Snapshot
- This is a 6 × 6-bed/6.0-bath units multifamily listed at $1.50M.
Deal economics
- At list price, monthly cash flow is $8k ($95k/yr) — positive. Per door: $1k/mo.
- The deal already cash-flows at list — no discount required.
- Meets the 1% rule at list price ($22k rent vs $1.50M).
- Recommended offer: $1.32M (12.0% below list) — sets the bar for market timing.
- Cap rate 12.7% vs local median 2.5% in Santa Rosa — top-decile yield for the area; either an underpriced asset or a hidden risk that comps aren't pricing in. Stress-test before assuming the spread holds.
Location & tenants
- Location reads 75/100 on livability (#112 in CA, #3,940 nationally) — a middle-class / working-renter tenant base. Strengths: amenities A+, commute A+, employment A+; Watch: schools C-, cost of living F.
- Santa Rosa High (urban): math 31% / reading 47% proficiency, ranked #703 of 1,400 in CA (top 50%) — families likely to look elsewhere, expect single-tenant / working-renter base with shorter leases.
- Market conditions: Rents flat; 199 active listings in the ZIP; solid renter incomes; 1,039 units permitted in Sonoma County in 2024 (185 in 5+ unit buildings).
- At $21,688/mo this rent would consume 265% of the median local household income ($98k/yr) (locally 1770% of renters already pay >50% of income on rent) — very limited rent-growth headroom before tenants either downsize or default.
Forward outlook
- Local home prices are declining (-3.0%/yr); year-one equity from $10k of loan paydown is wiped out by about $45k of value loss. Plan a longer hold.
- Sonoma County population projected at +8% by 2050 — modest demand growth; plan on rents tracking national, not racing it.
- At projected returns (-3.0% appreciation + 0.1% rent growth), your $419k cash investment doubles in ~7 years — after that, you're playing with house money.
Negotiation context
- It's been on market 135 days — a 12% lower offer ($1.32M) is reasonable based on typical stale-listing flexibility.
- 2 sale attempts; this cycle's ask has dropped $200k (12%) from the opening price — seller is motivated, your offer sets the floor, not the list.
Questions for the listing agent
- It's been on market 135 days. Have you received any prior offers? Is the seller open to a 12% concession, seller financing, or rate buy-down credit?
- Can we see the unit-by-unit rent roll, current vacancy, and any below-market leases? What's the average tenancy length?
- What capital expenditures (roof, boiler, parking lot, exteriors) have been made in the last 5 years, and what's planned in the next 2?
- Why hasn't it sold? Are there any deal-killer items the seller is aware of (foundation, flood, title, zoning, code violations)?
- Is there a deadline driving the sale (1031 exchange, divorce, estate, relocation)? That informs how much negotiation room exists.
- What's the average days-on-market for RENTAL listings here right now (not sales)? A rising rental-DOM trend means longer vacancies and softer asking-rent achievability than the comps imply.
- What's the recent tenant-quality profile in this submarket — average credit score on applications, eviction rate, late-payment / NSF rate, and stable-employment percentage? A property-management company in the area should have these aggregated.
- How much new apartment / multifamily construction is in the pipeline within 1–3 miles? Heavy new supply (>2% of stock underway) typically softens rents 12–24 months out; light construction supports rent growth.
Investment metrics
- 1% rule
- 1.45% ✓
- Cap rate
- 12.66%
- Cash-on-cash
- 22.73%
- DSCR
- 2.01
- GRM
- 5.7
CMA / ARV
No comps found within radius.
Projected returns pro-forma
-3.0% appreciation · 0.1% rent growth · sell at horizon
- IRR
- 12.5%
- Equity multiple
- 1.48×
- Total profit
- $200,965
- Equity at exit
- $222,909
- IRR
- 19.2%
- Equity multiple
- 2.40×
- Total profit
- $585,743
- Equity at exit
- $129,260
Cash invested: $418,600 (down + closing). Projections, not guarantees.
Landlord ↔ Tenant lean methodology
- Overall (STATE)
- 18 Strongly Tenant-Friendly
- State California
- 18 Strongly Tenant-Friendly · D+13
- County
- — inherits STATE
- City
- — inherits STATE
ZIP-level market 95403
- Rents YoY
- 0.1%
- Active inventory
- 199
- Price-to-rent
- 34.5×
Monthly cashflow live
- Estimated rent
- $21,688 medium interval (Pro) →
- Mortgage (P&I)
- −$7,840
- Tax from tax record
- −$740 /mo · $8,884/yr
- Insurance
- −$623
- HOA
- −$0
- Vacancy / Maint / Mgmt
- −$4,554
- Net cashflow
- $7,930
Break-even live
6-unit breakdown (identical units grouped — click to expand)
| Units | Beds | Baths | Est. rent |
|---|---|---|---|
| 6× units | 6 | 6 | $21,690 |
| #1 | 6 | 6 | $3,615 |
| #2 | 6 | 6 | $3,615 |
| #3 | 6 | 6 | $3,615 |
| #4 | 6 | 6 | $3,615 |
| #5 | 6 | 6 | $3,615 |
| #6 | 6 | 6 | $3,615 |
| Total (6 units) | $21,688 | ||
UW: 25.0% down · 7.5% · 30yr · 1.5% tax · 5.0% vac · 8.0% maint · 8.0% mgmt
Financing live
Cash to close
- Down payment
- $373,750
- Closing costs
- $44,850
- Reserves months
- —
- Total cash needed
- —
Loan-product check · same deal, 3 products live
Conventional
25% down · 7.5% · 30yr
- Down + closing
- —
- Monthly P&I
- —
- Monthly cashflow
- —
- DSCR
- —
- Eligible?
- —
Personal DTI + credit; lowest rate.
DSCR
20% down · 8.5% · 30yr
- Down + closing
- —
- Monthly P&I
- —
- Monthly cashflow
- —
- DSCR
- —
- Eligible?
- —
No personal income docs; deal must DSCR.
Hard money
10% down · 12.0% · 12mo
- Down + closing
- —
- Monthly P&I
- —
- Monthly cashflow
- —
- DSCR
- —
- Eligible?
- —
Short-term bridge; refi at stabilization.
Listing history 21 events
-
2026-06-18days on market $1,495,000 Active 135 DOM
-
2026-06-17days on market $1,495,000 Active 134 DOM
-
2026-06-16days on market $1,495,000 Active 133 DOM
-
2026-06-15days on market $1,495,000 Active 132 DOM
-
2026-06-14days on market $1,495,000 Active 130 DOM
-
2026-06-13days on market $1,495,000 Active 129 DOM
-
2026-06-10days on market $1,495,000 Active 127 DOM
-
2026-06-09days on market $1,495,000 Active 126 DOM
-
2026-06-08days on market $1,495,000 Active 125 DOM
-
2026-06-07days on market $1,495,000 Active 124 DOM
-
2026-06-05days on market $1,495,000 Active 121 DOM
-
2026-06-03days on market $1,495,000 Active 120 DOM
-
2026-06-02days on market $1,495,000 Active 119 DOM
-
2026-06-01days on market $1,495,000 Active 118 DOM
-
2026-05-31days on market $1,495,000 Active 117 DOM
-
2026-05-30days on market $1,495,000 Active 116 DOM
-
2026-04-20price $1,495,000
-
2026-03-11status Active
-
2026-03-11price $1,595,000
-
2026-02-27historical Contingent (Show)
-
2026-02-03$1,695,000 Active
ⓘ Source: listings_history table (triggers on properties + properties_extension) + one-shot
backfill from property_details.listing_events for pre-trigger history.
Tax reassessment forecast CA · Resets to sale price
- Current annual tax
- $8,884 · $740/mo
- Projected year-2 tax
- $11,362 · $947/mo
- Expected delta
- +$2,478/yr (+$206/mo · 27.9%)
ⓘ Screening estimate from a state-policy table — verify with the county assessor before closing.
Climate risk First Street
- Flood 1/10 Low FEMA zone X (unshaded) · 0% chance over 30 yrs
- Wildfire 1/10 Low
- Heat 4/10 Moderate 7 d/yr ≥92°F today · 16 d/yr by 30 yrs out
- Wind 1/10 Low
- Air quality 10/10 Extreme 21 unhealthy d/yr today · 21 by 30 yrs out
Nearby sold comps map
Loading sold comps map…
Walkable amenities ~0.75 mi
Loading nearby amenities…
Taxation est. · year 1
- Rental income
- $260,256
- − Mortgage interest
- −$83,743
- − Property taxes
- −$8,884
- − Insurance
- −$7,475
- − Repairs & maintenance
- −$20,820
- − Management
- −$20,820
- − Depreciation
- −$43,491
- Taxable income
- $75,022
- Est. tax owed @ 24.0%
- −$18,005
- After-tax cash flow
- $77,159/yr
For passive investors: Depreciation is non-cash, so a rental often shows a tax loss while cash-flowing — sheltering income. Rental losses are passive: they offset passive income freely, and up to $25,000/yr can offset ordinary (W-2) income if you actively participate and your MAGI is under $100k (phasing out to $0 by $150k); unused losses carry forward. On sale, claimed depreciation is recaptured at up to 25%, and gains may owe capital-gains tax (a 1031 exchange can defer both). Figures are a year-1 estimate at your 24.0% rate — not tax advice; consult a CPA.
Schools (NCES district)
- District
- Santa Rosa High
- NCES district ID
- 0635830
- Math proficiency
- 31% —
- Reading proficiency
- 47% —
- Median HH income
- $62,000
- Composite
- 37.25/100
- National rank
- #8972
- State rank
- #703 of 1400 in CA
Livability — Santa Rosa
- Score
- 75/100
- State rank
- #112
- US rank
- #3940
Category grades
Schools grade is shown separately in the Schools card above.
Census & demographics
- Census place
- Santa Rosa, CA
- County
- Sonoma County · 449,805 people
- City population
- 210,074
- Metro
- Santa Rosa-Petaluma, CA
- Population (ZIP)
- 45,806
- Household income
- $98,191
- Rent vs Own
- Severe rent burden
- 1770.0
Population outlook (Sonoma County) Hauer SSP2
- Today (2025)
- 539,935 people
- By 2030
- 554,870 · +2.8%
- By 2040
- 573,262 · +6.2%
- By 2050
- 580,715 · +7.6%
- By 2075
- 579,229 · +7.3%
- By 2100
- 547,835 · +1.5%
Race, ethnicity, and origin ACS 2023
- Neighborhood character
- Diverse neighborhood (Simpson 0.61)
- Race & ethnicity
- White 50% Hispanic / Latino 37% Two or more races 13% Asian 5% Native American 2% Black 2%
- Hispanic origin (detail)
- Mexican 31%
- Common ancestry
- Italian 3% Slovak 2% Lithuanian 2%
- Foreign-born
- 20% · Canada, Vietnam, South Korea
- Languages at home
- 67% English-only · Spanish 26% Other Indo-European 1% Vietnamese 1%
Political lean MEDSL · Sonoma
- 2024 margin
- Solid D (+46.2) · D 71.4% · R 25.2% · Other 3.3%
- 2008→2024 swing
- -3.4pp toward R · 2008: 49.6pp · 2024: 46.2pp
- All cycles
- 2024: D+46.2 2020: D+51.5 2016: D+47.9 2012: D+44.9 2008: D+49.6
Not yet ingested
- Civics
- —
Market trends
- HPI YoY
- ▼ -679.94%
- Current HPI
- 254.3106
- Rent YoY
- ▲ 0.10%
- Metro
- Santa Rosa-Petaluma, CA
- State GDP YoY
- ▲ 3.21%
- F500 in state
- 116
Industry mix (Fortune 500 HQ in CA)
| Industry | F500 HQs | Revenue |
|---|---|---|
| Technology | 27 | $1,492B |
|
||
| Financial Services | 3 | $174B |
|
||
| Retail | 3 | $44B |
|
||
| Insurance | 3 | $26B |
|
||
| Media / Entertainment | 2 | $115B |
|
||
| Pharmaceuticals / Biotech | 2 | $62B |
|
||
Price history
-11.8% since first listed5 events — show timeline
- 2026-04-20 Price Changed $1,495,000 BAREIS
- 2026-03-11 Relisted — BAREIS
- 2026-03-11 Price Changed $1,595,000 BAREIS
- 2026-02-27 Contingent — BAREIS
- 2026-02-03 Listed $1,695,000 BAREIS
Property tax history
+1.7%/yrLatest (2025): $8,884 · +1.5% YoY. Source: county tax records.
Cash-flow waterfall
monthlySold comps — $/sqft
last 12 mo · ≤1 miLoading sold comps…