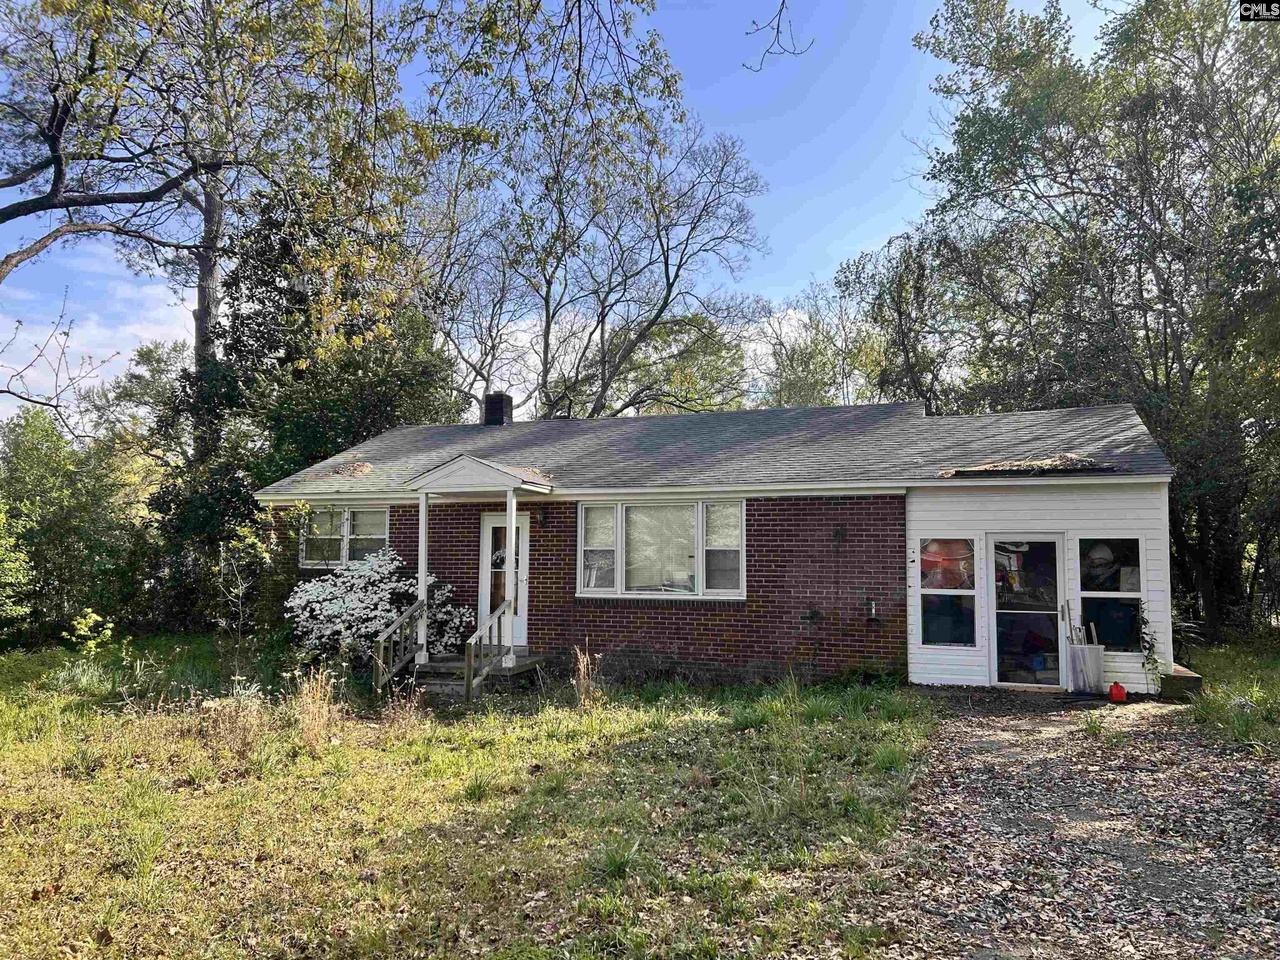
7534 Eileen St · Capitol View, SC
Flood risk 1/10 · Minimal
- FEMA flood zone
- X (unshaded)
- Chance of flooding over 30 yrs
- 0.0%
- Est. flood insurance / yr
- $507 – $1,088
Fire risk 4/10 · Minor
- Est. fire insurance / yr
- $783 – $1,453
Heat risk 6/10 · Moderate
- Hot days now (above 108°F)
- 7 days/yr
- Hot days in 30 yrs
- 16 days/yr
Wind risk 6/10 · Moderate
- Chance of severe wind over 30 yrs
- 74.0%
Air-quality risk 3/10 · Minor
- Unhealthy air days now
- 2 days/yr
- Unhealthy air days in 30 yrs
- 2 days/yr
Risk factors via First Street. Map © Google.
Why this score? — see what drove the B- grade
The composite is a weighted blend of 9 inputs, each scored 0–100. Each bar is that input's sub-score; the figure is the points it added to the 100-point composite (weight × sub-score).
- Cash flow +30.0/30.0
- 1% rule +10.0/10.0
- DSCR +10.0/10.0
- ARV discount +7.5/15.0
- Rent growth +3.0/5.0
- Schools +2.6/10.0
- Livability +2.5/5.0
- Condition / age +2.5/5.0
- Appreciation +0.0/10.0
$70,000
🖨 Deal sheet 📄 Offer letter ✓ Due diligence
Listing remarks
INVESTMENT PROPERTY! This home has so much potential, it's almost too good to be true. New roof put on in 2022. Sitting on almost half an acre, transform the backyard into your very own personal oasis. The enclosed garage can be used as a sun room, craft room, or even an office! Come see for yourself this deal of a property! Sold AS-IS. Disclaimer: CMLS has not reviewed and, therefore, does not endorse vendors who may appear in listings.
Key facts
- Enclosed garage
- Personal oasis
- New roof
Tags
Neighborhood map
What this means for you Summary
Snapshot
- This is a 3-bed/1.0-bath single-family listed at $70k.
Deal economics
- At list price, monthly cash flow is $758 ($9k/yr) — positive.
- The deal already cash-flows at list — no discount required.
- Meets the 1% rule at list price ($2k rent vs $70k).
Location & tenants
- Location reads: area grade B — affects rentability + tenant quality, not the cash-flow math above.
- Richland 01 (urban): math 26% / reading 36% proficiency, ranked #54 of 80 in SC (top 68%) — families likely to look elsewhere, expect single-tenant / working-renter base with shorter leases; 64% free/reduced lunch — lower-income household profile, screen leases tightly.
- Zoned schools: Mill Creek Elementary (math 22% / reading 22%, grade F, #475 of 597 statewide, top 81%, 339 students, 100% FRL); Lower Richland High (math 5% / reading 64%, grade F, #185 of 196 statewide, top 94%, 1,244 students, 100% FRL) — zoned schools average 100% FRL vs 64% district-wide (36 pts higher); higher-poverty schools than district average — tighter screening recommended.
- Market conditions: Rents rising (+2.1%/yr); 295 active listings in the ZIP; 16 comparable units currently listed for rent nearby; rentals at typical pace (median 14d on market — plan ~3-4 weeks tenant-placement turnaround); 3,472 units permitted in Richland County in 2024 (1,096 in 5+ unit buildings).
- This rent runs 32% of the median local income ($59k/yr) — at the standard rent-burdened threshold; future hikes will face affordability resistance.
Forward outlook
- Local home prices are declining (-3.0%/yr); year-one equity from $484 of loan paydown is wiped out by about $2k of value loss. Plan a longer hold.
- Richland County population projected at +30% by 2050 — long-run rental-demand tailwind backs the buy-and-hold thesis.
- At projected returns (-3.0% appreciation + 2.1% rent growth), your $20k cash investment doubles in ~3 years — after that, you're playing with house money.
Negotiation context
- Only 2 days on market — expect competitive offers; lowballing is unlikely to land.
Risks & watch-outs
- Watch-outs: built in 1955 — expect roof / HVAC / electrical / plumbing capex.
- Climate carrying-cost: major wind risk, 74% chance of damaging wind over 30y; extreme-heat days projected 7→16/yr by 2055 (HVAC capex compounding) — expect insurance premiums to compound above CPI over the hold.
Questions for the listing agent
- Built in 1955 — when were the roof, HVAC, electrical panel, plumbing, and water heater last replaced?
- Is there a deadline driving the sale (1031 exchange, divorce, estate, relocation)? That informs how much negotiation room exists.
- What's the average days-on-market for RENTAL listings here right now (not sales)? A rising rental-DOM trend means longer vacancies and softer asking-rent achievability than the comps imply.
- What's the recent tenant-quality profile in this submarket — average credit score on applications, eviction rate, late-payment / NSF rate, and stable-employment percentage? A property-management company in the area should have these aggregated.
- How much new for-sale + rental construction is in the pipeline within 1–3 miles? Heavy new supply typically softens prices + rents 12–24 months out; constrained supply supports both.
Investment metrics
- 1% rule
- 2.21% ✓
- Cap rate
- 19.28%
- Cash-on-cash
- 46.39%
- DSCR
- 3.06
- GRM
- 3.8
CMA / ARV
No comps found within radius.
Projected returns pro-forma
-3.0% appreciation · 2.08% rent growth · sell at horizon
- IRR
- 42.6%
- Equity multiple
- 2.81×
- Total profit
- $35,505
- Equity at exit
- $10,437
- IRR
- 48.3%
- Equity multiple
- 5.46×
- Total profit
- $87,388
- Equity at exit
- $6,052
Cash invested: $19,600 (down + closing). Projections, not guarantees.
Landlord ↔ Tenant lean methodology
- Overall (STATE)
- 90 Strongly Landlord-Friendly
- State South Carolina
- 90 Strongly Landlord-Friendly · R+6
- County
- — inherits STATE
- City
- — inherits STATE
ZIP-level market 29209
- Rents YoY
- 2.1%
- Active inventory
- 295
- Price-to-rent
- 3.8×
Monthly cashflow live
- Estimated rent
- $1,544 high interval (Pro) →
- Mortgage (P&I)
- −$367
- Tax from tax record
- −$66 /mo · $793/yr
- Insurance
- −$29
- HOA
- −$0
- Vacancy / Maint / Mgmt
- −$324
- Net cashflow
- $758
Break-even live
UW: 25.0% down · 7.5% · 30yr · 1.5% tax · 5.0% vac · 8.0% maint · 8.0% mgmt
Financing live
Cash to close
- Down payment
- $17,500
- Closing costs
- $2,100
- Reserves months
- —
- Total cash needed
- —
Loan-product check · same deal, 3 products live
Conventional
25% down · 7.5% · 30yr
- Down + closing
- —
- Monthly P&I
- —
- Monthly cashflow
- —
- DSCR
- —
- Eligible?
- —
Personal DTI + credit; lowest rate.
DSCR
20% down · 8.5% · 30yr
- Down + closing
- —
- Monthly P&I
- —
- Monthly cashflow
- —
- DSCR
- —
- Eligible?
- —
No personal income docs; deal must DSCR.
Hard money
10% down · 12.0% · 12mo
- Down + closing
- —
- Monthly P&I
- —
- Monthly cashflow
- —
- DSCR
- —
- Eligible?
- —
Short-term bridge; refi at stabilization.
Rent comps 16 comps
| Address | Beds | Baths | Sqft | Rent | $/sqft | DOM | Units | Dist |
|---|---|---|---|---|---|---|---|---|
| 164 Ashewood Commons Dr Columbia, SC | 2.0 | 2.0 | 1025 | $1,349 | $1.32 | 14d | 1 | 0.22mi |
| 1101 Hallbrook Dr Columbia, SC | 1.0–3.0 | 1.0–2.0 | 1050 | $1,229 | $1.17 | 14d | 1 | 0.22mi |
| 7712 Burdell Dr Columbia, SC | 3.0 | 1.0 | 1025 | $1,750 | $1.71 | 23d | 1 | 0.23mi |
| 7524 Marie St Columbia, SC | 3.0 | 1.0 | 1075 | $1,350 | $1.26 | 21d | 1 | 0.37mi |
| 7743 Garners Ferry Rd Columbia, SC | 1.0–3.0 | 1.0–2.5 | 1045 | $2,534 | $2.42 | 2d | 19 | 0.54mi |
| 7648 Garners Ferry Rd Columbia, SC | 3.0 | 1.0–2.0 | 828 | $1,279 | $1.54 | 14d | 1 | 0.60mi |
| 3 Ashley's Pl Unit 04 Columbia, SC | 2.0 | 1.5 | 1100 | $995 | $0.90 | 23d | 1 | 0.63mi |
| 150 Daphne Rd Columbia, SC | 3.0 | 2.0 | 1123 | $1,025 | $0.91 | 23d | 1 | 0.63mi |
| 7116 Tama Rd Columbia, SC | 3.0 | 1.0–1.5 | 600 | $1,225 | $2.04 | 23d | 1 | 1.00mi |
| 514 Spindrift Ln Columbia, SC | 2.0 | 1.0–1.5 | 1032 | $1,212 | $1.17 | 3d | 1 | 1.02mi |
| 1401 Elmtree Rd Apt B4 Columbia, SC | 2.0 | 2.0 | 1000 | $1,095 | $1.09 | 23d | 1 | 1.16mi |
| 76 Springway Dr Columbia, SC | 3.0 | 2.5 | 1326 | $1,829 | $1.38 | 11d | 1 | 1.20mi |
| 1030 Atlas Rd Columbia, SC | 2.0 | 1.0 | 833 | $1,224 | $1.47 | 14d | 5 | 1.31mi |
| 2705 Prince Charles Ct Columbia, SC | 4.0 | 2.0 | 1466 | $1,906 | $1.30 | 23d | 1 | 1.33mi |
| 600 Greenlawn Dr Columbia, SC | 1.0–3.0 | 1.0–2.0 | 1017 | $1,830 | $1.80 | 2d | 25 | 1.34mi |
| 820 Forest Park Rd Columbia, SC | 2.0 | 2.5 | 1300 | $1,600 | $1.23 | 14d | 1 | 1.48mi |
Listing history 3 events
-
2026-04-06status Pending
-
2026-04-03$70,000 Active
-
2003-02-28soldstatus $67,000
ⓘ Source: listings_history table (triggers on properties + properties_extension) + one-shot
backfill from property_details.listing_events for pre-trigger history.
Tax reassessment forecast SC · Resets to sale price
- Current annual tax
- $793 · $66/mo
- Projected year-2 tax
- $793 · $66/mo
- Expected delta
- $0/yr ($0/mo · 0.0%)
ⓘ Screening estimate from a state-policy table — verify with the county assessor before closing.
Climate risk First Street
- Flood 1/10 Low FEMA zone X (unshaded) · 0% chance over 30 yrs
- Wildfire 4/10 Moderate
- Heat 6/10 Major 7 d/yr ≥108°F today · 16 d/yr by 30 yrs out
- Wind 6/10 Major 74% chance of damaging wind over 30 yrs
- Air quality 3/10 Moderate 2 unhealthy d/yr today · 2 by 30 yrs out
Nearby sold comps map
Loading sold comps map…
Walkable amenities ~0.75 mi
Loading nearby amenities…
Taxation est. · year 1
- Rental income
- $18,531
- − Mortgage interest
- −$3,921
- − Property taxes
- −$793
- − Insurance
- −$350
- − Repairs & maintenance
- −$1,483
- − Management
- −$1,483
- − Depreciation
- −$2,036
- Taxable income
- $8,466
- Est. tax owed @ 24.0%
- −$2,032
- After-tax cash flow
- $7,060/yr
For passive investors: Depreciation is non-cash, so a rental often shows a tax loss while cash-flowing — sheltering income. Rental losses are passive: they offset passive income freely, and up to $25,000/yr can offset ordinary (W-2) income if you actively participate and your MAGI is under $100k (phasing out to $0 by $150k); unused losses carry forward. On sale, claimed depreciation is recaptured at up to 25%, and gains may owe capital-gains tax (a 1031 exchange can defer both). Figures are a year-1 estimate at your 24.0% rate — not tax advice; consult a CPA.
Schools (NCES district)
- District
- Richland 01
- NCES district ID
- 4503360
- Math proficiency
- 26% ▼ -7.00%
- Reading proficiency
- 36% ▼ -5.00%
- Median HH income
- $38,931
- Composite
- 25.94/100
- National rank
- #7335
- State rank
- #54 of 80 in SC
Livability — Capitol View
No livability data for this city. (Only ~50 U.S. cities are tracked.)
Census & demographics
- Census place
- Capitol View, SC
- County
- Richland County · 389,530 people
- Metro
- Columbia, SC
- Population (ZIP)
- 38,041
- Household income
- $58,772
- Rent vs Own
- Severe rent burden
- 1716.0
Population outlook (Richland County) Hauer SSP2
- Today (2025)
- 459,667 people
- By 2030
- 487,524 · +6.1%
- By 2040
- 542,035 · +17.9%
- By 2050
- 595,371 · +29.5%
- By 2075
- 732,998 · +59.5%
- By 2100
- 820,415 · +78.5%
Race, ethnicity, and origin ACS 2023
- Neighborhood character
- Diverse neighborhood (Simpson 0.62)
- Race & ethnicity
- Black 48% White 39% Two or more races 6% Hispanic / Latino 6% Asian 2%
- Hispanic origin (detail)
- Mexican 3% Puerto Rican 2%
- Common ancestry
- Slovak 2% Serbian 2% Italian 1%
- Foreign-born
- 6% · Canada, Jamaica
- Languages at home
- 93% English-only · Spanish 3% Arabic 1% Other Indo-European 1%
Political lean MEDSL · Richland
- 2024 margin
- Solid D (+34.6) · D 66.4% · R 31.8% · Other 1.8%
- 2008→2024 swing
- +5.7pp toward D · 2008: 28.9pp · 2024: 34.6pp
- All cycles
- 2024: D+34.6 2020: D+38.3 2016: D+32.9 2012: D+33.3 2008: D+28.9
Not yet ingested
- Civics
- —
Market trends
- HPI YoY
- ▼ -142.10%
- Current HPI
- 205.5679
- Rent YoY
- ▲ 2.08%
- Metro
- Columbia, SC
- State GDP YoY
- ▲ 4.51%
- F500 in state
- 2
Industry mix (Fortune 500 HQ in SC)
| Industry | F500 HQs | Revenue |
|---|---|---|
| Packaging | 1 | $7B |
|
||
Price history
+4.5% since first listed3 events — show timeline
- 2026-04-06 Pending — Consolidated MLS
- 2026-04-03 Listed $70,000 Consolidated MLS
- 2003-02-28 Sold (Public Records) $67,000 Public Records
Property tax history
+1.9%/yrLatest (2025): $793 · +4.1% YoY. Source: county tax records.
Cash-flow waterfall
monthlySold comps — $/sqft
last 12 mo · ≤1 miLoading sold comps…