 Multi-family
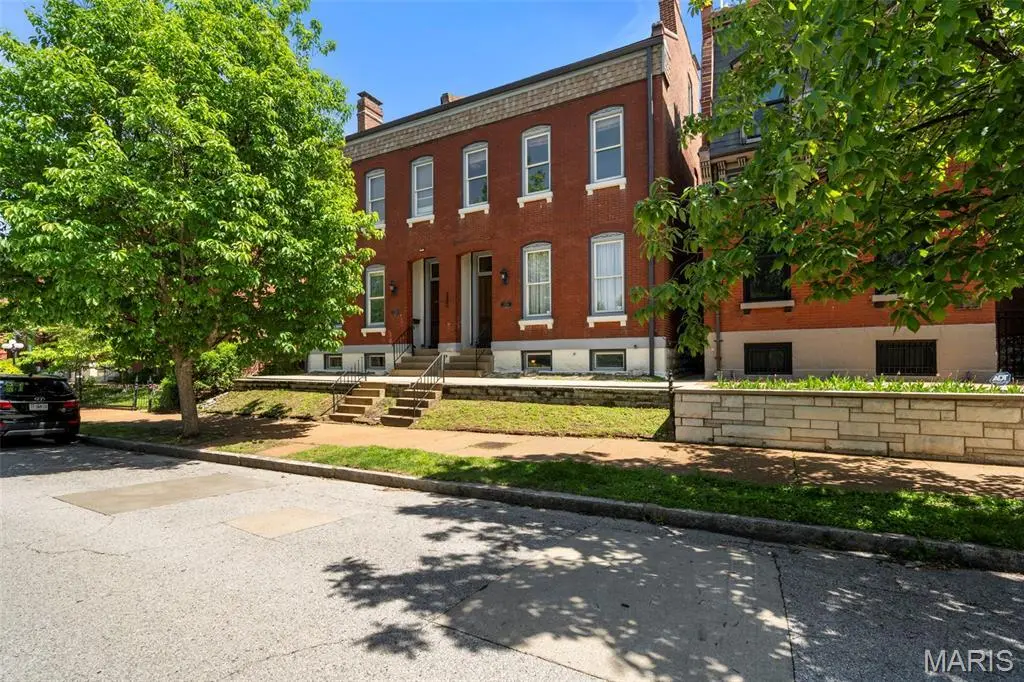
2702 S 13th St · St. Louis, MO
Flood risk 1/10 · Minimal
- FEMA flood zone
- X (unshaded)
- Chance of flooding over 30 yrs
- 0.0%
- Est. flood insurance / yr
- $473 – $860
Fire risk 1/10 · Minimal
- Est. fire insurance / yr
- $1,054 – $1,958
Heat risk 5/10 · Moderate
- Hot days now (above 109°F)
- 7 days/yr
- Hot days in 30 yrs
- 21 days/yr
Wind risk 2/10 · Minimal
- Chance of severe wind over 30 yrs
- 1.0%
Air-quality risk 3/10 · Minor
- Unhealthy air days now
- 3 days/yr
- Unhealthy air days in 30 yrs
- 4 days/yr
Risk factors via First Street. Map © Google.
Why this score? — see what drove the C+ grade
The composite is a weighted blend of 9 inputs, each scored 0–100. Each bar is that input's sub-score; the figure is the points it added to the 100-point composite (weight × sub-score).
- Cash flow +24.5/30.0
- ARV discount +15.0/15.0
- DSCR +7.9/10.0
- 1% rule +6.0/10.0
- Rent growth +3.7/5.0
- Livability +2.5/5.0
- Condition / age +2.5/5.0
- Schools +1.2/10.0
- Appreciation +0.0/10.0
$390,000
🖨 Deal sheet 📄 Offer letter ✓ Due diligence
Multi-family units
County records classify this as Multi-Family (2-4 Unit). Listing-text estimate: 1 unit. estimate disagrees with records
Listing remarks MLS
A solid opportunity in the heart of South City, this as-is triplex on S. 13th St. offers the kind of flexibility investors and owner-occupants love. The building sits in a walkable, historic neighborhood known for its brick architecture, local restaurants, and easy access to Soulard, Lafayette Square, and downtown. It’s the kind of spot where long-term tenants stay put and new residents are always looking for a place to land. Whether you’re looking to live in one space and let the other two offset your mortgage, or you want to renovate and maximize rents across all three, the numbers and location make this a compelling value play. The property is being sold as-is, giving you full control to shape it to your vision. With strong rental demand in the area and the convenience of nearby parks, shops, and major highways, this triplex has the potential to be a long-term performer in any portfolio—or a smart way to build equity while enjoying the benefits of owner-occupied multi-family living. All units are rent ready and property has 4 parking spaces. Just a short walk to AB and 1 block from Nine Street Deli.
Key facts
- 7,100 sq ft lot
- 4 parking spots
- Built 1884
Neighborhood map
What this means for you Summary
Snapshot
- This is a 5-bed/4.0-bath multifamily listed at $390k.
Deal economics
- At list price, monthly cash flow is $801 ($10k/yr) — positive.
- The deal already cash-flows at list — no discount required.
- Meets the 1% rule at list price ($4k rent vs $390k).
- Recommended offer: $384k (1.5% below list) — sets the bar for market timing.
- Cap rate 8.8% vs local median 5.0% in St. Louis — top-decile yield for the area; either an underpriced asset or a hidden risk that comps aren't pricing in. Stress-test before assuming the spread holds.
Location & tenants
- Location reads: area grade C — affects rentability + tenant quality, not the cash-flow math above.
- St. Louis City (urban): math 10% / reading 18% proficiency, ranked #312 of 324 in MO (top 96%) — low school quality limits family demand, transient renter base, plan for 1-2y turnover; 80% free/reduced lunch — lower-income household profile, screen leases tightly.
- Market conditions: Rents rising fast (+4.9%/yr); 240 active listings in the ZIP; 3 comparable units currently listed for rent nearby; rentals lingering (median 44d on market — plan ~5-8 weeks vacancy on turnover, expect pricing pressure); 100% of comp listings sitting > 30 days — soft ceiling on asking rent; 294 units permitted in St. Louis city in 2024 (227 in 5+ unit buildings).
- At $4,295/mo this rent would consume 89% of the median local household income ($58k/yr) (locally 1495% of renters already pay >50% of income on rent) — very limited rent-growth headroom before tenants either downsize or default.
Forward outlook
- Local home prices are declining (-3.0%/yr); year-one equity from $3k of loan paydown is wiped out by about $12k of value loss. Plan a longer hold.
- St. Louis County population projected to shrink 6% by 2050 — rents likely to lag national; underwrite the cash flow, not the appreciation.
- At projected returns (-3.0% appreciation + 4.9% rent growth), your $109k cash investment doubles in ~10 years — after that, you're playing with house money.
Negotiation context
- It's been on market 18 days — a 2% lower offer ($384k) is reasonable based on typical stale-listing flexibility.
Risks & watch-outs
- Watch-outs: built in 1884 — expect roof / HVAC / electrical / plumbing capex.
- Climate carrying-cost: extreme-heat days projected 7→21/yr by 2055 (HVAC capex compounding) — expect insurance premiums to compound above CPI over the hold.
Questions for the listing agent
- Built in 1884 — when were the roof, HVAC, electrical panel, plumbing, and water heater last replaced?
- Is there a deadline driving the sale (1031 exchange, divorce, estate, relocation)? That informs how much negotiation room exists.
- What's the average days-on-market for RENTAL listings here right now (not sales)? A rising rental-DOM trend means longer vacancies and softer asking-rent achievability than the comps imply.
- What's the recent tenant-quality profile in this submarket — average credit score on applications, eviction rate, late-payment / NSF rate, and stable-employment percentage? A property-management company in the area should have these aggregated.
- How much new apartment / multifamily construction is in the pipeline within 1–3 miles? Heavy new supply (>2% of stock underway) typically softens rents 12–24 months out; light construction supports rent growth.
Investment metrics
- 1% rule
- 1.10% ✓
- Cap rate
- 8.76%
- Cash-on-cash
- 8.81%
- DSCR
- 1.39
- GRM
- 7.6
CMA / ARV
- ARV (median comp)
- $677,832
- List price
- $390,000
- Delta
- -42.46%
- Verdict
- UNDERPRICED
- Comps
- 20 within 1.0 mi
Show comp detail 12 sales within ~0.75 mi
| Address | Dist | Beds/Ba | Sqft | Sold | Price | $/sf | Match |
|---|---|---|---|---|---|---|---|
| 2406 S 10th St | 0.33mi | 6/4.0 (+1) | 4,095 (+4%) | 4mo | $379,900 | $93 | 69 |
| 2115 S 9th | 0.54mi | 5/4.0 | 3,886 (-1%) | 8mo | $350,000 | $90 | 66 |
| 2704 Arsenal St | 0.71mi | 5/4.0 | 4,066 (+4%) | 5mo | $235,000 | $58 | 56 |
| 1213 Shenandoah Ave | 0.37mi | 5/4.0 | 4,268 (+9%) | 15mo | $435,000 | $102 | 56 |
| 2020 Menard St | 0.56mi | 6/4.0 (+1) | 3,972 (+1%) | 15mo | $350,000 | $88 | 54 |
| 2306 S 13th St | 0.34mi | 4/3.0 (-1) | 4,312 (+10%) | 14mo | $365,000 | $85 | 47 |
| 2213 S 12th | 0.39mi | 6/12.0 (+1) | 3,740 (-5%) | 9mo | $630,000 | $168 | 47 |
| 2010 Cushing St | 0.36mi | 4/2.0 (-1) | 3,500 (-11%) | 9mo | $250,000 | $71 | 44 |
| 1004 Geyer Ave | 0.67mi | 6/5.0 (+1) | 4,121 (+5%) | 12mo | $760,000 | $184 | 41 |
| 1006 Russell | 0.53mi | 6/— (+1) | 3,373 (-14%) | 8mo | $450,000 | $133 | 40 |
| 3329 Lemp Ave | 0.61mi | 4/4.0 (-1) | 3,410 (-13%) | 11mo | $365,000 | $107 | 36 |
| 1030 Geyer Ave | 0.64mi | 4/3.0 (-1) | 3,361 (-14%) | 13mo | $399,900 | $119 | 27 |
Match score weights: distance 35% · size 25% · config 20% · recency 20%. Top-matched comps best support the ARV.
Projected returns pro-forma
-3.0% appreciation · 4.89% rent growth · sell at horizon
- IRR
- -0.9%
- Equity multiple
- 0.96×
- Total profit
- $-3,839
- Equity at exit
- $58,150
- IRR
- 10.6%
- Equity multiple
- 1.90×
- Total profit
- $97,869
- Equity at exit
- $33,720
Cash invested: $109,200 (down + closing). Projections, not guarantees.
Landlord ↔ Tenant lean methodology
- Overall (STATE)
- 81 Strongly Landlord-Friendly
- State Missouri
- 81 Strongly Landlord-Friendly · R+10
- County
- — inherits STATE
- City
- — inherits STATE
ZIP-level market 63118
- Rents YoY
- 4.9%
- Active inventory
- 240
- Price-to-rent
- 22.7×
Monthly cashflow live
- Estimated rent
- $4,295 high interval (Pro) →
- Mortgage (P&I)
- −$2,045
- Tax from tax record
- −$384 /mo · $4,609/yr
- Insurance
- −$162
- HOA
- −$0
- Vacancy / Maint / Mgmt
- −$902
- Net cashflow
- $801
Break-even live
3-unit breakdown (identical units grouped — click to expand)
| Units | Beds | Baths | Est. rent |
|---|---|---|---|
| 3× units | 2 | 1 | $4,296 |
| #1 | 2 | 1 | $1,432 |
| #2 | 2 | 1 | $1,432 |
| #3 | 2 | 1 | $1,432 |
| Total (3 units) | $4,295 | ||
UW: 25.0% down · 7.5% · 30yr · 1.5% tax · 5.0% vac · 8.0% maint · 8.0% mgmt
Financing live
Cash to close
- Down payment
- $97,500
- Closing costs
- $11,700
- Reserves months
- —
- Total cash needed
- —
Loan-product check · same deal, 3 products live
Conventional
25% down · 7.5% · 30yr
- Down + closing
- —
- Monthly P&I
- —
- Monthly cashflow
- —
- DSCR
- —
- Eligible?
- —
Personal DTI + credit; lowest rate.
DSCR
20% down · 8.5% · 30yr
- Down + closing
- —
- Monthly P&I
- —
- Monthly cashflow
- —
- DSCR
- —
- Eligible?
- —
No personal income docs; deal must DSCR.
Hard money
10% down · 12.0% · 12mo
- Down + closing
- —
- Monthly P&I
- —
- Monthly cashflow
- —
- DSCR
- —
- Eligible?
- —
Short-term bridge; refi at stabilization.
Rent comps 3 comps
| Address | Beds | Baths | Sqft | Rent | $/sqft | DOM | Units | Dist |
|---|---|---|---|---|---|---|---|---|
| 2811 Missouri Ave Saint Louis, MO | 4.0 | 2.5 | 2673 | $3,622 | $1.36 | 43d | 1 | 0.41mi |
| 2048 Russell Blvd Saint Louis, MO | 4.0 | 2.0 | 3024 | $2,300 | $0.76 | 43d | 1 | 0.61mi |
| 715 Soulard St Saint Louis, MO | 5.0 | 3.0 | 2800 | $2,595 | $0.93 | 43d | 1 | 0.86mi |
Listing history 6 events
-
2026-06-02statusdays on market $390,000 Pending 18 DOM
-
2026-06-01days on market $390,000 Active 17 DOM
-
2026-05-31days on market $390,000 Active 16 DOM
-
2026-05-15status Active 1139-char remark
Show marketing remark (1139 chars)
A solid opportunity in the heart of South City, this as-is triplex on S. 13th St. offers the kind of flexibility investors and owner-occupants love. The building sits in a walkable, historic neighborhood known for its brick architecture, local restaurants, and easy access to Soulard, Lafayette Square, and downtown. It’s the kind of spot where long-term tenants stay put and new residents are always looking for a place to land. Whether you’re looking to live in one space and let the other two offset your mortgage, or you want to renovate and maximize rents across all three, the numbers and location make this a compelling value play. The property is being sold as-is, giving you full control to shape it to your vision. With strong rental demand in the area and the convenience of nearby parks, shops, and major highways, this triplex has the potential to be a long-term performer in any portfolio—or a smart way to build equity while enjoying the benefits of owner-occupied multi-family living. All units are rent ready and property has 4 parking spaces. Just a short walk to AB and 1 block from Nine Street Deli.
-
2026-05-15price $390,000 1139-char remark
Show marketing remark (1139 chars)
A solid opportunity in the heart of South City, this as-is triplex on S. 13th St. offers the kind of flexibility investors and owner-occupants love. The building sits in a walkable, historic neighborhood known for its brick architecture, local restaurants, and easy access to Soulard, Lafayette Square, and downtown. It’s the kind of spot where long-term tenants stay put and new residents are always looking for a place to land. Whether you’re looking to live in one space and let the other two offset your mortgage, or you want to renovate and maximize rents across all three, the numbers and location make this a compelling value play. The property is being sold as-is, giving you full control to shape it to your vision. With strong rental demand in the area and the convenience of nearby parks, shops, and major highways, this triplex has the potential to be a long-term performer in any portfolio—or a smart way to build equity while enjoying the benefits of owner-occupied multi-family living. All units are rent ready and property has 4 parking spaces. Just a short walk to AB and 1 block from Nine Street Deli.
-
2016-09-23soldstatus
ⓘ Source: listings_history table (triggers on properties + properties_extension) + one-shot
backfill from property_details.listing_events for pre-trigger history.
Tax reassessment forecast MO · Resets to sale price
- Current annual tax
- $4,609 · $384/mo
- Projected year-2 tax
- $4,609 · $384/mo
- Expected delta
- $0/yr ($0/mo · 0.0%)
ⓘ Screening estimate from a state-policy table — verify with the county assessor before closing.
Climate risk First Street
- Flood 1/10 Low FEMA zone X (unshaded) · 0% chance over 30 yrs
- Wildfire 1/10 Low
- Heat 5/10 Major 7 d/yr ≥109°F today · 21 d/yr by 30 yrs out
- Wind 2/10 Low 100% chance of damaging wind over 30 yrs
- Air quality 3/10 Moderate 3 unhealthy d/yr today · 4 by 30 yrs out
Nearby sold comps map
Loading sold comps map…
Walkable amenities ~0.75 mi
Loading nearby amenities…
Taxation est. · year 1
- Rental income
- $51,540
- − Mortgage interest
- −$21,846
- − Property taxes
- −$4,609
- − Insurance
- −$1,950
- − Repairs & maintenance
- −$4,123
- − Management
- −$4,123
- − Depreciation
- −$11,345
- Taxable income
- $3,544
- Est. tax owed @ 24.0%
- −$850
- After-tax cash flow
- $8,765/yr
For passive investors: Depreciation is non-cash, so a rental often shows a tax loss while cash-flowing — sheltering income. Rental losses are passive: they offset passive income freely, and up to $25,000/yr can offset ordinary (W-2) income if you actively participate and your MAGI is under $100k (phasing out to $0 by $150k); unused losses carry forward. On sale, claimed depreciation is recaptured at up to 25%, and gains may owe capital-gains tax (a 1031 exchange can defer both). Figures are a year-1 estimate at your 24.0% rate — not tax advice; consult a CPA.
Schools (NCES district)
- District
- St. Louis City
- NCES district ID
- 2929280
- Math proficiency
- 10% ▼ -6.00%
- Reading proficiency
- 18% ▼ -3.00%
- Median HH income
- $35,685
- Composite
- 11.54/100
- National rank
- #9699
- State rank
- #312 of 324 in MO
Livability — St. Louis
No livability data for this city. (Only ~50 U.S. cities are tracked.)
Census & demographics
- Census place
- St. Louis, MO
- County
- Saint Louis City · 254,015 people
- City population
- 283,259
- Metro
- St. Louis, MO-IL
- Population (ZIP)
- 25,913
- Household income
- $57,762
- Rent vs Own
- Severe rent burden
- 1495.0
Population outlook (St. Louis County) Hauer SSP2
- Today (2025)
- 315,737 people
- By 2030
- 313,865 · -0.6%
- By 2040
- 305,439 · -3.3%
- By 2050
- 296,529 · -6.1%
- By 2075
- 271,028 · -14.2%
- By 2100
- 255,359 · -19.1%
Race, ethnicity, and origin ACS 2023
- Neighborhood character
- Diverse neighborhood (Simpson 0.63)
- Race & ethnicity
- White 44% Black 41% Two or more races 8% Hispanic / Latino 8% Asian 2%
- Hispanic origin (detail)
- Mexican 6%
- Common ancestry
- Slovak 2% Lithuanian 2% Romanian 2%
- Foreign-born
- 6% · Canada, Vietnam
- Languages at home
- 90% English-only · Spanish 5% Vietnamese 1% French/Haitian/Cajun 1%
Political lean MEDSL · St. Louis
- 2024 margin
- Solid D (+64.7) · D 81.4% · R 16.7% · Other 2.0%
- 2008→2024 swing
- -3.5pp toward R · 2008: 68.2pp · 2024: 64.7pp
- All cycles
- 2024: D+64.7 2020: D+66.2 2016: D+63.7 2012: D+66.6 2008: D+68.2
Not yet ingested
- Civics
- —
Market trends
- HPI YoY
- ▼ -347.51%
- Current HPI
- 171.5963
- Rent YoY
- ▲ 4.89%
- Metro
- St. Louis, MO-IL
- State GDP YoY
- ▲ 1.84%
- F500 in state
- 20
Industry mix (Fortune 500 HQ in MO)
| Industry | F500 HQs | Revenue |
|---|---|---|
| Healthcare | 1 | $163B |
|
||
| Insurance | 1 | $21B |
|
||
| Industrial Technology | 1 | $17B |
|
||
| Retail | 1 | $16B |
|
||
| Industrial Distribution | 1 | $10B |
|
||
| Utilities | 1 | $9B |
|
||
Price history
3 events — show timeline
- 2026-05-15 Relisted — MARIS as Distributed by MLS Grid
- 2026-05-15 Price Changed $390,000 MARIS as Distributed by MLS Grid
- 2016-09-23 Sold (Public Records) — Public Records
Property tax history
+4.6%/yrLatest (2023): $4,609 · +4.5% YoY. Source: county tax records.
Cash-flow waterfall
monthlySold comps — $/sqft
last 12 mo · ≤1 miLoading sold comps…