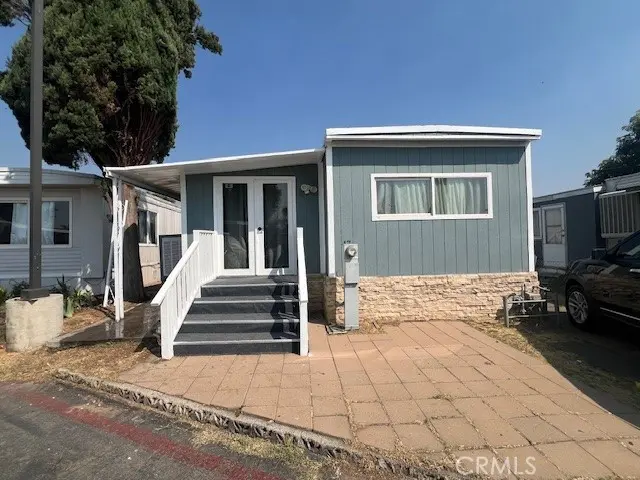
2075 W Rialto Ave. SPC #47 · San Bernardino, CA
Flood risk 1/10 · Minimal
- FEMA flood zone
- X (unshaded)
- Chance of flooding over 30 yrs
- 0.0%
- Est. flood insurance / yr
- $507 – $1,088
Fire risk 1/10 · Minimal
- Est. fire insurance / yr
- $659 – $1,223
Heat risk 8/10 · Major
- Hot days now (above 102°F)
- 7 days/yr
- Hot days in 30 yrs
- 19 days/yr
Wind risk 1/10 · Minimal
- Chance of severe wind over 30 yrs
- —
Air-quality risk 10/10 · Severe
- Unhealthy air days now
- 25 days/yr
- Unhealthy air days in 30 yrs
- 31 days/yr
Risk factors via First Street. Map © Google.
Why this score? — see what drove the B- grade
The composite is a weighted blend of 9 inputs, each scored 0–100. Each bar is that input's sub-score; the figure is the points it added to the 100-point composite (weight × sub-score).
- Cash flow +30.0/30.0
- 1% rule +10.0/10.0
- DSCR +10.0/10.0
- ARV discount +7.5/15.0
- Rent growth +3.9/5.0
- Schools +3.1/10.0
- Livability +3.0/5.0
- Condition / age +2.5/5.0
- Appreciation +0.0/10.0
$119,000
🖨 Deal sheet 📄 Offer letter ✓ Due diligence
Listing remarks MLS
Discover this charming 3 spacious bedrooms, 1 bathroom, well maintained, perfect for families or those seeking a peaceful environment. Enjoy a spacious living area with indoor laundry connections. All located in a friendly neighborhood mobile home park. Conveniently located near shopping centers, schools, park, hospital and easy access to the 10 and 210 freeway. Must see to appreciate. No warranties expressed or implied. Buyer to verify all information and permits.
Key facts
- Built 1983
- Listed 291 days
Neighborhood map
What this means for you Summary
Snapshot
- This is a 3-bed/1.0-bath land listed at $119k.
Deal economics
- At list price, monthly cash flow is $1k ($12k/yr) — positive.
- The deal already cash-flows at list — no discount required.
- Meets the 1% rule at list price ($2k rent vs $119k).
- Recommended offer: $105k (12.0% below list) — sets the bar for market timing.
- Cap rate 16.4% vs local median 3.5% in San Bernardino — top-decile yield for the area; either an underpriced asset or a hidden risk that comps aren't pricing in. Stress-test before assuming the spread holds.
Location & tenants
- Location reads 59/100 on livability (#661 in CA) — a working-class tenant base; expect higher turnover. Strengths: commute A+, housing A; Watch: schools D, employment D, crime F.
- Rialto Unified (suburban): math 25% / reading 46% proficiency, ranked #268 of 517 in CA (top 52%) — families likely to look elsewhere, expect single-tenant / working-renter base with shorter leases; 74% free/reduced lunch — lower-income household profile, screen leases tightly.
- Market conditions: Rents rising fast (+5.5%/yr); 90 active listings in the ZIP; 5,458 units permitted in San Bernardino County in 2024 (1,500 in 5+ unit buildings).
- At $2,313/mo this rent would consume 51% of the median local household income ($54k/yr) (locally 2569% of renters already pay >50% of income on rent) — very limited rent-growth headroom before tenants either downsize or default.
Forward outlook
- Local home prices are declining (-3.0%/yr); year-one equity from $823 of loan paydown is wiped out by about $4k of value loss. Plan a longer hold.
- San Bernardino County population projected at +15% by 2050 — modest demand growth; plan on rents tracking national, not racing it.
- At projected returns (-3.0% appreciation + 5.5% rent growth), your $33k cash investment doubles in ~4 years — after that, you're playing with house money.
Negotiation context
- It's been on market 291 days — a 12% lower offer ($105k) is reasonable based on typical stale-listing flexibility.
- 5 sale attempts since 3y ago; this cycle's ask has dropped $11k (8%) from the opening price — seller is motivated, your offer sets the floor, not the list.
Risks & watch-outs
- Climate carrying-cost: extreme-heat days projected 7→19/yr by 2055 (HVAC capex compounding) — expect insurance premiums to compound above CPI over the hold.
Questions for the listing agent
- It's been on market 291 days. Have you received any prior offers? Is the seller open to a 12% concession, seller financing, or rate buy-down credit?
- Why hasn't it sold? Are there any deal-killer items the seller is aware of (foundation, flood, title, zoning, code violations)?
- Is there a deadline driving the sale (1031 exchange, divorce, estate, relocation)? That informs how much negotiation room exists.
- Schools are D-rated, which usually means shorter tenancies and higher turnover. Who's the typical renter profile here, and what's been the actual vacancy rate?
- Crime grade is F in this area — have there been break-ins, vandalism, or insurance claims at this property in the last 3 years? What carrier currently insures it and at what premium?
- What's the average days-on-market for RENTAL listings here right now (not sales)? A rising rental-DOM trend means longer vacancies and softer asking-rent achievability than the comps imply.
- What's the recent tenant-quality profile in this submarket — average credit score on applications, eviction rate, late-payment / NSF rate, and stable-employment percentage? A property-management company in the area should have these aggregated.
- How much new for-sale + rental construction is in the pipeline within 1–3 miles? Heavy new supply typically softens prices + rents 12–24 months out; constrained supply supports both.
Investment metrics
- 1% rule
- 1.94% ✓
- Cap rate
- 16.43%
- Cash-on-cash
- 36.19%
- DSCR
- 2.61
- GRM
- 4.3
CMA / ARV
- ARV (median comp)
- $612,768,438
- List price
- $119,000
- Delta
- -99.98%
- Verdict
- UNDERPRICED
- Comps
- 8 within 2.0 mi
Projected returns pro-forma
-3.0% appreciation · 5.5% rent growth · sell at horizon
- IRR
- 34.8%
- Equity multiple
- 2.52×
- Total profit
- $50,714
- Equity at exit
- $17,743
- IRR
- 42.9%
- Equity multiple
- 5.58×
- Total profit
- $152,469
- Equity at exit
- $10,289
Cash invested: $33,320 (down + closing). Projections, not guarantees.
Landlord ↔ Tenant lean methodology
- Overall (STATE)
- 18 Strongly Tenant-Friendly
- State California
- 18 Strongly Tenant-Friendly · D+13
- County
- — inherits STATE
- City
- — inherits STATE
ZIP-level market 92410
- Home prices YoY
- -9.7%
- Rents YoY
- 5.5%
- Active inventory
- 90
- Price-to-rent
- 4.3×
Monthly cashflow live
- Estimated rent
- $2,313 medium interval (Pro) →
- Mortgage (P&I)
- −$624
- Tax est. 1.5%
- −$149 /mo · $1,785/yr
- Insurance
- −$50
- HOA
- −$0
- Vacancy / Maint / Mgmt
- −$486
- Net cashflow
- $1,005
Break-even live
UW: 25.0% down · 7.5% · 30yr · 1.5% tax · 5.0% vac · 8.0% maint · 8.0% mgmt
Financing live
Cash to close
- Down payment
- $29,750
- Closing costs
- $3,570
- Reserves months
- —
- Total cash needed
- —
Loan-product check · same deal, 3 products live
Conventional
25% down · 7.5% · 30yr
- Down + closing
- —
- Monthly P&I
- —
- Monthly cashflow
- —
- DSCR
- —
- Eligible?
- —
Personal DTI + credit; lowest rate.
DSCR
20% down · 8.5% · 30yr
- Down + closing
- —
- Monthly P&I
- —
- Monthly cashflow
- —
- DSCR
- —
- Eligible?
- —
No personal income docs; deal must DSCR.
Hard money
10% down · 12.0% · 12mo
- Down + closing
- —
- Monthly P&I
- —
- Monthly cashflow
- —
- DSCR
- —
- Eligible?
- —
Short-term bridge; refi at stabilization.
Listing history 15 events
-
2026-06-09days on market $119,000 Active 291 DOM
-
2026-06-08days on market $119,000 Active 290 DOM
-
2026-06-07days on market $119,000 Active 289 DOM
-
2026-06-04days on market $119,000 Active 286 DOM
-
2026-06-03days on market $119,000 Active 285 DOM
-
2026-06-02days on market $119,000 Active 284 DOM
-
2026-06-01days on market $119,000 Active 283 DOM
-
2026-05-31days on market $119,000 Active 282 DOM
-
2025-09-13price $119,000 469-char remark
Show marketing remark (469 chars)
Discover this charming 3 spacious bedrooms, 1 bathroom, well maintained, perfect for families or those seeking a peaceful environment. Enjoy a spacious living area with indoor laundry connections. All located in a friendly neighborhood mobile home park. Conveniently located near shopping centers, schools, park, hospital and easy access to the 10 and 210 freeway. Must see to appreciate. No warranties expressed or implied. Buyer to verify all information and permits.
-
2025-08-22$130,000 Active 469-char remark
Show marketing remark (469 chars)
Discover this charming 3 spacious bedrooms, 1 bathroom, well maintained, perfect for families or those seeking a peaceful environment. Enjoy a spacious living area with indoor laundry connections. All located in a friendly neighborhood mobile home park. Conveniently located near shopping centers, schools, park, hospital and easy access to the 10 and 210 freeway. Must see to appreciate. No warranties expressed or implied. Buyer to verify all information and permits.
-
2025-08-14historical $130,000 469-char remark
Show marketing remark (469 chars)
Discover this charming 3 spacious bedrooms, 1 bathroom, well maintained, perfect for families or those seeking a peaceful environment. Enjoy a spacious living area with indoor laundry connections. All located in a friendly neighborhood mobile home park. Conveniently located near shopping centers, schools, park, hospital and easy access to the 10 and 210 freeway. Must see to appreciate. No warranties expressed or implied. Buyer to verify all information and permits.
-
2023-06-01status Active
-
2023-05-01status Active
-
2023-02-16status Active
-
2023-02-07$65,000 Active
ⓘ Source: listings_history table (triggers on properties + properties_extension) + one-shot
backfill from property_details.listing_events for pre-trigger history.
Climate risk First Street
- Flood 1/10 Low FEMA zone X (unshaded) · 0% chance over 30 yrs
- Wildfire 1/10 Low
- Heat 8/10 Severe 7 d/yr ≥102°F today · 19 d/yr by 30 yrs out
- Wind 1/10 Low
- Air quality 10/10 Extreme 25 unhealthy d/yr today · 31 by 30 yrs out
Nearby sold comps map
Loading sold comps map…
Walkable amenities ~0.75 mi
Loading nearby amenities…
Taxation est. · year 1
- Rental income
- $27,755
- − Mortgage interest
- −$6,666
- − Property taxes
- −$1,785
- − Insurance
- −$595
- − Repairs & maintenance
- −$2,220
- − Management
- −$2,220
- − Depreciation
- −$3,462
- Taxable income
- $10,807
- Est. tax owed @ 24.0%
- −$2,594
- After-tax cash flow
- $9,465/yr
For passive investors: Depreciation is non-cash, so a rental often shows a tax loss while cash-flowing — sheltering income. Rental losses are passive: they offset passive income freely, and up to $25,000/yr can offset ordinary (W-2) income if you actively participate and your MAGI is under $100k (phasing out to $0 by $150k); unused losses carry forward. On sale, claimed depreciation is recaptured at up to 25%, and gains may owe capital-gains tax (a 1031 exchange can defer both). Figures are a year-1 estimate at your 24.0% rate — not tax advice; consult a CPA.
Schools (NCES district)
- District
- Rialto Unified
- NCES district ID
- 0632370
- Math proficiency
- 25% ▲ 3.00%
- Reading proficiency
- 46% ▲ 10.00%
- Median HH income
- $50,916
- Composite
- 30.77/100
- National rank
- #6154
- State rank
- #268 of 517 in CA
Livability — San Bernardino
- Score
- 59/100
- State rank
- #661
- US rank
- #20479
Category grades
Schools grade is shown separately in the Schools card above.
Census & demographics
- Census place
- San Bernardino, CA
- County
- San Bernardino County · 2,030,291 people
- City population
- 255,614
- Metro
- Riverside-San Bernardino-Ontario, CA
- Population (ZIP)
- 47,869
- Household income
- $54,181
- Rent vs Own
- Severe rent burden
- 2569.0
Population outlook (San Bernardino County) Hauer SSP2
- Today (2025)
- 2,300,329 people
- By 2030
- 2,378,907 · +3.4%
- By 2040
- 2,523,137 · +9.7%
- By 2050
- 2,642,388 · +14.9%
- By 2075
- 2,880,769 · +25.2%
- By 2100
- 2,909,436 · +26.5%
Race, ethnicity, and origin ACS 2023
- Neighborhood character
- Predominantly Hispanic (80%)
- Race & ethnicity
- Hispanic / Latino 80% Two or more races 12% Black 8% White 7% Asian 3%
- Hispanic origin (detail)
- Mexican 70%
- Common ancestry
- Romanian 0%
- Foreign-born
- 29% · Canada, Vietnam, Jamaica
- Languages at home
- 32% English-only · Spanish 65% Vietnamese 1%
Political lean MEDSL · San Bernardino
- 2024 margin
- Toss-up / Even · D 47.5% · R 49.7% · Other 2.8%
- 2008→2024 swing
- -8.5pp toward R · 2008: 6.3pp · 2024: -2.1pp
- All cycles
- 2024: R+2.1 2020: D+10.7 2016: D+9.8 2012: D+5.4 2008: D+6.3
Not yet ingested
- Civics
- —
Market trends
- HPI YoY
- ▼ -54.39%
- Current HPI
- 504.0299
- Rent YoY
- ▲ 5.50%
- Metro
- Riverside-San Bernardino-Ontario, CA
- State GDP YoY
- ▲ 3.21%
- F500 in state
- 116
Industry mix (Fortune 500 HQ in CA)
| Industry | F500 HQs | Revenue |
|---|---|---|
| Technology | 27 | $1,492B |
|
||
| Financial Services | 3 | $174B |
|
||
| Retail | 3 | $44B |
|
||
| Insurance | 3 | $26B |
|
||
| Media / Entertainment | 2 | $115B |
|
||
| Pharmaceuticals / Biotech | 2 | $62B |
|
||
Price history
+83.1% since first listed7 events — show timeline
- 2025-09-13 Price Changed $119,000 CRMLS
- 2025-08-22 Listed $130,000 CRMLS
- 2025-08-14 Coming Soon $130,000 CRMLS
- 2023-06-01 Relisted — CRMLS
- 2023-05-01 Relisted — CRMLS
- 2023-02-16 Relisted — CRMLS
- 2023-02-07 Listed $65,000 CRMLS
Property tax history
+51.8%/yrLatest (2025): $38,541 · +3.7% YoY. Source: county tax records.
Cash-flow waterfall
monthlySold comps — $/sqft
last 12 mo · ≤1 miLoading sold comps…