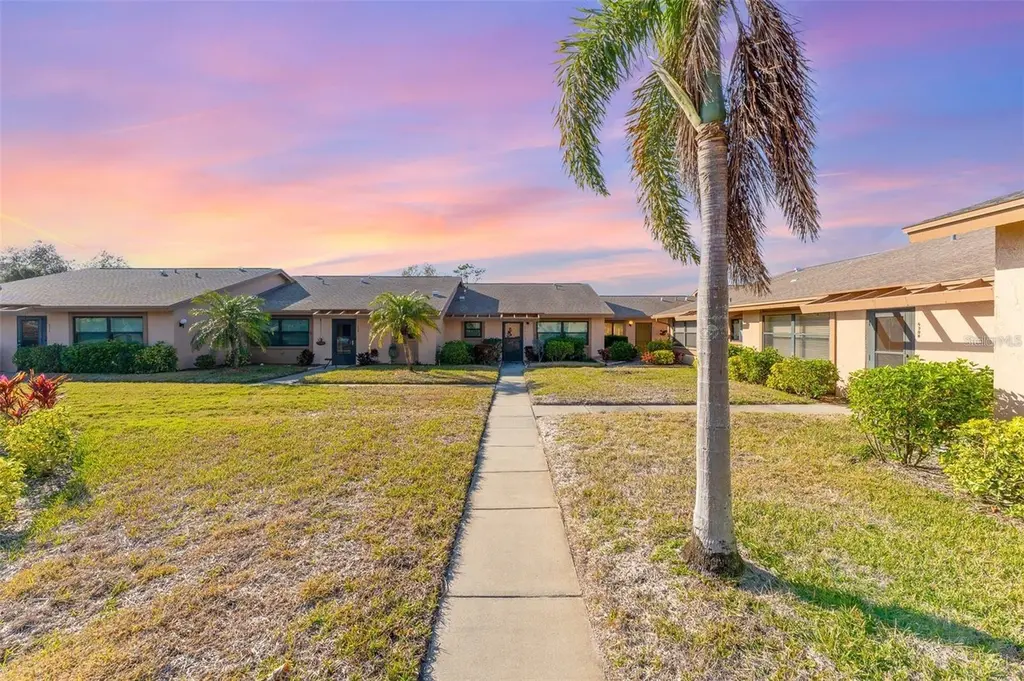
6314 29th Ave W · Bradenton, FL
Flood risk 1/10 · Minimal
- FEMA flood zone
- X (unshaded)
- Chance of flooding over 30 yrs
- 0.0%
- Est. flood insurance / yr
- $507 – $1,088
Fire risk 1/10 · Minimal
- Est. fire insurance / yr
- $947 – $1,759
Heat risk 10/10 · Severe
- Hot days now (above 106°F)
- 7 days/yr
- Hot days in 30 yrs
- 29 days/yr
Wind risk 10/10 · Severe
- Chance of severe wind over 30 yrs
- 99.0%
Air-quality risk 3/10 · Minor
- Unhealthy air days now
- 2 days/yr
- Unhealthy air days in 30 yrs
- 2 days/yr
Risk factors via First Street. Map © Google.
Why this score? — see what drove the D grade
The composite is a weighted blend of 9 inputs, each scored 0–100. Each bar is that input's sub-score; the figure is the points it added to the 100-point composite (weight × sub-score).
- Cash flow +11.9/30.0
- ARV discount +7.5/15.0
- 1% rule +7.0/10.0
- Schools +4.4/10.0
- Livability +4.0/5.0
- DSCR +3.5/10.0
- Condition / age +2.5/5.0
- Rent growth +2.4/5.0
- Appreciation +0.0/10.0
$149,999
🖨 Deal sheet (PDF) 📄 Offer letter ✓ Due diligence
Listing remarks
Move-In Ready Condo – 15 Minutes to Anna Maria Island! This beautifully updated 1-bedroom, 1-bath condo in the sought-after Meadowcroft South community offers the perfect blend of comfort, convenience, and coastal living. Recent upgrades include a new A/C, flooring, washer, dryer, and refrigerator, ensuring a move-in-ready experience. The spacious open-concept layout features cathedral ceilings, making the living area feel even more open and airy. Easy-maintenance vinyl flooring runs throughout the main areas, while the well-appointed kitchen provides plenty of storage. A convenient in-unit washer and dryer add to the home’s practicality and there is 1 assigned parking space. Th
Key facts
- Recent upgrades
- Landscaped pool area
- In unit washer dryer
Tags
Property features AI
Finance
- Other: Unit is furnished; Condo on first floor; Homestead exempt
- Financial info: Total monthly fees $560 (total annual fees $6,720); Lease restrictions apply
- HOA & community: Monthly HOA $560; HOA covers cable TV, insurance, grounds maintenance, pool, recreational facilities, and water; Association amenities include clubhouse, pool, recreation facilities, and spa/hot tub; Association approval required; Pets allowed (maximum ~25 lbs); Clubhouse and sidewalks in community
Exterior
- Utilities: Public water; Public sewer; Cable connected; Electricity connected
- Home design: Condominium; One story; Southeast facing; Entry on floor 1
- Construction: Stucco exterior; Shingle roof; Block foundation; Built using stucco construction
- Exterior features: Exterior lighting; Rain gutters; Sidewalk; Sliding doors; Paved road access
Interior
- Kitchen: Dishwasher; Range; Microwave; Refrigerator
- Bedrooms: 1 bedroom (located on floor 1)
- Flooring: Carpet; Ceramic tile
- Bathrooms: 1 full bathroom
- Heating & cooling: Central heating; Central air conditioning
- Interior features: Cathedral ceilings; Ceiling fans; Living room/dining room combo; Open floorplan
- Laundry & utility: Washer and dryer inside the unit (in kitchen)
Neighborhood map
What this means for you Summary
Snapshot
- This is a 1-bed/1.0-bath condo listed at $150k.
Deal economics
- At list price, monthly cash flow is $-38 ($-452/yr) — negative.
- To cash-flow at today's rent, offer at most $143k (4.4% below list).
- Meets the 1% rule at list price ($2k rent vs $150k).
- Recommended offer: $143k (4.4% below list) — sets the bar for cash-flow.
- Cap rate 6.0% vs local median 3.6% in Bradenton — top-decile yield for the area; either an underpriced asset or a hidden risk that comps aren't pricing in. Stress-test before assuming the spread holds.
Location & tenants
- Location reads 81/100 on livability (#101 in FL, #1,528 nationally) — a professional / high-income tenant draw. Strengths: commute A+, cost of living A+, housing A+; Watch: employment D+, crime D, amenities F.
- Manatee (suburban): math 54% / reading 50% proficiency, ranked #26 of 73 in FL (top 36%) — acceptable for families but not a draw, mixed tenant base, ~2y average lease.
- Zoned schools: Sea Breeze Elementary School (math 48% / reading 43%, grade D-, #1,247 of 2,144 statewide, top 59%, 499 students, 74% FRL); W. D. Sugg Middle School (math 34% / reading 28%, grade F, #462 of 571 statewide, top 81%, 1,010 students, 72% FRL); Bayshore High School (math 17% / reading 26%, grade F, #546 of 667 statewide, top 82%, 1,435 students, 65% FRL) — zoned schools average 70% FRL vs 51% district-wide (20 pts higher); higher-poverty schools than district average — tighter screening recommended.
- Zoned-school proficiency averages 33% at this address vs 52% district-wide (-19 pts) — the specific schools serving this property underperform the Manatee average; the district grade overstates school quality for this exact location.
- Market conditions: Rents soft (-0.3%/yr); 514 active listings in the ZIP; 38 comparable units currently listed for rent nearby; rentals at typical pace (median 18d on market — plan ~3-4 weeks tenant-placement turnaround); solid renter incomes; 7,472 units permitted in Manatee County in 2024 (1,782 in 5+ unit buildings).
Forward outlook
- Local home prices are declining (-3.0%/yr); year-one equity from $1k of loan paydown is wiped out by about $4k of value loss. Plan a longer hold.
- Manatee County population projected at +43% by 2050 — long-run rental-demand tailwind backs the buy-and-hold thesis.
Negotiation context
- It's been on market 48 days — a 3% lower offer ($145k) is reasonable based on typical stale-listing flexibility.
- 2 sale attempts with the ask held roughly flat each time — persistent listings suggest the price (not the market) is what's stuck; bring a comps-based counter.
- Current owner paid $46k; list at $150k implies a 223% gain — meaningful room to come down on a strong offer.
Risks & watch-outs
- Watch-outs: HOA is 31% of rent.
- Climate carrying-cost: severe wind risk, 99% chance of damaging wind over 30y; extreme-heat days projected 7→29/yr by 2055 (HVAC capex compounding) — expect insurance premiums to compound above CPI over the hold.
Questions for the listing agent
- What do current leases actually rent for vs. the listed asking? Can we see a recent rent roll and the last 12 months of T-12 income?
- It's been on market 48 days. Have you received any prior offers? Is the seller open to a 4% concession, seller financing, or rate buy-down credit?
- What does the HOA fee cover, when was the last increase, and are there any pending special assessments or reserve-fund shortfalls?
- Any open or pending special assessments — roof, HVAC, plumbing, elevator, façade? What's the per-unit balance and payoff schedule, and is the seller paying it off at close or rolling it to the buyer?
- Is there a deadline driving the sale (1031 exchange, divorce, estate, relocation)? That informs how much negotiation room exists.
- Crime grade is D in this area — have there been break-ins, vandalism, or insurance claims at this property in the last 3 years? What carrier currently insures it and at what premium?
- The area grade is low — what's the realistic commute time and amenity access for the typical tenant pool here? Any planned neighborhood developments (good or bad) we should know about?
- What's the average days-on-market for RENTAL listings here right now (not sales)? A rising rental-DOM trend means longer vacancies and softer asking-rent achievability than the comps imply.
- What's the recent tenant-quality profile in this submarket — average credit score on applications, eviction rate, late-payment / NSF rate, and stable-employment percentage? A property-management company in the area should have these aggregated.
- How much new apartment / multifamily construction is in the pipeline within 1–3 miles? Heavy new supply (>2% of stock underway) typically softens rents 12–24 months out; light construction supports rent growth.
Investment metrics
- 1% rule
- 1.20% ✓
- Cap rate
- 5.99%
- Cash-on-cash
- -1.08%
- DSCR
- 0.95
- GRM
- 6.9
CMA / ARV
No comps found within radius.
Projected returns pro-forma
-3.0% appreciation · 0.0% rent growth · sell at horizon
- IRR
- -22.8%
- Equity multiple
- 0.25×
- Total profit
- $-31,694
- Equity at exit
- $22,365
- IRR
- -35.1%
- Equity multiple
- -0.19×
- Total profit
- $-49,909
- Equity at exit
- $12,969
Cash invested: $42,000 (down + closing). Projections, not guarantees.
Landlord ↔ Tenant lean methodology
- Overall (STATE)
- 87 Strongly Landlord-Friendly
- State Florida
- 87 Strongly Landlord-Friendly · R+3
- County
- — inherits STATE
- City
- — inherits STATE
ZIP-level market 34209
- Rents YoY
- -0.3%
- Active inventory
- 514
- Price-to-rent
- 6.9×
Monthly cashflow live
- Estimated rent
- $1,800 high interval (Pro) →
- Mortgage (P&I)
- −$787
- Tax from tax record
- −$51 /mo · $609/yr
- Insurance
- −$62
- HOA
- −$560
- Vacancy / Maint / Mgmt
- −$378
- Net cashflow
- $-38
Break-even live
Sensitivity live
| Price | -10% $47 | -5% $5 | +0% $-38 | +5% $-80 | +10% $-123 |
|---|---|---|---|---|---|
| Rent | -10% $-180 | -5% $-109 | +0% $-38 | +5% $33 | +10% $105 |
| Rate | -1.0pp $38 | -0.5pp $0 | base $-38 | +0.5pp $-77 | +1.0pp $-116 |
UW: 25.0% down · 7.5% · 30yr · 1.5% tax · 5.0% vac · 8.0% maint · 8.0% mgmt
Financing live
Cash to close
- Down payment
- $37,500
- Closing costs
- $4,500
- Reserves months
- —
- Total cash needed
- —
Loan-product check · same deal, 3 products live
Conventional
25% down · 7.5% · 30yr
- Down + closing
- —
- Monthly P&I
- —
- Monthly cashflow
- —
- DSCR
- —
- Eligible?
- —
Personal DTI + credit; lowest rate.
DSCR
20% down · 8.5% · 30yr
- Down + closing
- —
- Monthly P&I
- —
- Monthly cashflow
- —
- DSCR
- —
- Eligible?
- —
No personal income docs; deal must DSCR.
Hard money
10% down · 12.0% · 12mo
- Down + closing
- —
- Monthly P&I
- —
- Monthly cashflow
- —
- DSCR
- —
- Eligible?
- —
Short-term bridge; refi at stabilization.
Rent comps 38 comps
| Address | Beds | Baths | Sqft | Rent | $/sqft | DOM | Units | Dist |
|---|---|---|---|---|---|---|---|---|
| 2903 63rd St W Bradenton, FL | 1.0 | 1.0 | 693 | $2,000 | $2.89 | 5d | 1 | 0.05mi |
| 2926 63rd St W Bradenton, FL | 2.0 | 2.0 | 946 | $2,100 | $2.22 | 5d | 1 | 0.05mi |
| 5933 28th Ave W Bradenton, FL | 1.0–2.0 | 1.0–2.0 | 945 | $1,250 | $1.32 | 3d | 6 | 0.23mi |
| 5909 30th Ave W Bradenton, FL | 1.0–2.0 | 1.0–2.0 | 788 | $1,465 | $1.86 | 3d | 6 | 0.27mi |
| 6304 Pointe West Blvd Unit A309 Bradenton, FL | 2.0 | 2.0 | 1042 | $1,795 | $1.72 | 12d | 1 | 0.35mi |
| 6415 21st Ave W Bradenton, FL | 1.0–2.0 | 1.0–2.0 | 1150 | $1,499 | $1.30 | 5d | 5 | 0.40mi |
| 5907 36th Ave Cir W #5907 Bradenton, FL | 2.0 | 2.0 | 937 | $2,800 | $2.99 | 25d | 1 | 0.52mi |
| 2724 72nd St W Unit 2010 Bradenton, FL | 2.0 | 2.0 | 942 | $1,950 | $2.07 | 4d | 1 | 0.57mi |
| 4116 62nd St W Bradenton, FL | 2.0 | 2.0 | 840 | $1,650 | $1.96 | 5d | 1 | 0.69mi |
| 2727 75th St W Bradenton, FL | 1.0–2.0 | 1.5 | 835 | $1,550 | $1.86 | 5d | 4 | 0.70mi |
| 4112 66th Street Cir W Bradenton, FL | 2.0 | 2.0 | 1100 | $1,960 | $1.78 | 21d | 1 | 0.73mi |
| 4118 59th St W Bradenton, FL | 2.0 | 1.0 | 756 | $1,800 | $2.38 | 17d | 1 | 0.74mi |
| 4161 66th Street Cir W Bradenton, FL | 2.0 | 2.0 | 1044 | $1,800 | $1.72 | 17d | 1 | 0.83mi |
| 4209 66th Street Cir W Bradenton, FL | 2.0 | 2.0 | 1044 | $2,900 | $2.78 | 25d | 1 | 0.83mi |
| 1403 56th St W #1403 Bradenton, FL | 1.0 | 1.0 | 812 | $1,595 | $1.96 | 25d | 1 | 0.99mi |
| 6711 45th Ave W Unit A Bradenton, FL | 2.0 | 2.0 | 1100 | $1,700 | $1.55 | 17d | 1 | 1.00mi |
| 1403 56th St W Bradenton, FL | 1.0 | 1.0 | 812 | $1,445 | $1.78 | 17d | 1 | 1.02mi |
| 4040 Ironwood Cir Unit 404F Bradenton, FL | 2.0 | 2.0 | 1008 | $1,750 | $1.74 | 13d | 1 | 1.05mi |
| 4040 Ironwood Cir Unit 406F Bradenton, FL | 2.0 | 2.0 | 1008 | $1,675 | $1.66 | 17d | 1 | 1.05mi |
| 4501 71st St W Bradenton, FL | 1.0–2.0 | 1.0–2.0 | 850 | $1,280 | $1.51 | 3d | 28 | 1.06mi |
| 4210 Ironwood Cir Unit 103J Bradenton, FL | 1.0 | 1.0 | 750 | $1,800 | $2.40 | 25d | 1 | 1.06mi |
| 4601 66th St W Bradenton, FL | 3.0 | 1.0–2.0 | 917 | $1,716 | $1.87 | 3d | 24 | 1.07mi |
| 2107 Palma Sola Blvd #8 Bradenton, FL | 2.0 | 2.0 | 1056 | $1,850 | $1.75 | 17d | 1 | 1.09mi |
| 4460 Ironwood Cir Unit 501A Bradenton, FL | 1.0 | 1.5 | 840 | $2,595 | $3.09 | 25d | 1 | 1.18mi |
| 4240 Ironwood Cir #404 Bradenton, FL | 2.0 | 2.0 | 1008 | $2,495 | $2.48 | 25d | 1 | 1.19mi |
| 4460 Ironwood Cir Unit 406 Bradenton, FL | 1.0 | 1.0 | 750 | $1,600 | $2.13 | 3d | 1 | 1.19mi |
| 4460 Ironwood Cir Unit 406 Bradenton, FL | 1.0 | 1.0 | 750 | $1,600 | $2.13 | 23d | 1 | 1.19mi |
| 4850 51st St W Bradenton, FL | 1.0–2.0 | 1.0–2.0 | 800 | $1,200 | $1.50 | 16d | 3 | 1.20mi |
| 4850 51st St W Bradenton, FL | 1.0–2.0 | 1.0–2.0 | 800 | $1,199 | $1.50 | 5d | 2 | 1.20mi |
| 4480 Ironwood Cir Unit 309 Bradenton, FL | 1.0 | 1.0 | 600 | $1,800 | $3.00 | 25d | 1 | 1.22mi |
| 4480 Ironwood Cir Unit 213A Bradenton, FL | 1.0 | 1.0 | 600 | $1,425 | $2.38 | 16d | 1 | 1.22mi |
| 4802 51st St W Bradenton, FL | 1.0–2.0 | 1.0–2.0 | 1007 | $1,249 | $1.24 | 17d | 15 | 1.25mi |
| 4802 51st St W Bradenton, FL | 1.0–2.0 | 1.0–2.0 | 1007 | $1,200 | $1.19 | 5d | 13 | 1.25mi |
| 4880 51st St W Bradenton, FL | 1.0–4.0 | 1.0–3.0 | 1019 | $1,295 | $1.27 | 5d | 11 | 1.27mi |
| 4550 47th St W Bradenton, FL | 1.0–3.0 | 1.0–2.0 | 930 | $1,330 | $1.43 | 3d | 27 | 1.40mi |
| 6102 7th Ave W Unit 6102 Bradenton, FL | 2.0 | 2.0 | 1050 | $2,600 | $2.48 | 25d | 1 | 1.44mi |
| 6318 7th Ave W Unit None Bradenton, FL | 2.0 | 2.0 | 1025 | $2,000 | $1.95 | 25d | 1 | 1.44mi |
| 6318 7th Ave W Bradenton, FL | 2.0 | 2.0 | 1025 | $1,800 | $1.76 | 25d | 1 | 1.44mi |
HOA detail condo
- Monthly dues
- $560 · $6,720/yr
- Likely covers
- parking
- Assessments
- None detected in remarks — confirm with the listing agent.
Listing history 25 events
-
2026-06-22days on market $149,999 Active 48 DOM
-
2026-06-18days on market $149,999 Active 45 DOM
-
2026-06-17days on market $149,999 Active 44 DOM
-
2026-06-16days on market $149,999 Active 43 DOM
-
2026-06-15days on market $149,999 Active 42 DOM
-
2026-06-13days on market $149,999 Active 40 DOM
-
2026-06-13days on market $149,999 Active 39 DOM
-
2026-06-10days on market $149,999 Active 37 DOM
-
2026-06-09days on market $149,999 Active 36 DOM
-
2026-06-08days on market $149,999 Active 35 DOM
-
2026-06-08days on market $149,999 Active 34 DOM
-
2026-06-03days on market $149,999 Active 30 DOM
-
2026-06-02days on market $149,999 Active 29 DOM
-
2026-06-01days on market $149,999 Active 28 DOM
-
2026-05-31days on market $149,999 Active 27 DOM
-
2026-05-04$149,999 Active
-
2025-06-27historical
-
2025-05-27price $169,000
-
2025-04-09price $179,000
-
2025-02-17price $199,000
-
2025-02-06$224,900 Active
-
2013-10-01soldstatus $46,500
-
2001-08-03soldstatus $58,000
-
1997-02-20soldstatus $47,500
-
1992-01-16soldstatus $46,500
ⓘ Source: listings_history table (triggers on properties + properties_extension) + one-shot
backfill from property_details.listing_events for pre-trigger history.
Tax reassessment forecast FL · Resets to sale price
- Current annual tax
- $609 · $51/mo
- Projected year-2 tax
- $1,245 · $104/mo
- Expected delta
- +$636/yr (+$53/mo · 104.6%)
ⓘ Screening estimate from a state-policy table — verify with the county assessor before closing.
Climate risk First Street
- Flood 1/10 Low FEMA zone X (unshaded) · 0% chance over 30 yrs
- Wildfire 1/10 Low
- Heat 10/10 Extreme 7 d/yr ≥106°F today · 29 d/yr by 30 yrs out
- Wind 10/10 Extreme 99% chance of damaging wind over 30 yrs
- Air quality 3/10 Moderate 2 unhealthy d/yr today · 2 by 30 yrs out
Nearby sold comps map
Loading sold comps map…
Walkable amenities ~0.75 mi
Loading nearby amenities…
Taxation est. · year 1
- Rental income
- $21,602
- − Mortgage interest
- −$8,402
- − Property taxes
- −$609
- − Insurance
- −$750
- − Repairs & maintenance
- −$1,728
- − Management
- −$1,728
- − HOA
- −$6,720
- − Depreciation
- −$4,364
- Taxable loss
- −$2,698
- Est. tax savings @ 24.0%
- +$648
- After-tax cash flow
- $196/yr
For passive investors: Depreciation is non-cash, so a rental often shows a tax loss while cash-flowing — sheltering income. Rental losses are passive: they offset passive income freely, and up to $25,000/yr can offset ordinary (W-2) income if you actively participate and your MAGI is under $100k (phasing out to $0 by $150k); unused losses carry forward. On sale, claimed depreciation is recaptured at up to 25%, and gains may owe capital-gains tax (a 1031 exchange can defer both). Figures are a year-1 estimate at your 24.0% rate — not tax advice; consult a CPA.
Schools (NCES district)
- District
- Manatee
- NCES district ID
- 1201230
- Math proficiency
- 54% ▼ -6.00%
- Reading proficiency
- 50% ▼ -2.00%
- Median HH income
- $49,607
- Composite
- 44.43/100
- National rank
- #2806
- State rank
- #26 of 73 in FL
Livability — Bradenton
- Score
- 81/100
- State rank
- #101
- US rank
- #1528
Category grades
Schools grade is shown separately in the Schools card above.
Census & demographics
- Census place
- Bradenton, FL
- County
- Manatee County · 416,364 people
- City population
- 227,091
- Metro
- North Port-Sarasota-Bradenton, FL
- Population (ZIP)
- 33,224
- Household income
- $81,728
- Rent vs Own
- Severe rent burden
- 1126.0
Population outlook (Manatee County) Hauer SSP2
- Today (2025)
- 447,342 people
- By 2030
- 488,911 · +9.3%
- By 2040
- 567,934 · +27.0%
- By 2050
- 637,995 · +42.6%
- By 2075
- 781,970 · +74.8%
- By 2100
- 848,272 · +89.6%
Race, ethnicity, and origin ACS 2023
- Neighborhood character
- Predominantly White (84%)
- Race & ethnicity
- White 84% Hispanic / Latino 11% Two or more races 6% Black 2% Asian 1%
- Hispanic origin (detail)
- Puerto Rican 4% Cuban 3%
- Common ancestry
- Romanian 3% Slovak 3% Lithuanian 3%
- Foreign-born
- 9% · Canada, Jamaica, China
- Languages at home
- 90% English-only · Spanish 6% Russian/Polish/Slavic 1% Other Indo-European 1%
Political lean MEDSL · Manatee
- 2024 margin
- Strong R (+23.5) · D 37.9% · R 61.4%
- 2008→2024 swing
- -16.5pp toward R · 2008: -7.0pp · 2024: -23.5pp
- All cycles
- 2024: R+23.5 2020: R+16.1 2016: R+17.1 2012: R+12.5 2008: R+7.0
Not yet ingested
- Civics
- —
Market trends
- HPI YoY
- ▼ -360.34%
- Current HPI
- 320.0061
- Rent YoY
- ▼ -0.30%
- Metro
- North Port-Sarasota-Bradenton, FL
- State GDP YoY
- ▲ 3.28%
- F500 in state
- 36
Industry mix (Fortune 500 HQ in FL)
| Industry | F500 HQs | Revenue |
|---|---|---|
| Industrial Technology | 2 | $29B |
|
||
| Insurance | 2 | $17B |
|
||
| Retail | 1 | $60B |
|
||
| Technology Distribution | 1 | $58B |
|
||
| Homebuilding | 1 | $35B |
|
||
| Technology Manufacturing | 1 | $35B |
|
||
Price history
+222.6% since first listed10 events — show timeline
- 2026-05-04 Listed $149,999 Stellar MLS as Distributed by MLS Grid
- 2025-06-27 Listing Removed — Stellar MLS as Distributed by MLS Grid
- 2025-05-27 Price Changed $169,000 Stellar MLS as Distributed by MLS Grid
- 2025-04-09 Price Changed $179,000 Stellar MLS as Distributed by MLS Grid
- 2025-02-17 Price Changed $199,000 Stellar MLS as Distributed by MLS Grid
- 2025-02-06 Listed $224,900 Stellar MLS as Distributed by MLS Grid
- 2013-10-01 Sold (Public Records) $46,500 Public Records
- 2001-08-03 Sold (Public Records) $58,000 Public Records
- 1997-02-20 Sold (Public Records) $47,500 Public Records
- 1992-01-16 Sold (Public Records) $46,500 Public Records
Property tax history
-3.7%/yrLatest (2025): $609 · +5.5% YoY. Source: county tax records.
Cash-flow waterfall
monthlySold comps — $/sqft
last 12 mo · ≤1 miLoading sold comps…