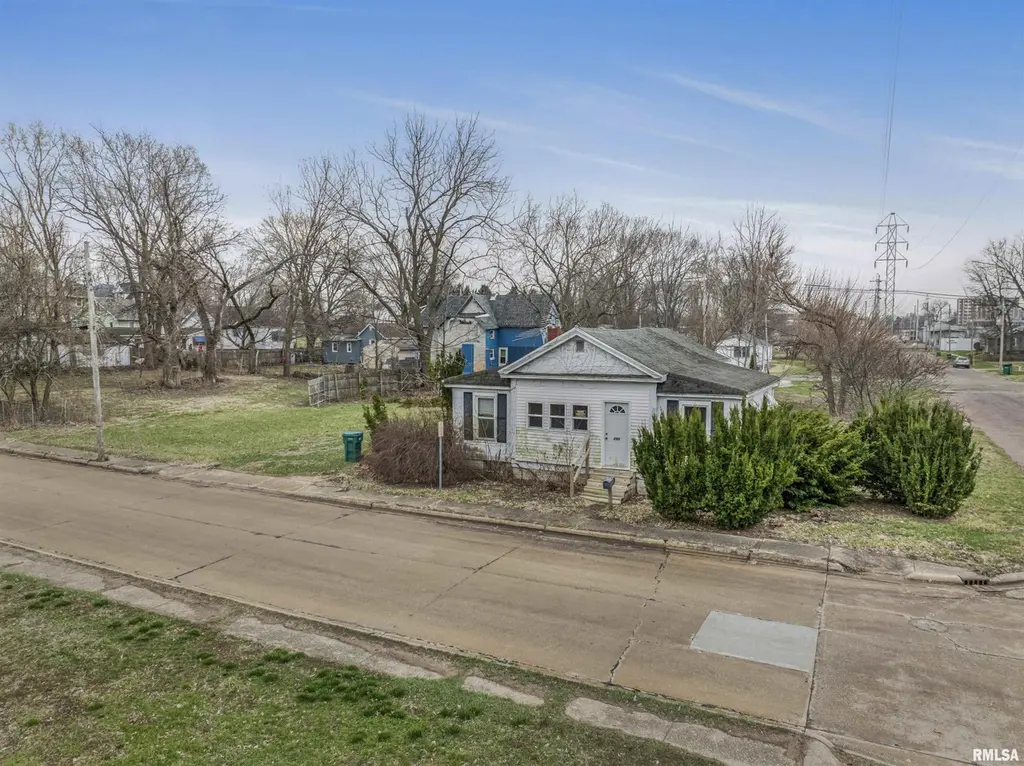
190 Laurel Ave · Galesburg, IL
Flood risk 7/10 · Major
- FEMA flood zone
- X (unshaded)
- Chance of flooding over 30 yrs
- 0.77%
- Est. flood insurance / yr
- $473 – $860
Fire risk 1/10 · Minimal
- Est. fire insurance / yr
- $804 – $1,492
Heat risk 3/10 · Minor
- Hot days now (above 104°F)
- 7 days/yr
- Hot days in 30 yrs
- 17 days/yr
Wind risk 2/10 · Minimal
- Chance of severe wind over 30 yrs
- 1.0%
Air-quality risk 3/10 · Minor
- Unhealthy air days now
- 2 days/yr
- Unhealthy air days in 30 yrs
- 3 days/yr
Risk factors via First Street. Map © Google.
Why this score? — see what drove the B grade
The composite is a weighted blend of 9 inputs, each scored 0–100. Each bar is that input's sub-score; the figure is the points it added to the 100-point composite (weight × sub-score).
- Cash flow +30.0/30.0
- ARV discount +15.0/15.0
- 1% rule +10.0/10.0
- DSCR +10.0/10.0
- Livability +3.5/5.0
- Rent growth +2.5/5.0
- Condition / age +2.5/5.0
- Schools +1.4/10.0
- Appreciation +0.0/10.0
$49,900
🖨 Deal sheet 📄 Offer letter ✓ Due diligence
Listing remarks MLS
Don't let the word "fixer-upper" fool you — most of the hard work is already done. This 3-bedroom, 1-bathroom home offers an incredible opportunity for owner-occupants and investors alike, with all the major systems already updated, 4 additional lots for over 1/3 of an acre, and priced under $50K! New electrical, plumbing, furnace, water heater, replacement windows, and interior and exterior doors mean you can focus your time and money on the fun stuff - finishes, paint, and making it your own. And the original hardwood floors are already there, adding instant character and charm throughout. Outside, you'll love the oversized double lot - plenty of room to enjoy, entertain, garden, or simply spread out. Outdoor space like this is hard to find at this price point. Whether you're looking for a primary residence with built-in equity potential or your next investment project, this one checks the boxes. Sweat equity opportunities like this don't last long - schedule your showing today.
Key facts
- 0.25 acre lot
- Built 1896
- Listed 63 days
Neighborhood map
What this means for you Summary
Snapshot
- This is a 3-bed/1.0-bath other listed at $50k.
Deal economics
- At list price, monthly cash flow is $478 ($6k/yr) — positive.
- The deal already cash-flows at list — no discount required.
- Meets the 1% rule at list price ($1k rent vs $50k).
- Recommended offer: $47k (6.0% below list) — sets the bar for market timing.
- Cap rate 19.1% vs local median 6.4% in Galesburg — top-decile yield for the area; either an underpriced asset or a hidden risk that comps aren't pricing in. Stress-test before assuming the spread holds.
Location & tenants
- Location reads 70/100 on livability (#367 in IL) — a middle-class / working-renter tenant base. Strengths: cost of living A+, housing A+, health & safety A+; Watch: schools F, crime F, commute F.
- Galesburg CUSD 205 (town): math 13% / reading 22% proficiency, ranked #488 of 620 in IL (top 79%) — low school quality limits family demand, transient renter base, plan for 1-2y turnover.
- Market conditions: 191 active listings in the ZIP.
Forward outlook
- Local home prices are declining (-3.0%/yr); year-one equity from $345 of loan paydown is wiped out by about $1k of value loss. Plan a longer hold.
- Knox County population projected at -19% by 2050 — secular population decline; favor cash flow + early exit over multi-decade hold.
- At projected returns (-3.0% appreciation + 3.0% rent growth), your $14k cash investment doubles in ~3 years — after that, you're playing with house money.
Negotiation context
- It's been on market 64 days — a 6% lower offer ($47k) is reasonable based on typical stale-listing flexibility.
- 2 sale attempts since 24y ago with the ask held roughly flat each time — persistent listings suggest the price (not the market) is what's stuck; bring a comps-based counter.
- Current owner paid $14k; list at $50k implies a 256% gain — meaningful room to come down on a strong offer.
Risks & watch-outs
- Watch-outs: flood insurance adds $56/mo; built in 1896 — expect roof / HVAC / electrical / plumbing capex.
- Climate carrying-cost: major flood risk — expect insurance premiums to compound above CPI over the hold.
Questions for the listing agent
- It's been on market 64 days. Have you received any prior offers? Is the seller open to a 6% concession, seller financing, or rate buy-down credit?
- Built in 1896 — when were the roof, HVAC, electrical panel, plumbing, and water heater last replaced?
- What's the actual annual flood-insurance premium (NFIP or private), and is the property in a SFHA with mandatory coverage?
- Why hasn't it sold? Are there any deal-killer items the seller is aware of (foundation, flood, title, zoning, code violations)?
- Is there a deadline driving the sale (1031 exchange, divorce, estate, relocation)? That informs how much negotiation room exists.
- Schools are F-rated, which usually means shorter tenancies and higher turnover. Who's the typical renter profile here, and what's been the actual vacancy rate?
- Crime grade is F in this area — have there been break-ins, vandalism, or insurance claims at this property in the last 3 years? What carrier currently insures it and at what premium?
- What's the average days-on-market for RENTAL listings here right now (not sales)? A rising rental-DOM trend means longer vacancies and softer asking-rent achievability than the comps imply.
- What's the recent tenant-quality profile in this submarket — average credit score on applications, eviction rate, late-payment / NSF rate, and stable-employment percentage? A property-management company in the area should have these aggregated.
- How much new for-sale + rental construction is in the pipeline within 1–3 miles? Heavy new supply typically softens prices + rents 12–24 months out; constrained supply supports both.
Investment metrics
- 1% rule
- 2.17% ✓
- Cap rate
- 19.13%
- Cash-on-cash
- 45.85%
- DSCR
- 3.04
- GRM
- 3.8
CMA / ARV
- ARV (median comp)
- $68,225
- List price
- $49,900
- Delta
- -26.86%
- Verdict
- UNDERPRICED
- Comps
- 20 within 1.0 mi
Projected returns pro-forma
-3.0% appreciation · 3.0% rent growth · sell at horizon
- IRR
- 37.6%
- Equity multiple
- 2.60×
- Total profit
- $22,415
- Equity at exit
- $7,440
- IRR
- 44.2%
- Equity multiple
- 5.21×
- Total profit
- $58,891
- Equity at exit
- $4,314
Cash invested: $13,972 (down + closing). Projections, not guarantees.
Landlord ↔ Tenant lean methodology
- Overall (STATE)
- 43 Moderately Tenant-Leaning
- State Illinois
- 43 Moderately Tenant-Leaning · D+7
- County
- — inherits STATE
- City
- — inherits STATE
ZIP-level market 61401
- Active inventory
- 191
- Price-to-rent
- 3.8×
Monthly cashflow live
- Estimated rent
- $1,081 medium interval (Pro) →
- Mortgage (P&I)
- −$262
- Tax from tax record
- −$37 /mo · $447/yr
- Insurance
- −$21
- Flood insurance flood zone
- −$56 /mo · $666/yr
- HOA
- −$0
- Vacancy / Maint / Mgmt
- −$227
- Net cashflow
- $478
Break-even live
UW: 25.0% down · 7.5% · 30yr · 1.5% tax · 5.0% vac · 8.0% maint · 8.0% mgmt
Financing live
Cash to close
- Down payment
- $12,475
- Closing costs
- $1,497
- Reserves months
- —
- Total cash needed
- —
Loan-product check · same deal, 3 products live
Conventional
25% down · 7.5% · 30yr
- Down + closing
- —
- Monthly P&I
- —
- Monthly cashflow
- —
- DSCR
- —
- Eligible?
- —
Personal DTI + credit; lowest rate.
DSCR
20% down · 8.5% · 30yr
- Down + closing
- —
- Monthly P&I
- —
- Monthly cashflow
- —
- DSCR
- —
- Eligible?
- —
No personal income docs; deal must DSCR.
Hard money
10% down · 12.0% · 12mo
- Down + closing
- —
- Monthly P&I
- —
- Monthly cashflow
- —
- DSCR
- —
- Eligible?
- —
Short-term bridge; refi at stabilization.
Listing history 11 events
-
2026-06-18days on market $49,900 Active 64 DOM
-
2026-06-17days on market $49,900 Active 63 DOM
-
2026-06-16days on market $49,900 Active 62 DOM
-
2026-06-16status $49,900 Active 61 DOM
-
2026-05-31statusdays on market $49,900 Pending 61 DOM
-
2026-03-30$49,900 Active 1013-char remark
Show marketing remark (1013 chars)
Don't let the word "fixer-upper" fool you — most of the hard work is already done. This 3-bedroom, 1-bathroom home offers an incredible opportunity for owner-occupants and investors alike, with all the major systems already updated, 4 additional lots for over 1/3 of an acre, and priced under $50K! New electrical, plumbing, furnace, water heater, replacement windows, and interior and exterior doors mean you can focus your time and money on the fun stuff - finishes, paint, and making it your own. And the original hardwood floors are already there, adding instant character and charm throughout. Outside, you'll love the oversized double lot - plenty of room to enjoy, entertain, garden, or simply spread out. Outdoor space like this is hard to find at this price point. Whether you're looking for a primary residence with built-in equity potential or your next investment project, this one checks the boxes. Sweat equity opportunities like this don't last long - schedule your showing today.
-
2025-12-17historical
-
2021-09-15soldstatus $14,000
-
2021-08-06historical
-
2002-06-17soldstatus $17,900
-
2002-05-11$19,900
ⓘ Source: listings_history table (triggers on properties + properties_extension) + one-shot
backfill from property_details.listing_events for pre-trigger history.
Tax reassessment forecast IL · Partial reset (capped growth)
- Current annual tax
- $447 · $37/mo
- Projected year-2 tax
- $790 · $66/mo
- Expected delta
- +$343/yr (+$29/mo · 76.6%)
ⓘ Screening estimate from a state-policy table — verify with the county assessor before closing.
Climate risk First Street
- Flood 7/10 Severe FEMA zone X (unshaded) · 77% chance over 30 yrs
- Wildfire 1/10 Low
- Heat 3/10 Moderate 7 d/yr ≥104°F today · 17 d/yr by 30 yrs out
- Wind 2/10 Low 100% chance of damaging wind over 30 yrs
- Air quality 3/10 Moderate 2 unhealthy d/yr today · 3 by 30 yrs out
Nearby sold comps map
Loading sold comps map…
Walkable amenities ~0.75 mi
Loading nearby amenities…
Taxation est. · year 1
- Rental income
- $12,966
- − Mortgage interest
- −$2,795
- − Property taxes
- −$447
- − Insurance
- −$916
- − Repairs & maintenance
- −$1,037
- − Management
- −$1,037
- − Depreciation
- −$1,452
- Taxable income
- $5,282
- Est. tax owed @ 24.0%
- −$1,268
- After-tax cash flow
- $4,472/yr
For passive investors: Depreciation is non-cash, so a rental often shows a tax loss while cash-flowing — sheltering income. Rental losses are passive: they offset passive income freely, and up to $25,000/yr can offset ordinary (W-2) income if you actively participate and your MAGI is under $100k (phasing out to $0 by $150k); unused losses carry forward. On sale, claimed depreciation is recaptured at up to 25%, and gains may owe capital-gains tax (a 1031 exchange can defer both). Figures are a year-1 estimate at your 24.0% rate — not tax advice; consult a CPA.
Schools (NCES district)
- District
- Galesburg CUSD 205
- NCES district ID
- 1716080
- Math proficiency
- 13% ▼ -8.00%
- Reading proficiency
- 22% ▼ -11.00%
- Median HH income
- $35,901
- Composite
- 14.46/100
- National rank
- #9427
- State rank
- #488 of 620 in IL
Livability — Galesburg
- Score
- 70/100
- State rank
- #367
- US rank
- #7601
Category grades
Schools grade is shown separately in the Schools card above.
Census & demographics
- Census place
- Galesburg, IL
- City population
- 32,318
- Population (ZIP)
- 30,684
Population outlook (Knox County) Hauer SSP2
- Today (2025)
- 48,224 people
- By 2030
- 46,333 · -3.9%
- By 2040
- 42,424 · -12.0%
- By 2050
- 38,929 · -19.3%
- By 2075
- 31,523 · -34.6%
- By 2100
- 24,092 · -50.0%
Race, ethnicity, and origin ACS 2023
- Neighborhood character
- Predominantly White (77%)
- Race & ethnicity
- White 77% Black 8% Hispanic / Latino 8% Two or more races 8% Asian 1%
- Hispanic origin (detail)
- Mexican 6%
- Common ancestry
- Italian 2% Serbian 1% Slovak 1%
- Foreign-born
- 4% · Canada, Vietnam
- Languages at home
- 92% English-only · Spanish 5% French/Haitian/Cajun 1% Other Indo-European 1%
Political lean MEDSL · Knox
- 2024 margin
- Lean R (+9.4) · D 44.4% · R 53.7% · Other 1.9%
- 2008→2024 swing
- -29.3pp toward R · 2008: 19.9pp · 2024: -9.4pp
- All cycles
- 2024: R+9.4 2020: R+5.6 2016: R+3.3 2012: D+17.1 2008: D+19.9
Not yet ingested
- Civics
- —
Market trends
- HPI YoY
- ▼ -95.48%
- Current HPI
- 157.276
- Rent YoY
- —
- Metro
- —
- State GDP YoY
- ▲ 1.59%
- F500 in state
- 60
Industry mix (Fortune 500 HQ in IL)
| Industry | F500 HQs | Revenue |
|---|---|---|
| Insurance | 4 | $201B |
|
||
| Consumer Goods | 4 | $87B |
|
||
| Industrial Machinery | 3 | $64B |
|
||
| Healthcare | 2 | $55B |
|
||
| Retail / Pharmacy | 1 | $148B |
|
||
| Agriculture / Food | 1 | $86B |
|
||
Price history
+150.8% since first listed6 events — show timeline
- 2026-03-30 Listed $49,900 RMLSA as Distributed by MLS Grid
- 2025-12-17 Listing Removed — MRED as Distributed by MLS Grid
- 2021-09-15 Sold (Public Records) $14,000 Public Records
- 2021-08-06 Listing Removed — RMLSA as Distributed by MLS Grid
- 2002-06-17 Sold (MLS) $17,900 RMLSA as Distributed by MLS Grid
- 2002-05-11 Listed $19,900 RMLSA as Distributed by MLS Grid
Property tax history
+27.5%/yrLatest (2024): $447 · +0.9% YoY. Source: county tax records.
Cash-flow waterfall
monthlySold comps — $/sqft
last 12 mo · ≤1 miLoading sold comps…