5707 45th St E #281 · Samoset, FL
Flood risk 4/10 · Minor
- FEMA flood zone
- X (unshaded)
- Chance of flooding over 30 yrs
- 0.22%
- Est. flood insurance / yr
- $507 – $1,088
Fire risk 1/10 · Minimal
- Est. fire insurance / yr
- $947 – $1,759
Heat risk 10/10 · Severe
- Hot days now (above 107°F)
- 7 days/yr
- Hot days in 30 yrs
- 29 days/yr
Wind risk 10/10 · Severe
- Chance of severe wind over 30 yrs
- 99.0%
Air-quality risk 2/10 · Minimal
- Unhealthy air days now
- 1 days/yr
- Unhealthy air days in 30 yrs
- 1 days/yr
Risk factors via First Street. Map © Google.
Why this score? — see what drove the D+ grade
The composite is a weighted blend of 9 inputs, each scored 0–100. Each bar is that input's sub-score; the figure is the points it added to the 100-point composite (weight × sub-score).
- Cash flow +19.9/30.0
- 1% rule +6.7/10.0
- DSCR +6.3/10.0
- Schools +4.4/10.0
- Livability +3.2/5.0
- Condition / age +2.5/5.0
- Rent growth +2.3/5.0
- ARV discount +0.0/15.0
- Appreciation +0.0/10.0
$177,900
🖨 Deal sheet 📄 Offer letter ✓ Due diligence
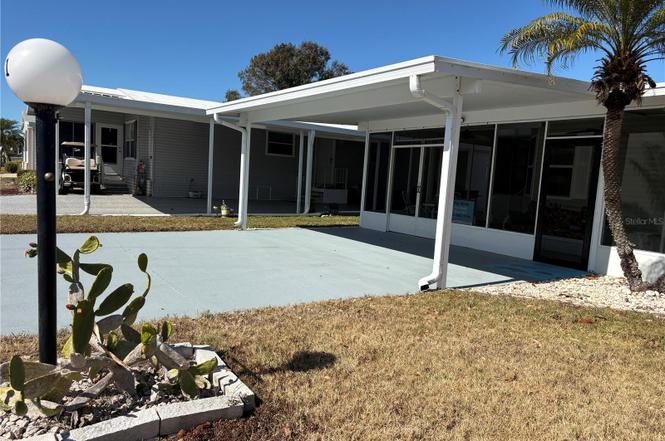
Listing remarks
Light and Bright 2/Bed, 2 Bath home in the beautiful Gold Tree community. Living Room, Kitchen and Dinette are an open floor plan. This home offers inside washer & dryer, master bedroom with ensuite bathroom, (both bathrooms have walk-in showers). Relax in the lanai or the very large, screened area at the front of the home. Gold Tree is a gated community (gates closed from 6pm to 6am) and it provides a locked storage yard for your RV's, boats & trailers. The community is very well run with an office on site. Your $292 monthly fee covers Cable, internet, water and weekly lawn service. There are lots of activities which are published in the monthly Newsletter Calendar or the board
Key facts
- Gated community
- Open floor plan
- Near shoppes
Tags
Property features AI
Finance
- Other: Directions: East on 57th St between Lockwood Ridge and 53rd Ave E; through entrance. Address on GPS will be 281 Imperial Place.
- Financial info: Total annual association fees approximately $3,504; Lease restrictions apply; Property is part of a senior community; Pets allowed (cats and dogs); Partially furnished
- HOA & community: Has HOA (Rene Crewell) — monthly fee $292; Association amenities: pool, tennis courts, pickleball courts, clubhouse, owned recreational facilities; Association fee includes: cable TV, internet, pool, sewer, water, trash, management, maintenance of grounds, common area taxes, escrow reserves
Exterior
- Parking: Carport (2 spaces)
- Utilities: Public water; Public sewer; Cable connected; BB/HS internet available; Electricity connected; Water connected; Sewer connected
- Home design: Residential manufactured home (double wide); One story; Faces south; Open crawlspace foundation
- Construction: Vinyl siding with frame construction; Shingle roof; Built as a manufactured double wide
- Exterior features: Storage
Interior
- Kitchen: Range; Refrigerator; Disposal
- Bedrooms: 2 bedrooms
- Flooring: Carpet; Laminate
- Bathrooms: 2 full bathrooms
- Heating & cooling: Central heating (electric); Central air conditioning
- Interior features: Ceiling fans; Open floor plan; Window treatments; 6 total rooms
- Laundry & utility: Laundry closet; Washer; Dryer
Neighborhood map
What this means for you Summary
Snapshot
- This is a 2-bed/2.0-bath manufactured listed at $178k.
Deal economics
- At list price, monthly cash flow is $215 ($3k/yr) — positive.
- The deal already cash-flows at list — no discount required.
- Meets the 1% rule at list price ($2k rent vs $178k).
- Recommended offer: $157k (12.0% below list) — sets the bar for market timing.
- Cap rate 7.7% vs local median 4.3% in Samoset — top-decile yield for the area; either an underpriced asset or a hidden risk that comps aren't pricing in. Stress-test before assuming the spread holds.
Location & tenants
- Location reads 65/100 on livability (#645 in FL) — a middle-class / working-renter tenant base. Strengths: cost of living A+, housing A+, health & safety A+; Watch: schools D+, amenities F, commute F.
- Manatee (suburban): math 54% / reading 50% proficiency, ranked #26 of 73 in FL (top 36%) — acceptable for families but not a draw, mixed tenant base, ~2y average lease.
- Market conditions: Rents soft (-1.0%/yr); 384 active listings in the ZIP; 19 comparable units currently listed for rent nearby; rentals at typical pace (median 24d on market — plan ~3-4 weeks tenant-placement turnaround); 7,472 units permitted in Manatee County in 2024 (1,782 in 5+ unit buildings).
- This rent runs 35% of the median local income ($71k/yr) — at the standard rent-burdened threshold; future hikes will face affordability resistance.
Forward outlook
- Local home prices are declining (-3.0%/yr); year-one equity from $1k of loan paydown is wiped out by about $5k of value loss. Plan a longer hold.
- Manatee County population projected at +43% by 2050 — long-run rental-demand tailwind backs the buy-and-hold thesis.
Negotiation context
- It's been on market 144 days — a 12% lower offer ($157k) is reasonable based on typical stale-listing flexibility.
- Current owner paid $90k; list at $178k implies a 98% gain — meaningful room to come down on a strong offer.
Risks & watch-outs
- Climate carrying-cost: severe wind risk, 99% chance of damaging wind over 30y; extreme-heat days projected 7→29/yr by 2055 (HVAC capex compounding) — expect insurance premiums to compound above CPI over the hold.
Questions for the listing agent
- It's been on market 144 days. Have you received any prior offers? Is the seller open to a 12% concession, seller financing, or rate buy-down credit?
- What does the HOA fee cover, when was the last increase, and are there any pending special assessments or reserve-fund shortfalls?
- Why hasn't it sold? Are there any deal-killer items the seller is aware of (foundation, flood, title, zoning, code violations)?
- Is there a deadline driving the sale (1031 exchange, divorce, estate, relocation)? That informs how much negotiation room exists.
- Schools are D-rated, which usually means shorter tenancies and higher turnover. Who's the typical renter profile here, and what's been the actual vacancy rate?
- The area grade is low — what's the realistic commute time and amenity access for the typical tenant pool here? Any planned neighborhood developments (good or bad) we should know about?
- What's the average days-on-market for RENTAL listings here right now (not sales)? A rising rental-DOM trend means longer vacancies and softer asking-rent achievability than the comps imply.
- What's the recent tenant-quality profile in this submarket — average credit score on applications, eviction rate, late-payment / NSF rate, and stable-employment percentage? A property-management company in the area should have these aggregated.
- How much new for-sale + rental construction is in the pipeline within 1–3 miles? Heavy new supply typically softens prices + rents 12–24 months out; constrained supply supports both.
Investment metrics
- 1% rule
- 1.17% ✓
- Cap rate
- 7.74%
- Cash-on-cash
- 5.18%
- DSCR
- 1.23
- GRM
- 7.1
CMA / ARV
- ARV (on-the-fly)
- $144,960
- Comps found
- 12
Show comp detail 12 sales within ~0.75 mi
| Address | Dist | Beds/Ba | Sqft | Sold | Price | $/sf | Match |
|---|---|---|---|---|---|---|---|
| 5707 45th St E #35 | 0.00mi | 2/2.0 | 912 (-5%) | 4mo | $160,000 | $175 | 89 |
| 5707 45th St E #158 | 0.00mi | 2/2.0 | 1,042 (+8%) | 3mo | $170,000 | $163 | 84 |
| 5316 53rd Ave E Unit Q5 | 0.50mi | 2/2.0 | 960 (0%) | 4mo | $105,000 | $109 | 73 |
| 5707 45th St E #136 | 0.00mi | 2/2.0 | 1,100 (+15%) | 6mo | $150,000 | $136 | 71 |
| 5316 53rd Ave E Unit N9 | 0.43mi | 2/2.0 | 1,056 (+10%) | 3mo | $160,000 | $152 | 61 |
| 5316 53rd Ave E Unit L1 | 0.48mi | 2/2.0 | 1,056 (+10%) | 5mo | $175,000 | $166 | 57 |
| 5316 53rd Ave E Unit Q18 | 0.50mi | 2/2.0 | 864 (-10%) | 5mo | $139,900 | $162 | 56 |
| 5316 53rd Ave E Unit K14 | 0.52mi | 2/2.0 | 1,056 (+10%) | 6mo | $140,000 | $133 | 54 |
| 5316 53rd Ave E Unit F38 | 0.66mi | 2/1.5 | 896 (-7%) | 2mo | $100,500 | $112 | 54 |
| 5316 53rd Ave E Unit F17 | 0.70mi | 2/2.0 | 896 (-7%) | 10mo | $135,000 | $151 | 48 |
| 5316 53rd Ave E Unit F24 | 0.71mi | 2/2.0 | 1,056 (+10%) | 9mo | $60,000 | $57 | 43 |
| 5316 53rd Ave E Unit F41 | 0.62mi | 2/2.0 | 1,104 (+15%) | 10mo | $120,000 | $109 | 38 |
Match score weights: distance 35% · size 25% · config 20% · recency 20%. Top-matched comps best support the ARV.
Projected returns pro-forma
-3.0% appreciation · 0.0% rent growth · sell at horizon
- IRR
- -12.1%
- Equity multiple
- 0.58×
- Total profit
- $-21,106
- Equity at exit
- $26,525
- IRR
- -9.1%
- Equity multiple
- 0.52×
- Total profit
- $-23,775
- Equity at exit
- $15,382
Cash invested: $49,812 (down + closing). Projections, not guarantees.
Landlord ↔ Tenant lean methodology
- Overall (STATE)
- 87 Strongly Landlord-Friendly
- State Florida
- 87 Strongly Landlord-Friendly · R+3
- County
- — inherits STATE
- City
- — inherits STATE
ZIP-level market 34203
- Home prices YoY
- -24.5%
- Rents YoY
- -1.0%
- Active inventory
- 384
- Price-to-rent
- 7.1×
Monthly cashflow live
- Estimated rent
- $2,089 high interval (Pro) →
- Mortgage (P&I)
- −$933
- Tax from tax record
- −$136 /mo · $1,638/yr
- Insurance
- −$74
- HOA
- −$292
- Vacancy / Maint / Mgmt
- −$439
- Net cashflow
- $215
Break-even live
UW: 25.0% down · 7.5% · 30yr · 1.5% tax · 5.0% vac · 8.0% maint · 8.0% mgmt
Financing live
Cash to close
- Down payment
- $44,475
- Closing costs
- $5,337
- Reserves months
- —
- Total cash needed
- —
Loan-product check · same deal, 3 products live
Conventional
25% down · 7.5% · 30yr
- Down + closing
- —
- Monthly P&I
- —
- Monthly cashflow
- —
- DSCR
- —
- Eligible?
- —
Personal DTI + credit; lowest rate.
DSCR
20% down · 8.5% · 30yr
- Down + closing
- —
- Monthly P&I
- —
- Monthly cashflow
- —
- DSCR
- —
- Eligible?
- —
No personal income docs; deal must DSCR.
Hard money
10% down · 12.0% · 12mo
- Down + closing
- —
- Monthly P&I
- —
- Monthly cashflow
- —
- DSCR
- —
- Eligible?
- —
Short-term bridge; refi at stabilization.
Rent comps 19 comps
| Address | Beds | Baths | Sqft | Rent | $/sqft | DOM | Units | Dist |
|---|---|---|---|---|---|---|---|---|
| 5707 45th St E #19 Bradenton, FL | 2.0 | 2.0 | 972 | $1,700 | $1.75 | 23d | 1 | 0.03mi |
| 5616 Gentle Breeze St Bradenton, FL | 2.0 | 2.0 | 1100 | $1,700 | $1.55 | 23d | 1 | 0.38mi |
| 5316 53rd Ave E Unit Q111 Bradenton, FL | 2.0 | 2.0 | 1056 | $1,495 | $1.42 | 10d | 1 | 0.53mi |
| 4815 Woodbrook Dr Sarasota, FL | 2.0 | 2.0 | 1080 | $2,290 | $2.12 | 3d | 1 | 0.75mi |
| 5016 Misty Canal Pl Bradenton, FL | 2.0 | 2.5 | 1080 | $1,950 | $1.81 | 23d | 1 | 1.12mi |
| 5515 Fair Oaks St Unit 5515 Bradenton, FL | 2.0 | 2.0 | 1004 | $2,000 | $1.99 | 23d | 1 | 1.16mi |
| 4540 Runabout Way Bradenton, FL | 2.0 | 2.5 | 1080 | $2,300 | $2.13 | 23d | 1 | 1.16mi |
| 4665 Whitfield Ave Sarasota, FL | 1.0–3.0 | 1.0–2.0 | 1023 | $2,372 | $2.32 | 2d | 59 | 1.21mi |
| 6896 W Country Club Ln #148 Sarasota, FL | 2.0 | 2.0 | 1118 | $1,700 | $1.52 | 11d | 1 | 1.23mi |
| 7008 W Country Club Dr N Unit 136 Sarasota, FL | 2.0 | 2.0 | 1118 | $1,875 | $1.68 | 23d | 1 | 1.23mi |
| 3645 Ali ala LOOP Braden River, FL | 1.0 | 1.0 | 950 | $1,400 | $1.47 | 23d | 1 | 1.25mi |
| 5414 Fair Oaks St Unit 10-D Bradenton, FL | 2.0 | 2.0 | 1004 | $1,995 | $1.99 | 3d | 1 | 1.26mi |
| 6501 Stone River Rd Bradenton, FL | 2.0 | 2.0 | 1080 | $2,820 | $2.61 | 16d | 2 | 1.29mi |
| 6501 Stone River Rd Unit Available Bradenton, FL | 2.0 | 2.0 | 1118 | $2,200 | $1.97 | 23d | 1 | 1.29mi |
| 3880 Palm Isle Pl Bradenton, FL | 1.0–2.0 | 1.0–2.0 | 1042 | $2,499 | $2.40 | 1d | 13 | 1.30mi |
| 7050 W Country Club Dr N Unit 10-A Sarasota, FL | 2.0 | 2.0 | 1118 | $4,300 | $3.85 | 23d | 1 | 1.30mi |
| 7062 W Country Club Dr N #7062 Sarasota, FL | 1.0 | 1.5 | 954 | $3,000 | $3.14 | 23d | 1 | 1.33mi |
| 7461 W Country Club Dr N Sarasota, FL | 2.0 | 2.0 | 1153 | $2,275 | $1.97 | 3d | 4 | 1.34mi |
| 6505 Stone River Rd Bradenton, FL | 2.0 | 2.0 | 1080 | $2,825 | $2.62 | 16d | 3 | 1.38mi |
HOA detail
- Monthly dues
- $292 · $3,504/yr
- Likely covers
- waterinternetcablesecurity
Listing history 17 events
-
2026-06-18days on market $177,900 Active 144 DOM
-
2026-06-17days on market $177,900 Active 143 DOM
-
2026-06-16days on market $177,900 Active 142 DOM
-
2026-06-15days on market $177,900 Active 141 DOM
-
2026-06-13days on market $177,900 Active 139 DOM
-
2026-06-13days on market $177,900 Active 138 DOM
-
2026-06-10days on market $177,900 Active 136 DOM
-
2026-06-09days on market $177,900 Active 135 DOM
-
2026-06-08days on market $177,900 Active 134 DOM
-
2026-06-08days on market $177,900 Active 133 DOM
-
2026-06-03days on market $177,900 Active 129 DOM
-
2026-06-02days on market $177,900 Active 128 DOM
-
2026-06-01days on market $177,900 Active 127 DOM
-
2026-05-31days on market $177,900 Active 126 DOM
-
2026-01-25$177,900 Active
-
2007-12-15soldstatus $90,000
-
2003-05-09soldstatus $67,900
ⓘ Source: listings_history table (triggers on properties + properties_extension) + one-shot
backfill from property_details.listing_events for pre-trigger history.
Tax reassessment forecast FL · Resets to sale price
- Current annual tax
- $1,638 · $136/mo
- Projected year-2 tax
- $1,638 · $136/mo
- Expected delta
- $0/yr ($0/mo · -0.0%)
ⓘ Screening estimate from a state-policy table — verify with the county assessor before closing.
Climate risk First Street
- Flood 4/10 Moderate FEMA zone X (unshaded) · 22% chance over 30 yrs
- Wildfire 1/10 Low
- Heat 10/10 Extreme 7 d/yr ≥107°F today · 29 d/yr by 30 yrs out
- Wind 10/10 Extreme 99% chance of damaging wind over 30 yrs
- Air quality 2/10 Low 1 unhealthy d/yr today · 1 by 30 yrs out
Nearby sold comps map
Loading sold comps map…
Walkable amenities ~0.75 mi
Loading nearby amenities…
Taxation est. · year 1
- Rental income
- $25,069
- − Mortgage interest
- −$9,965
- − Property taxes
- −$1,638
- − Insurance
- −$890
- − Repairs & maintenance
- −$2,006
- − Management
- −$2,006
- − HOA
- −$3,504
- − Depreciation
- −$5,175
- Taxable loss
- −$113
- Est. tax savings @ 24.0%
- +$27
- After-tax cash flow
- $2,606/yr
For passive investors: Depreciation is non-cash, so a rental often shows a tax loss while cash-flowing — sheltering income. Rental losses are passive: they offset passive income freely, and up to $25,000/yr can offset ordinary (W-2) income if you actively participate and your MAGI is under $100k (phasing out to $0 by $150k); unused losses carry forward. On sale, claimed depreciation is recaptured at up to 25%, and gains may owe capital-gains tax (a 1031 exchange can defer both). Figures are a year-1 estimate at your 24.0% rate — not tax advice; consult a CPA.
Schools (NCES district)
- District
- Manatee
- NCES district ID
- 1201230
- Math proficiency
- 54% ▼ -6.00%
- Reading proficiency
- 50% ▼ -2.00%
- Median HH income
- $49,607
- Composite
- 44.43/100
- National rank
- #2806
- State rank
- #26 of 73 in FL
Livability — Samoset
- Score
- 65/100
- State rank
- #645
- US rank
- #12763
Category grades
Schools grade is shown separately in the Schools card above.
Census & demographics
- County
- Manatee County · 416,364 people
- Metro
- North Port-Sarasota-Bradenton, FL
- Population (ZIP)
- 40,618
- Household income
- $70,761
- Rent vs Own
- Severe rent burden
- 1469.0
Population outlook (Manatee County) Hauer SSP2
- Today (2025)
- 447,342 people
- By 2030
- 488,911 · +9.3%
- By 2040
- 567,934 · +27.0%
- By 2050
- 637,995 · +42.6%
- By 2075
- 781,970 · +74.8%
- By 2100
- 848,272 · +89.6%
Race, ethnicity, and origin ACS 2023
- Neighborhood character
- Predominantly White (65%)
- Race & ethnicity
- White 65% Hispanic / Latino 19% Two or more races 12% Black 9% Asian 5%
- Hispanic origin (detail)
- Mexican 9% Puerto Rican 3% Cuban 2% Dominican 1%
- Common ancestry
- Lithuanian 3% Romanian 3% Slovak 2%
- Foreign-born
- 17% · Canada, Vietnam, Dominican Republic
- Languages at home
- 76% English-only · Spanish 16% Vietnamese 2% Other Indo-European 1%
Political lean MEDSL · Manatee
- 2024 margin
- Strong R (+23.5) · D 37.9% · R 61.4%
- 2008→2024 swing
- -16.5pp toward R · 2008: -7.0pp · 2024: -23.5pp
- All cycles
- 2024: R+23.5 2020: R+16.1 2016: R+17.1 2012: R+12.5 2008: R+7.0
Not yet ingested
- Civics
- —
Market trends
- HPI YoY
- ▼ -95.87%
- Current HPI
- 295.8871
- Rent YoY
- ▼ -0.97%
- Metro
- North Port-Sarasota-Bradenton, FL
- State GDP YoY
- ▲ 3.28%
- F500 in state
- 36
Industry mix (Fortune 500 HQ in FL)
| Industry | F500 HQs | Revenue |
|---|---|---|
| Industrial Technology | 2 | $29B |
|
||
| Insurance | 2 | $17B |
|
||
| Retail | 1 | $60B |
|
||
| Technology Distribution | 1 | $58B |
|
||
| Homebuilding | 1 | $35B |
|
||
| Technology Manufacturing | 1 | $35B |
|
||
Price history
+162.0% since first listed3 events — show timeline
- 2026-01-25 Listed $177,900 Stellar MLS as Distributed by MLS Grid
- 2007-12-15 Sold (Public Records) $90,000 Public Records
- 2003-05-09 Sold (Public Records) $67,900 Public Records
Property tax history
+3.2%/yrLatest (2025): $1,638 · -2.9% YoY. Source: county tax records.
Cash-flow waterfall
monthlySold comps — $/sqft
last 12 mo · ≤1 miLoading sold comps…