3525 Gala Ave · Doolittle, TX
Flood risk 1/10 · Minimal
- FEMA flood zone
- X
- Chance of flooding over 30 yrs
- 0.0%
- Est. flood insurance / yr
- $507 – $1,088
Fire risk 8/10 · Major
- Est. fire insurance / yr
- $1,222 – $2,270
Heat risk 9/10 · Severe
- Hot days now (above 112°F)
- 7 days/yr
- Hot days in 30 yrs
- 22 days/yr
Wind risk 8/10 · Major
- Chance of severe wind over 30 yrs
- 99.0%
Air-quality risk 1/10 · Minimal
- Unhealthy air days now
- 0 days/yr
- Unhealthy air days in 30 yrs
- 0 days/yr
Risk factors via First Street. Map © Google.
Why this score? — see what drove the F grade
The composite is a weighted blend of 9 inputs, each scored 0–100. Each bar is that input's sub-score; the figure is the points it added to the 100-point composite (weight × sub-score).
- ARV discount +12.1/15.0
- Cash flow +6.7/30.0
- Livability +2.6/5.0
- Condition / age +2.5/5.0
- Rent growth +2.2/5.0
- Schools +2.2/10.0
- 1% rule +1.0/10.0
- DSCR +0.9/10.0
- Appreciation +0.0/10.0
$189,000
🖨 Deal sheet 📄 Offer letter ✓ Due diligence
Listing remarks MLS
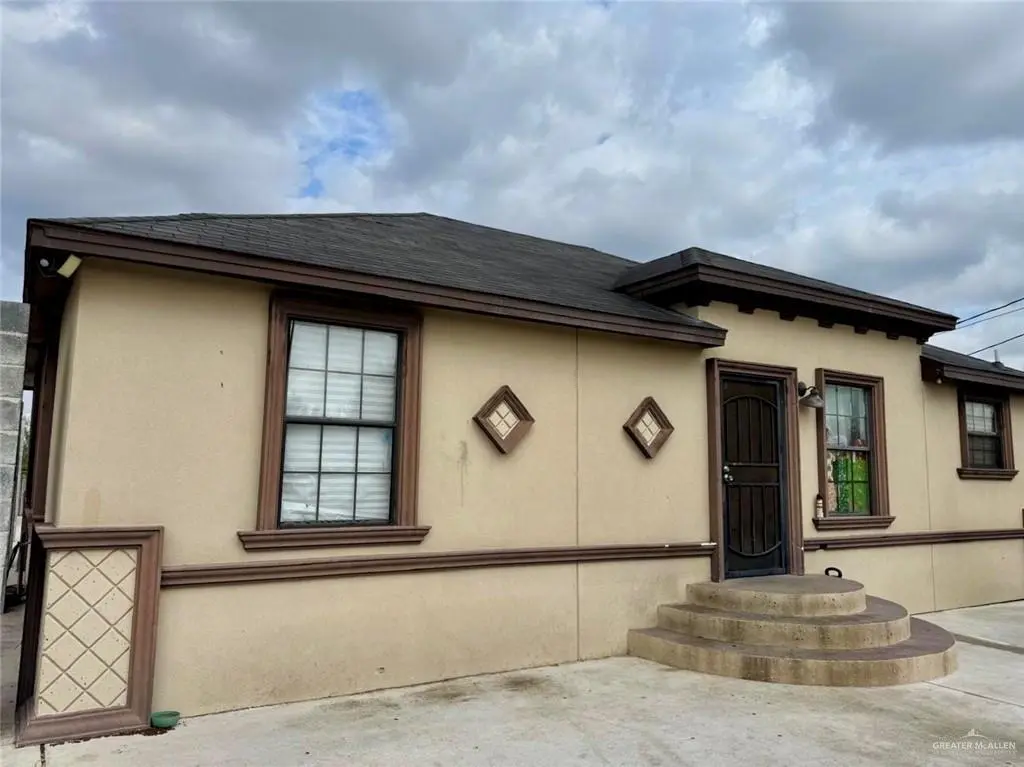
Check out this lovely home in Edinburg, conveniently located near restaurants. It features four bedrooms and two bathrooms, along with a kitchen white cabinets and granite countertops. The dining room is great for gatherings, and the spacious rooms add to the comfort. Plus, the backyard offers plenty of space ready for expansion or large carport. Don’t miss out on this opportunity. Schedule a showing today!
Key facts
- Dining room
- Large carport
- Granite countertops
Tags
Neighborhood map
What this means for you Summary
Snapshot
- This is a 2-bed/1.0-bath single-family listed at $189k.
Deal economics
- At list price, monthly cash flow is $-303 ($-4k/yr) — negative.
- To cash-flow at today's rent, offer at most $136k (28.3% below list).
- To meet the 1% rule (rent ≥ 1% of price), the offer needs to be $114k (39.5% below list).
- Recommended offer: $114k (39.5% below list) — sets the bar for 1% rule.
Location & tenants
- Location reads 52/100 on livability (#1,460 in TX) — a working-class tenant base; expect higher turnover. Strengths: cost of living A+, housing A+; Watch: schools F, crime F, amenities F.
- Edinburg CISD (urban): math 20% / reading 34% proficiency, ranked #699 of 826 in TX (top 85%) — low school quality limits family demand, transient renter base, plan for 1-2y turnover; 62% free/reduced lunch — lower-income household profile, screen leases tightly.
- Market conditions: Rents soft (-1.1%/yr); 1003 active listings in the ZIP; 7,378 units permitted in Hidalgo County in 2024 (641 in 5+ unit buildings).
Forward outlook
- Local home prices are declining (-3.0%/yr); year-one equity from $1k of loan paydown is wiped out by about $6k of value loss. Plan a longer hold.
- Hidalgo County population projected at +28% by 2050 — long-run rental-demand tailwind backs the buy-and-hold thesis.
Negotiation context
- It's been on market 171 days — a 12% lower offer ($166k) is reasonable based on typical stale-listing flexibility.
Risks & watch-outs
- Climate carrying-cost: severe wind risk, 99% chance of damaging wind over 30y; severe wildfire risk; extreme-heat days projected 7→22/yr by 2055 (HVAC capex compounding) — expect insurance premiums to compound above CPI over the hold.
Questions for the listing agent
- What do current leases actually rent for vs. the listed asking? Can we see a recent rent roll and the last 12 months of T-12 income?
- It's been on market 171 days. Have you received any prior offers? Is the seller open to a 40% concession, seller financing, or rate buy-down credit?
- Why hasn't it sold? Are there any deal-killer items the seller is aware of (foundation, flood, title, zoning, code violations)?
- Is there a deadline driving the sale (1031 exchange, divorce, estate, relocation)? That informs how much negotiation room exists.
- Schools are F-rated, which usually means shorter tenancies and higher turnover. Who's the typical renter profile here, and what's been the actual vacancy rate?
- Crime grade is F in this area — have there been break-ins, vandalism, or insurance claims at this property in the last 3 years? What carrier currently insures it and at what premium?
- The area grade is low — what's the realistic commute time and amenity access for the typical tenant pool here? Any planned neighborhood developments (good or bad) we should know about?
- What's the average days-on-market for RENTAL listings here right now (not sales)? A rising rental-DOM trend means longer vacancies and softer asking-rent achievability than the comps imply.
- What's the recent tenant-quality profile in this submarket — average credit score on applications, eviction rate, late-payment / NSF rate, and stable-employment percentage? A property-management company in the area should have these aggregated.
- How much new for-sale + rental construction is in the pipeline within 1–3 miles? Heavy new supply typically softens prices + rents 12–24 months out; constrained supply supports both.
Investment metrics
- 1% rule
- 0.60% ✗
- Cap rate
- 4.37%
- Cash-on-cash
- -6.87%
- DSCR
- 0.69
- GRM
- 13.8
CMA / ARV
- ARV (median comp)
- $210,483
- List price
- $189,000
- Delta
- -10.21%
- Verdict
- UNDERPRICED
- Comps
- 20 within 1.0 mi
Show comp detail 6 sales within ~0.75 mi
| Address | Dist | Beds/Ba | Sqft | Sold | Price | $/sf | Match |
|---|---|---|---|---|---|---|---|
| 4119 Palladium Ave | 0.61mi | 3/2.0 (+1) | 1,200 (0%) | 8mo | $160,000 | $133 | 56 |
| 4301 Rita Ave | 0.67mi | 3/2.0 (+1) | 1,234 (+3%) | 4mo | $115,000 | $93 | 51 |
| 6043 Reymundo St | 0.53mi | 3/2.0 (+1) | 1,260 (+5%) | 13mo | $201,600 | $160 | 47 |
| 3309 Mauricio Ave | 0.55mi | 3/2.0 (+1) | 1,135 (-5%) | 11mo | $189,000 | $167 | 47 |
| 5607 Esmeralda St | 0.66mi | 3/2.0 (+1) | 1,200 (0%) | 18mo | $179,800 | $150 | 45 |
| 6002 N Doolittle Rd | 0.49mi | 3/2.0 (+1) | 1,142 (-5%) | 21mo | $150,000 | $131 | 43 |
Match score weights: distance 35% · size 25% · config 20% · recency 20%. Top-matched comps best support the ARV.
Projected returns pro-forma
-3.0% appreciation · 0.0% rent growth · sell at horizon
- IRR
- -31.3%
- Equity multiple
- -0.01×
- Total profit
- $-53,306
- Equity at exit
- $28,181
- IRR
- -52.9%
- Equity multiple
- -0.59×
- Total profit
- $-84,377
- Equity at exit
- $16,341
Cash invested: $52,920 (down + closing). Projections, not guarantees.
Landlord ↔ Tenant lean methodology
- Overall (STATE)
- 87 Strongly Landlord-Friendly
- State Texas
- 87 Strongly Landlord-Friendly · R+5
- County
- — inherits STATE
- City
- — inherits STATE
ZIP-level market 78542
- Home prices YoY
- -13.4%
- Rents YoY
- -1.1%
- Active inventory
- 1003
- Price-to-rent
- 13.8×
Monthly cashflow live
- Estimated rent
- $1,143 medium interval (Pro) →
- Mortgage (P&I)
- −$991
- Tax from tax record
- −$136 /mo · $1,630/yr
- Insurance
- −$79
- HOA
- −$0
- Vacancy / Maint / Mgmt
- −$240
- Net cashflow
- $-303
Break-even live
UW: 25.0% down · 7.5% · 30yr · 1.5% tax · 5.0% vac · 8.0% maint · 8.0% mgmt
Financing live
Cash to close
- Down payment
- $47,250
- Closing costs
- $5,670
- Reserves months
- —
- Total cash needed
- —
Loan-product check · same deal, 3 products live
Conventional
25% down · 7.5% · 30yr
- Down + closing
- —
- Monthly P&I
- —
- Monthly cashflow
- —
- DSCR
- —
- Eligible?
- —
Personal DTI + credit; lowest rate.
DSCR
20% down · 8.5% · 30yr
- Down + closing
- —
- Monthly P&I
- —
- Monthly cashflow
- —
- DSCR
- —
- Eligible?
- —
No personal income docs; deal must DSCR.
Hard money
10% down · 12.0% · 12mo
- Down + closing
- —
- Monthly P&I
- —
- Monthly cashflow
- —
- DSCR
- —
- Eligible?
- —
Short-term bridge; refi at stabilization.
Listing history 16 events
-
2026-06-18days on market $189,000 Active 171 DOM
-
2026-06-17days on market $189,000 Active 170 DOM
-
2026-06-16days on market $189,000 Active 169 DOM
-
2026-06-15days on market $189,000 Active 168 DOM
-
2026-06-14days on market $189,000 Active 166 DOM
-
2026-06-13days on market $189,000 Active 165 DOM
-
2026-06-10days on market $189,000 Active 163 DOM
-
2026-06-09days on market $189,000 Active 162 DOM
-
2026-06-08days on market $189,000 Active 161 DOM
-
2026-06-07days on market $189,000 Active 160 DOM
-
2026-06-03days on market $189,000 Active 156 DOM
-
2026-06-02days on market $189,000 Active 155 DOM
-
2026-06-01days on market $189,000 Active 154 DOM
-
2026-05-31days on market $189,000 Active 153 DOM
-
2026-05-31days on market $189,000 Active 152 DOM
-
2025-12-29$189,000 Active 417-char remark
Show marketing remark (417 chars)
Check out this lovely home in Edinburg, conveniently located near restaurants. It features four bedrooms and two bathrooms, along with a kitchen white cabinets and granite countertops. The dining room is great for gatherings, and the spacious rooms add to the comfort. Plus, the backyard offers plenty of space ready for expansion or large carport. Don’t miss out on this opportunity. Schedule a showing today!
ⓘ Source: listings_history table (triggers on properties + properties_extension) + one-shot
backfill from property_details.listing_events for pre-trigger history.
Tax reassessment forecast TX · Resets to sale price
- Current annual tax
- $1,630 · $136/mo
- Projected year-2 tax
- $3,459 · $288/mo
- Expected delta
- +$1,828/yr (+$152/mo · 112.2%)
ⓘ Screening estimate from a state-policy table — verify with the county assessor before closing.
Climate risk First Street
- Flood 1/10 Low FEMA zone X · 0% chance over 30 yrs
- Wildfire 8/10 Severe
- Heat 9/10 Extreme 7 d/yr ≥112°F today · 22 d/yr by 30 yrs out
- Wind 8/10 Severe 99% chance of damaging wind over 30 yrs
- Air quality 1/10 Low 0 unhealthy d/yr today · 0 by 30 yrs out
Nearby sold comps map
Loading sold comps map…
Walkable amenities ~0.75 mi
Loading nearby amenities…
Taxation est. · year 1
- Rental income
- $13,716
- − Mortgage interest
- −$10,587
- − Property taxes
- −$1,630
- − Insurance
- −$945
- − Repairs & maintenance
- −$1,097
- − Management
- −$1,097
- − Depreciation
- −$5,498
- Taxable loss
- −$7,139
- Est. tax savings @ 24.0%
- +$1,713
- After-tax cash flow
- $-1,920/yr
For passive investors: Depreciation is non-cash, so a rental often shows a tax loss while cash-flowing — sheltering income. Rental losses are passive: they offset passive income freely, and up to $25,000/yr can offset ordinary (W-2) income if you actively participate and your MAGI is under $100k (phasing out to $0 by $150k); unused losses carry forward. On sale, claimed depreciation is recaptured at up to 25%, and gains may owe capital-gains tax (a 1031 exchange can defer both). Figures are a year-1 estimate at your 24.0% rate — not tax advice; consult a CPA.
Schools (NCES district)
- District
- Edinburg CISD
- NCES district ID
- 4818180
- Math proficiency
- 20% ▼ -34.00%
- Reading proficiency
- 34% ▼ -11.00%
- Median HH income
- $36,985
- Composite
- 22.42/100
- National rank
- #8114
- State rank
- #699 of 826 in TX
Livability — Doolittle
- Score
- 52/100
- State rank
- #1460
- US rank
- #24819
Category grades
Schools grade is shown separately in the Schools card above.
Census & demographics
- Census place
- Doolittle, TX
- County
- Hidalgo County · 623,128 people
- Metro
- McAllen-Edinburg-Mission, TX
- Population (ZIP)
- 89,401
- Household income
- $55,243
- Rent vs Own
- Severe rent burden
- 1240.0
Population outlook (Hidalgo County) Hauer SSP2
- Today (2025)
- 955,232 people
- By 2030
- 1,009,774 · +5.7%
- By 2040
- 1,120,332 · +17.3%
- By 2050
- 1,225,036 · +28.2%
- By 2075
- 1,439,189 · +50.7%
- By 2100
- 1,533,429 · +60.5%
Race, ethnicity, and origin ACS 2023
- Neighborhood character
- Predominantly Hispanic (95%)
- Race & ethnicity
- Hispanic / Latino 95% Two or more races 59% White 4%
- Hispanic origin (detail)
- Mexican 91%
- Foreign-born
- 25% · Canada
- Languages at home
- 15% English-only · Spanish 84%
Political lean MEDSL · Hidalgo
- 2024 margin
- Toss-up / Even · D 48.1% · R 51.0%
- 2008→2024 swing
- -41.6pp toward R · 2008: 38.7pp · 2024: -2.9pp
- All cycles
- 2024: R+2.9 2020: D+17.1 2016: D+40.5 2012: D+41.8 2008: D+38.7
Not yet ingested
- Civics
- —
Market trends
- HPI YoY
- ▼ -34.17%
- Current HPI
- 220.921
- Rent YoY
- ▼ -1.07%
- Metro
- McAllen-Edinburg-Mission, TX
- State GDP YoY
- ▲ 3.95%
- F500 in state
- 110
Industry mix (Fortune 500 HQ in TX)
| Industry | F500 HQs | Revenue |
|---|---|---|
| Energy | 16 | $1,198B |
|
||
| Technology | 5 | $198B |
|
||
| Engineering / Construction | 4 | $72B |
|
||
| Energy Services | 3 | $60B |
|
||
| Utilities | 3 | $41B |
|
||
| Healthcare | 2 | $330B |
|
||
Price history
1 event — show timeline
- 2025-12-29 Listed $189,000 MCALLENMLS
Property tax history
+13.3%/yrLatest (2025): $1,630 · +9.3% YoY. Source: county tax records.
Cash-flow waterfall
monthlySold comps — $/sqft
last 12 mo · ≤1 miLoading sold comps…