 🌊 Lakefront
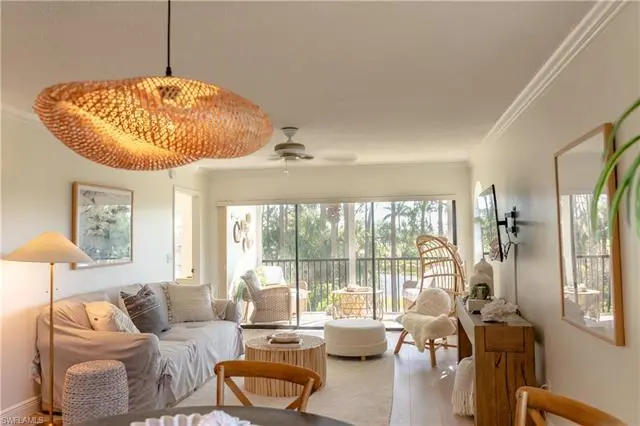
265 Deerwood Cir #10 · Lely, FL
Flood risk 8/10 · Major
- FEMA flood zone
- X (shaded)
- Chance of flooding over 30 yrs
- 0.97%
- Est. flood insurance / yr
- $507 – $1,088
Fire risk 3/10 · Minor
- Est. fire insurance / yr
- $947 – $1,759
Heat risk 10/10 · Severe
- Hot days now (above 108°F)
- 7 days/yr
- Hot days in 30 yrs
- 30 days/yr
Wind risk 10/10 · Severe
- Chance of severe wind over 30 yrs
- 99.0%
Air-quality risk 2/10 · Minimal
- Unhealthy air days now
- 2 days/yr
- Unhealthy air days in 30 yrs
- 2 days/yr
Risk factors via First Street. Map © Google.
Why this score? — see what drove the D grade
The composite is a weighted blend of 9 inputs, each scored 0–100. Each bar is that input's sub-score; the figure is the points it added to the 100-point composite (weight × sub-score).
- Cash flow +11.9/30.0
- ARV discount +7.5/15.0
- 1% rule +5.3/10.0
- Schools +5.0/10.0
- Rent growth +3.9/5.0
- DSCR +3.5/10.0
- Livability +3.3/5.0
- Condition / age +2.5/5.0
- Appreciation +0.0/10.0
$335,000
🖨 Deal sheet (PDF) 📄 Offer letter ✓ Due diligence
Listing remarks MLS
C5769 - Extremely desirable enclave of condos in a cul-de-sac setting. End unit with a panoramic view of golf course, lake, lush landscaping and community pool. Condo has been updated with quartz counters in the kitchen, crown molding throughout and is immaculate and ready to move in. Don't miss this opportunity!
Key facts
- $703 HOA
- Garage
- Community pool
Property features AI
Finance
- Other: No commercial vehicles, motorcycles, RVs or trucks allowed; limited number of vehicles
- HOA & community: Quarterly condo fee; Condo management; Maintenance covers manager, sewer, street lights, street maintenance, trash removal, water; Community amenities include BBQ/picnic area, community pool, community spa/hot tub, golf course (public); see remarks for additional details; Total annual recurring HOA fees: quarterly equivalent provided; Total one-time fees: $150
Exterior
- Parking: Detached 1-car carport
- Security: Underground utilities; Streetlight
- Utilities: Central water; Central sewer; Electric service (central)
- Home design: Residential end-unit; Low-rise (1–3 stories); Built in 1990; Located in Lely Golf Estates (Gleneagles sub-condo)
- Construction: Tile roof
- Exterior features: Tile roof; Lake view; Central irrigation; Windows and storm protection: see remarks; Zero lot line; Rear exposure faces southwest
Interior
- Kitchen: Dishwasher; Disposal; Microwave; Range; Refrigerator
- Bedrooms: 2 bedrooms (split bedroom floor plan)
- Flooring: Tile
- Bathrooms: 2 full bathrooms; Master bath: see remarks
- Heating & cooling: Central electric heat; Central electric air conditioning; Ceiling fans; Cable available
- Interior features: Cable prewire; Pantry; Smoke detectors; Eat-in kitchen; Guest bath; Guest room; Laundry in residence; Screened lanai/porch; Common elevator access; Furnished
- Laundry & utility: Washer; Dryer
Neighborhood map
What this means for you Summary
Snapshot
- This is a 2-bed/2.0-bath condo listed at $335k.
Deal economics
- At list price, monthly cash flow is $-154 ($-2k/yr) — negative.
- To cash-flow at today's rent, offer at most $308k (8.1% below list).
- Meets the 1% rule at list price ($3k rent vs $335k).
- Recommended offer: $308k (8.1% below list) — sets the bar for cash-flow.
Location & tenants
- Location reads 66/100 on livability (#586 in FL) — a middle-class / working-renter tenant base. Strengths: crime A+, housing A+; Watch: health & safety D, amenities F, commute F.
- Collier (suburban): math 60% / reading 56% proficiency, ranked #16 of 73 in FL (top 22%) — acceptable for families but not a draw, mixed tenant base, ~2y average lease.
- Zoned schools: Lely Elementary School (math 45% / reading 46%, grade D-, #1,247 of 2,144 statewide, top 59%, 499 students, 62% FRL); Manatee Middle School (math 61% / reading 43%, grade C+, #217 of 571 statewide, top 40%, 749 students, 64% FRL); Lely High School (math 40% / reading 39%, grade F, #304 of 667 statewide, top 47%, 1,504 students, 54% FRL).
- Zoned-school proficiency averages 46% at this address vs 58% district-wide (-12 pts) — the specific schools serving this property underperform the Collier average; the district grade overstates school quality for this exact location.
- Market conditions: Rents rising fast (+5.6%/yr); 598 active listings in the ZIP; 40 comparable units currently listed for rent nearby; rentals at typical pace (median 25d on market — plan ~3-4 weeks tenant-placement turnaround); solid renter incomes; 3,520 units permitted in Collier County in 2024 (959 in 5+ unit buildings).
- At $3,467/mo this rent would consume 51% of the median local household income ($82k/yr) (locally 954% of renters already pay >50% of income on rent) — very limited rent-growth headroom before tenants either downsize or default.
Forward outlook
- Local home prices are declining (-3.0%/yr); year-one equity from $2k of loan paydown is wiped out by about $10k of value loss. Plan a longer hold.
- Collier County population projected at +30% by 2050 — long-run rental-demand tailwind backs the buy-and-hold thesis.
Negotiation context
- It's been on market 67 days — a 6% lower offer ($315k) is reasonable based on typical stale-listing flexibility.
- 3 sale attempts since 14y ago with the ask held roughly flat each time — persistent listings suggest the price (not the market) is what's stuck; bring a comps-based counter.
Risks & watch-outs
- Watch-outs: flood insurance adds $66/mo; HOA is 20% of rent.
- Climate carrying-cost: severe flood risk; severe wind risk, 99% chance of damaging wind over 30y; extreme-heat days projected 7→30/yr by 2055 (HVAC capex compounding) — expect insurance premiums to compound above CPI over the hold.
Questions for the listing agent
- What do current leases actually rent for vs. the listed asking? Can we see a recent rent roll and the last 12 months of T-12 income?
- It's been on market 67 days. Have you received any prior offers? Is the seller open to a 8% concession, seller financing, or rate buy-down credit?
- What's the actual annual flood-insurance premium (NFIP or private), and is the property in a SFHA with mandatory coverage?
- What does the HOA fee cover, when was the last increase, and are there any pending special assessments or reserve-fund shortfalls?
- Any open or pending special assessments — roof, HVAC, plumbing, elevator, façade? What's the per-unit balance and payoff schedule, and is the seller paying it off at close or rolling it to the buyer?
- Why hasn't it sold? Are there any deal-killer items the seller is aware of (foundation, flood, title, zoning, code violations)?
- Is there a deadline driving the sale (1031 exchange, divorce, estate, relocation)? That informs how much negotiation room exists.
- Schools are D-rated, which usually means shorter tenancies and higher turnover. Who's the typical renter profile here, and what's been the actual vacancy rate?
- The area grade is low — what's the realistic commute time and amenity access for the typical tenant pool here? Any planned neighborhood developments (good or bad) we should know about?
- This sits on a lake — are riparian / water-frontage rights deeded with the parcel? Any dock permits, shoreline easements, or HOA water-use restrictions?
- What's the documented flood / surge / shoreline-erosion history here (FEMA AND non-FEMA — e.g., storm surge, creek backup, septic-field saturation)?
- Any water-quality or seasonal algae-bloom issues that affect tenant satisfaction or short-term-rental demand?
- What's the average days-on-market for RENTAL listings here right now (not sales)? A rising rental-DOM trend means longer vacancies and softer asking-rent achievability than the comps imply.
- What's the recent tenant-quality profile in this submarket — average credit score on applications, eviction rate, late-payment / NSF rate, and stable-employment percentage? A property-management company in the area should have these aggregated.
- How much new apartment / multifamily construction is in the pipeline within 1–3 miles? Heavy new supply (>2% of stock underway) typically softens rents 12–24 months out; light construction supports rent growth.
Investment metrics
- 1% rule
- 1.03% ✓
- Cap rate
- 5.98%
- Cash-on-cash
- -1.13%
- DSCR
- 0.95
- GRM
- 8.1
CMA / ARV
No comps found within radius.
Projected returns pro-forma
-3.0% appreciation · 5.59% rent growth · sell at horizon
- IRR
- -15.8%
- Equity multiple
- 0.42×
- Total profit
- $-54,446
- Equity at exit
- $49,950
- IRR
- -2.5%
- Equity multiple
- 0.80×
- Total profit
- $-18,319
- Equity at exit
- $28,965
Cash invested: $93,800 (down + closing). Projections, not guarantees.
Landlord ↔ Tenant lean methodology
- Overall (STATE)
- 87 Strongly Landlord-Friendly
- State Florida
- 87 Strongly Landlord-Friendly · R+3
- County
- — inherits STATE
- City
- — inherits STATE
ZIP-level market 34113
- Rents YoY
- 5.6%
- Active inventory
- 598
- Price-to-rent
- 8.1×
Monthly cashflow live
- Estimated rent
- $3,467 high interval (Pro) →
- Mortgage (P&I)
- −$1,757
- Tax from tax record
- −$227 /mo · $2,726/yr
- Insurance
- −$140
- Flood insurance flood zone
- −$66 /mo · $798/yr
- HOA
- −$703
- Vacancy / Maint / Mgmt
- −$728
- Net cashflow
- $-154
Break-even live
Sensitivity live
| Price | -10% $35 | -5% $-60 | +0% $-154 | +5% $-249 | +10% $-344 |
|---|---|---|---|---|---|
| Rent | -10% $-428 | -5% $-291 | +0% $-154 | +5% $-18 | +10% $119 |
| Rate | -1.0pp $14 | -0.5pp $-69 | base $-154 | +0.5pp $-241 | +1.0pp $-330 |
UW: 25.0% down · 7.5% · 30yr · 1.5% tax · 5.0% vac · 8.0% maint · 8.0% mgmt
Financing live
Cash to close
- Down payment
- $83,750
- Closing costs
- $10,050
- Reserves months
- —
- Total cash needed
- —
Loan-product check · same deal, 3 products live
Conventional
25% down · 7.5% · 30yr
- Down + closing
- —
- Monthly P&I
- —
- Monthly cashflow
- —
- DSCR
- —
- Eligible?
- —
Personal DTI + credit; lowest rate.
DSCR
20% down · 8.5% · 30yr
- Down + closing
- —
- Monthly P&I
- —
- Monthly cashflow
- —
- DSCR
- —
- Eligible?
- —
No personal income docs; deal must DSCR.
Hard money
10% down · 12.0% · 12mo
- Down + closing
- —
- Monthly P&I
- —
- Monthly cashflow
- —
- DSCR
- —
- Eligible?
- —
Short-term bridge; refi at stabilization.
Rent comps 40 comps
| Address | Beds | Baths | Sqft | Rent | $/sqft | DOM | Units | Dist |
|---|---|---|---|---|---|---|---|---|
| 265 Deerwood Cir Naples, FL | 2.0 | 2.0 | 1179 | $5,000 | $4.24 | 25d | 1 | 0.03mi |
| 520 Augusta Blvd Unit B204 Naples, FL | 3.0 | 2.0 | 1294 | $2,200 | $1.70 | 25d | 1 | 0.18mi |
| 555 Augusta Blvd Unit 3-1 Naples, FL | 2.0 | 2.0 | 1249 | $4,200 | $3.36 | 25d | 1 | 0.21mi |
| 413 Augusta Blvd #302 Naples, FL | 2.0 | 2.0 | 1390 | $5,500 | $3.96 | 23d | 1 | 0.22mi |
| 575 Augusta Blvd Naples, FL | 3.0 | 2.0 | 1500 | $2,100 | $1.40 | 25d | 1 | 0.23mi |
| 605 Augusta Blvd #14 Naples, FL | 2.0 | 2.0 | 1125 | $4,000 | $3.56 | 25d | 1 | 0.27mi |
| 605 Augusta Blvd #4 Naples, FL | 2.0 | 2.0 | 1125 | $3,950 | $3.51 | 15d | 1 | 0.27mi |
| 701 Augusta Blvd Unit 701-8 Naples, FL | 2.0 | 2.0 | 1250 | $4,800 | $3.84 | 15d | 1 | 0.30mi |
| 705 Augusta Blvd Unit 705-5 Naples, FL | 2.0 | 2.0 | 1125 | $2,000 | $1.78 | 15d | 1 | 0.33mi |
| 709 Augusta Blvd Unit 709-5 Naples, FL | 3.0 | 2.0 | 1480 | $4,000 | $2.70 | 15d | 1 | 0.36mi |
| 760 Augusta Blvd Unit D204 Naples, FL | 3.0 | 2.0 | 1294 | $2,300 | $1.78 | 25d | 1 | 0.38mi |
| 315 Saint Andrews Blvd Unit A25 Naples, FL | 2.0 | 2.0 | 1126 | $1,530 | $1.36 | 25d | 1 | 0.45mi |
| 452 Bristle Cone Ln #27 Naples, FL | 2.0 | 2.0 | 1129 | $2,000 | $1.77 | 25d | 1 | 0.47mi |
| 905 Augusta Blvd Naples, FL | 2.0 | 2.0 | 1125 | $1,850 | $1.64 | 25d | 1 | 0.48mi |
| 940 Augusta Blvd Unit D939 Naples, FL | 2.0 | 2.0 | 1419 | $2,200 | $1.55 | 25d | 1 | 0.54mi |
| 326 Bradstrom Cir Unit 204F Naples, FL | 3.0 | 2.0 | 1200 | $3,500 | $2.92 | 25d | 1 | 0.54mi |
| 326 Bradstrom Cir Unit 103F Naples, FL | 2.0 | 2.0 | 1113 | $1,800 | $1.62 | 25d | 1 | 0.54mi |
| 332 Bradstrom Cir #201 Naples, FL | 2.0 | 2.0 | 1257 | $2,200 | $1.75 | 25d | 1 | 0.59mi |
| 5857 Rattlesnake Hammock Rd #208 Naples, FL | 2.0 | 2.0 | 1133 | $3,000 | $2.65 | 15d | 1 | 0.59mi |
| 5841 Rattlesnake Hammock Rd Unit 2 Naples, FL | 2.0 | 2.0 | 1133 | $2,500 | $2.21 | 25d | 1 | 0.59mi |
| 5841 Rattlesnake Hammock Rd Unit I-203 Naples, FL | 2.0 | 2.0 | 1015 | $3,500 | $3.45 | 15d | 1 | 0.59mi |
| 5651 Rattlesnake Hammock Rd Unit C-108 Naples, FL | 2.0 | 2.0 | 1054 | $1,800 | $1.71 | 25d | 1 | 0.60mi |
| 5293 Dixie Dr Unit 1546039P Naples, FL | 2.0 | 2.0 | 1130 | $1,561 | $1.38 | 15d | 1 | 0.62mi |
| 5635 Rattlesnake Hammock Rd Apt 203D Naples, FL | 2.0 | 2.0 | 1054 | $1,700 | $1.61 | 23d | 1 | 0.63mi |
| 5535 Rattlesnake Hammock Rd #302 Naples, FL | 2.0 | 2.0 | 1205 | $2,800 | $2.32 | 25d | 1 | 0.69mi |
| 5502 Greenwood Cir #1 Naples, FL | 3.0 | 2.0 | 1450 | $2,400 | $1.66 | 25d | 1 | 0.74mi |
| 248 Pebble Beach Cir Unit G201 Naples, FL | 2.0 | 2.0 | 1163 | $2,300 | $1.98 | 25d | 1 | 0.75mi |
| 240 Pebble Beach Blvd #702 Naples, FL | 2.0 | 2.0 | 1090 | $4,000 | $3.67 | 25d | 1 | 0.80mi |
| 5499 Rattlesnake Hammock Rd Naples, FL | 2.0 | 2.0 | 1071 | $1,775 | $1.66 | 15d | 2 | 0.83mi |
| 4556 Andover Way Unit E106 Naples, FL | 2.0 | 2.0 | 1172 | $1,900 | $1.62 | 15d | 1 | 0.86mi |
| 4556 Andover Way Unit E104 Naples, FL | 2.0 | 2.0 | 1072 | $5,000 | $4.66 | 15d | 1 | 0.86mi |
| 5595 Greenwood Cir #92 Naples, FL | 3.0 | 2.0 | 1450 | $5,000 | $3.45 | 25d | 1 | 0.86mi |
| 190 Pebble Beach Blvd #301 Naples, FL | 2.0 | 2.0 | 954 | $1,700 | $1.78 | 25d | 1 | 0.87mi |
| 5778 Greenwood Cir Naples, FL | 3.0 | 2.0 | 1450 | $4,000 | $2.76 | 25d | 1 | 0.88mi |
| 232 Pebble Beach Blvd #104 Naples, FL | 3.0 | 2.0 | 1298 | $1,975 | $1.52 | 25d | 1 | 0.89mi |
| 5419 Rattlesnake Hammock Rd Unit 307F Naples, FL | 2.0 | 2.0 | 1071 | $1,950 | $1.82 | 15d | 1 | 0.90mi |
| 332 Charlemagne Blvd Unit H103 Naples, FL | 2.0 | 2.0 | 1082 | $3,495 | $3.23 | 25d | 1 | 0.98mi |
| 332 Charlemagne Blvd Unit H101 Naples, FL | 2.0 | 2.0 | 1082 | $3,500 | $3.23 | 25d | 1 | 0.98mi |
| 6984 Saona Ct Naples, FL | 2.0 | 2.0 | 1472 | $7,500 | $5.10 | 25d | 1 | 1.02mi |
| 4410 Chantelle Dr Unit H-205 Naples, FL | 2.0 | 2.0 | 1349 | $3,500 | $2.59 | 15d | 1 | 1.04mi |
HOA detail condo
- Monthly dues
- $703 · $8,436/yr
- Likely covers
- landscapingpool
- Assessments
- None detected in remarks — confirm with the listing agent.
Listing history 16 events
-
2026-06-21days on market $335,000 Active 67 DOM
-
2026-06-18days on market $335,000 Active 64 DOM
-
2026-06-17days on market $335,000 Active 63 DOM
-
2026-06-16days on market $335,000 Active 62 DOM
-
2026-06-15days on market $335,000 Active 61 DOM
-
2026-06-14days on market $335,000 Active 59 DOM
-
2026-06-10days on market $335,000 Active 56 DOM
-
2026-06-09days on market $335,000 Active 55 DOM
-
2026-06-08days on market $335,000 Active 54 DOM
-
2026-06-07days on market $335,000 Active 53 DOM
-
2026-06-03days on market $335,000 Active 49 DOM
-
2026-06-02days on market $335,000 Active 48 DOM
-
2026-06-01days on market $335,000 Active 47 DOM
-
2026-05-31days on market $335,000 Active 46 DOM
-
2026-05-30remarks 699-char remark
-
2026-05-30$335,000 Active 45 DOM
ⓘ Source: listings_history table (triggers on properties + properties_extension) + one-shot
backfill from property_details.listing_events for pre-trigger history.
Tax reassessment forecast FL · Resets to sale price
- Current annual tax
- $2,726 · $227/mo
- Projected year-2 tax
- $2,780 · $232/mo
- Expected delta
- +$54/yr (+$5/mo · 2.0%)
ⓘ Screening estimate from a state-policy table — verify with the county assessor before closing.
Climate risk First Street
- Flood 8/10 Severe FEMA zone X (shaded) · 97% chance over 30 yrs
- Wildfire 3/10 Moderate
- Heat 10/10 Extreme 7 d/yr ≥108°F today · 30 d/yr by 30 yrs out
- Wind 10/10 Extreme 99% chance of damaging wind over 30 yrs
- Air quality 2/10 Low 2 unhealthy d/yr today · 2 by 30 yrs out
Nearby sold comps map
Loading sold comps map…
Walkable amenities ~0.75 mi
Loading nearby amenities…
Taxation est. · year 1
- Rental income
- $41,598
- − Mortgage interest
- −$18,765
- − Property taxes
- −$2,726
- − Insurance
- −$2,472
- − Repairs & maintenance
- −$3,328
- − Management
- −$3,328
- − HOA
- −$8,436
- − Depreciation
- −$9,745
- Taxable loss
- −$7,203
- Est. tax savings @ 24.0%
- +$1,729
- After-tax cash flow
- $-125/yr
For passive investors: Depreciation is non-cash, so a rental often shows a tax loss while cash-flowing — sheltering income. Rental losses are passive: they offset passive income freely, and up to $25,000/yr can offset ordinary (W-2) income if you actively participate and your MAGI is under $100k (phasing out to $0 by $150k); unused losses carry forward. On sale, claimed depreciation is recaptured at up to 25%, and gains may owe capital-gains tax (a 1031 exchange can defer both). Figures are a year-1 estimate at your 24.0% rate — not tax advice; consult a CPA.
Schools (NCES district)
- District
- Collier
- NCES district ID
- 1200330
- Math proficiency
- 60% ▼ -4.00%
- Reading proficiency
- 56% ▼ -2.00%
- Median HH income
- $58,275
- Composite
- 50.23/100
- National rank
- #1892
- State rank
- #16 of 73 in FL
Livability — Lely
- Score
- 66/100
- State rank
- #586
- US rank
- #11224
Category grades
Schools grade is shown separately in the Schools card above.
Census & demographics
- Census place
- Lely, FL
- County
- Collier County · 396,295 people
- Metro
- Naples-Marco Island, FL
- Population (ZIP)
- 26,056
- Household income
- $81,674
- Rent vs Own
- Severe rent burden
- 954.0
Population outlook (Collier County) Hauer SSP2
- Today (2025)
- 420,858 people
- By 2030
- 450,054 · +6.9%
- By 2040
- 502,232 · +19.3%
- By 2050
- 544,932 · +29.5%
- By 2075
- 627,203 · +49.0%
- By 2100
- 659,015 · +56.6%
Race, ethnicity, and origin ACS 2023
- Neighborhood character
- Diverse neighborhood (Simpson 0.59)
- Race & ethnicity
- White 56% Hispanic / Latino 28% Black 12% Two or more races 11% Asian 2%
- Hispanic origin (detail)
- Mexican 17% Puerto Rican 3% Cuban 2%
- Common ancestry
- Hispanic 10% Romanian 3% Lithuanian 2%
- Foreign-born
- 26% · Canada, Jamaica, Vietnam
- Languages at home
- 63% English-only · Spanish 24% French/Haitian/Cajun 9% Other Indo-European 2%
Political lean MEDSL · Collier
- 2024 margin
- Solid R (+33.1) · D 33.1% · R 66.2%
- 2008→2024 swing
- -10.6pp toward R · 2008: -22.5pp · 2024: -33.1pp
- All cycles
- 2024: R+33.1 2020: R+24.7 2016: R+26.0 2012: R+30.1 2008: R+22.5
Not yet ingested
- Civics
- —
Market trends
- HPI YoY
- ▼ -194.86%
- Current HPI
- 279.4232
- Rent YoY
- ▲ 5.59%
- Metro
- Naples-Marco Island, FL
- State GDP YoY
- ▲ 3.28%
- F500 in state
- 36
Industry mix (Fortune 500 HQ in FL)
| Industry | F500 HQs | Revenue |
|---|---|---|
| Industrial Technology | 2 | $29B |
|
||
| Insurance | 2 | $17B |
|
||
| Retail | 1 | $60B |
|
||
| Technology Distribution | 1 | $58B |
|
||
| Homebuilding | 1 | $35B |
|
||
| Technology Manufacturing | 1 | $35B |
|
||
Price history
+319.3% since first listed10 events — show timeline
- 2026-04-15 Listed $335,000 NAPLESMLS
- 2022-06-15 Sold (Public Records) $349,000 Public Records
- 2022-06-10 Sold (MLS) $349,000 NAPLESMLS
- 2022-05-10 Pending — NAPLESMLS
- 2022-05-02 Listed $349,000 NAPLESMLS
- 2012-03-28 Sold (Public Records) $128,000 Public Records
- 2012-03-23 Sold (MLS) $128,000 NAPLESMLS
- 2012-02-06 Listed $137,000 NAPLESMLS
- 2003-11-24 Sold (Public Records) $120,000 Public Records
- 1990-05-01 Sold (Public Records) $79,900 Public Records
Property tax history
+8.2%/yrLatest (2025): $2,726 · +4.3% YoY. Source: county tax records.
Cash-flow waterfall
monthlySold comps — $/sqft
last 12 mo · ≤1 miLoading sold comps…