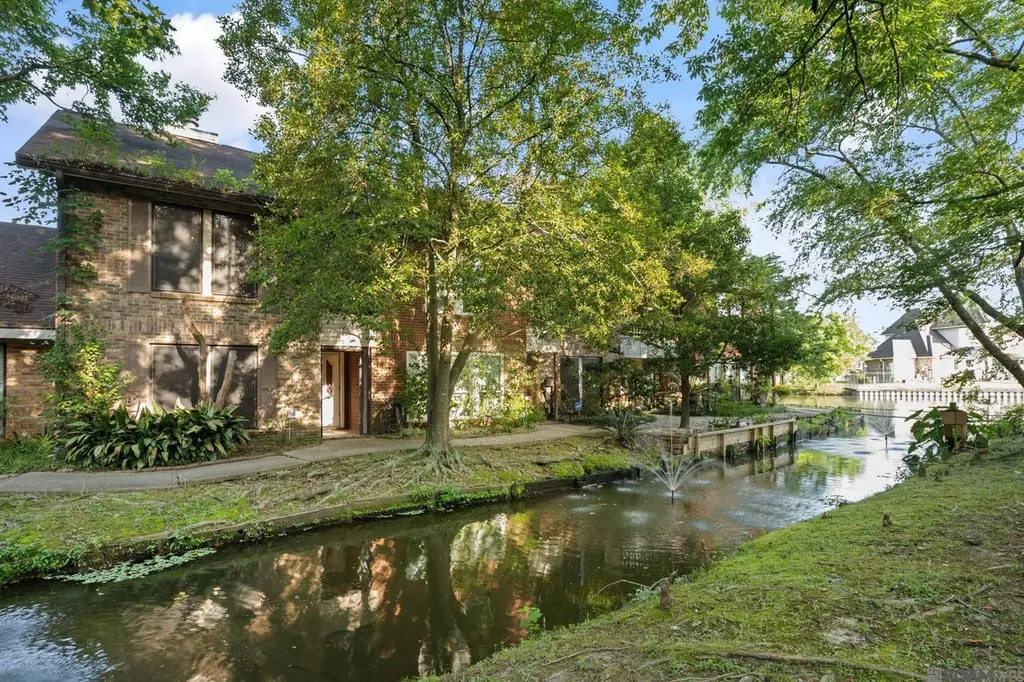
 🌊 Lakefront
2431 Aubin Ln · Baton Rouge, LA
Flood risk 4/10 · Minor
- FEMA flood zone
- X
- Chance of flooding over 30 yrs
- 0.2%
- Est. flood insurance / yr
- $507 – $1,088
Fire risk 1/10 · Minimal
- Est. fire insurance / yr
- $1,269 – $2,357
Heat risk 8/10 · Major
- Hot days now (above 108°F)
- 7 days/yr
- Hot days in 30 yrs
- 20 days/yr
Wind risk 9/10 · Severe
- Chance of severe wind over 30 yrs
- 99.0%
Air-quality risk 3/10 · Minor
- Unhealthy air days now
- 3 days/yr
- Unhealthy air days in 30 yrs
- 3 days/yr
Risk factors via First Street. Map © Google.
Why this score? — see what drove the C- grade
The composite is a weighted blend of 9 inputs, each scored 0–100. Each bar is that input's sub-score; the figure is the points it added to the 100-point composite (weight × sub-score).
- Cash flow +15.5/30.0
- ARV discount +15.0/15.0
- 1% rule +6.8/10.0
- DSCR +4.8/10.0
- Livability +3.7/5.0
- Rent growth +2.5/5.0
- Condition / age +2.5/5.0
- Schools +2.4/10.0
- Appreciation +0.0/10.0
$126,000
🖨 Deal sheet 📄 Offer letter ✓ Due diligence
Listing remarks MLS
Located on a nice big lake for your evening enjoyment. Seat out and watch sun sets and sunrises from the benches located around the lake area. Sidewalks for strolling the community and enjoying the beauty. Fishing is fine, must be resident to the community, you must release them back. No paddle boats or boats of any kind. This townhome has been rental for present owner and could be for you as well. Owner is selling "AS IS", there are some things that need some TLC, so please preview well. Community pool for your enjoyment and now is the perfect time to become the new owner of the lovely townhome.
Key facts
- $229 HOA
- Garage
- Pool
Property features AI
Finance
- Other: Subdivision: Aubin Lane Townhomes; Directions available
- Financial info: No investor or income/expense details provided
- HOA & community: Homeowners association present; Annual HOA fee of $2,748 (approximately $229/month); HOA covers grounds maintenance, water, and sewer
Exterior
- Parking: Has garage
- Security: Security details not specified
- Utilities: Public water; Public sewer
- Home design: Attached townhouse (residential); Property faces not specified; Entry level not specified; Stories not specified
- Construction: Brick construction; Slab foundation; Year built not specified
- Exterior features: Private in-ground pool; Rear-facing garage; Off-street parking
Interior
- Kitchen: Kitchen appliances not specified
- Bedrooms: Bedrooms not specified
- Flooring: Flooring details not specified
- Bathrooms: 3 full bathrooms
- Heating & cooling: Central heating; Central air conditioning
- Interior features: Walk-in closets; Wood-burning fireplace (1)
- Laundry & utility: Laundry details not specified
Neighborhood map
What this means for you Summary
Snapshot
- This is a 2-bed/3.0-bath single-family listed at $126k.
Deal economics
- At list price, monthly cash flow is $51 ($615/yr) — positive.
- The deal already cash-flows at list — no discount required.
- Meets the 1% rule at list price ($1k rent vs $126k).
- Recommended offer: $122k (3.0% below list) — sets the bar for market timing.
- Cap rate 6.8% vs local median 4.3% in Baton Rouge — top-decile yield for the area; either an underpriced asset or a hidden risk that comps aren't pricing in. Stress-test before assuming the spread holds.
Location & tenants
- Location reads 74/100 on livability (#24 in LA, #4,535 nationally) — a middle-class / working-renter tenant base. Strengths: commute A+, cost of living A+, health & safety A+; Watch: amenities D, crime F, employment D-.
- East Baton Rouge Parish (urban): math 22% / reading 34% proficiency, ranked #47 of 98 in LA (top 48%) — low school quality limits family demand, transient renter base, plan for 1-2y turnover; 77% free/reduced lunch — lower-income household profile, screen leases tightly.
- Market conditions: Rents flat; 250 active listings in the ZIP; 40 comparable units currently listed for rent nearby; rentals at typical pace (median 23d on market — plan ~3-4 weeks tenant-placement turnaround); 48% of comp listings sitting > 30 days — soft ceiling on asking rent; 2,252 units permitted in East Baton Rouge Parish in 2024 (440 in 5+ unit buildings).
Forward outlook
- Local home prices are declining (-3.0%/yr); year-one equity from $871 of loan paydown is wiped out by about $4k of value loss. Plan a longer hold.
- East Baton Rouge County population projected at +4% by 2050 — modest demand growth; plan on rents tracking national, not racing it.
Negotiation context
- It's been on market 45 days — a 3% lower offer ($122k) is reasonable based on typical stale-listing flexibility.
- 22 sale attempts since 22y ago with the ask held roughly flat each time — persistent listings suggest the price (not the market) is what's stuck; bring a comps-based counter.
Risks & watch-outs
- Climate carrying-cost: severe wind risk, 99% chance of damaging wind over 30y; extreme-heat days projected 7→20/yr by 2055 (HVAC capex compounding) — expect insurance premiums to compound above CPI over the hold.
Questions for the listing agent
- It's been on market 45 days. Have you received any prior offers? Is the seller open to a 3% concession, seller financing, or rate buy-down credit?
- What does the HOA fee cover, when was the last increase, and are there any pending special assessments or reserve-fund shortfalls?
- Is there a deadline driving the sale (1031 exchange, divorce, estate, relocation)? That informs how much negotiation room exists.
- Crime grade is F in this area — have there been break-ins, vandalism, or insurance claims at this property in the last 3 years? What carrier currently insures it and at what premium?
- This sits on a lake — are riparian / water-frontage rights deeded with the parcel? Any dock permits, shoreline easements, or HOA water-use restrictions?
- What's the documented flood / surge / shoreline-erosion history here (FEMA AND non-FEMA — e.g., storm surge, creek backup, septic-field saturation)?
- Any water-quality or seasonal algae-bloom issues that affect tenant satisfaction or short-term-rental demand?
- What's the average days-on-market for RENTAL listings here right now (not sales)? A rising rental-DOM trend means longer vacancies and softer asking-rent achievability than the comps imply.
- What's the recent tenant-quality profile in this submarket — average credit score on applications, eviction rate, late-payment / NSF rate, and stable-employment percentage? A property-management company in the area should have these aggregated.
- How much new for-sale + rental construction is in the pipeline within 1–3 miles? Heavy new supply typically softens prices + rents 12–24 months out; constrained supply supports both.
Investment metrics
- 1% rule
- 1.18% ✓
- Cap rate
- 6.78%
- Cash-on-cash
- 1.74%
- DSCR
- 1.08
- GRM
- 7.1
CMA / ARV
- ARV (median comp)
- $209,449
- List price
- $126,000
- Delta
- -39.84%
- Verdict
- UNDERPRICED
- Comps
- 20 within 1.0 mi
Show comp detail 12 sales within ~0.75 mi
| Address | Dist | Beds/Ba | Sqft | Sold | Price | $/sf | Match |
|---|---|---|---|---|---|---|---|
| 10838 Woodleaf Ave | 0.10mi | 3/2.0 (+1) | 1,764 (+1%) | 12mo | $310,000 | $176 | 74 |
| 2937 Magellan Dr | 0.37mi | 3/2.0 (+1) | 1,734 (-0%) | 7mo | $200,000 | $115 | 67 |
| 2949 Cavalier Dr | 0.42mi | 3/2.0 (+1) | 1,767 (+2%) | 2mo | $191,000 | $108 | 67 |
| 2321 Summerleaf Cir | 0.09mi | 3/2.0 (+1) | 1,858 (+7%) | 11mo | $307,000 | $165 | 66 |
| 1874 Stonegate Ct | 0.51mi | 3/2.0 (+1) | 1,754 (+1%) | 2mo | $195,000 | $111 | 64 |
| 1867 Stonegate Ct | 0.52mi | 3/2.5 (+1) | 1,820 (+4%) | 2mo | $175,000 | $96 | 60 |
| 3033 Caroljack Dr | 0.46mi | 3/2.0 (+1) | 1,609 (-8%) | 3mo | $199,999 | $124 | 55 |
| 2901 Caroljack Dr | 0.35mi | 3/2.0 (+1) | 1,536 (-12%) | 2mo | $199,700 | $130 | 53 |
| 2166 Silverest Ave | 0.57mi | 3/2.0 (+1) | 1,640 (-6%) | 2mo | $235,000 | $143 | 53 |
| 10931 Stanley Aubin Ln | 0.66mi | 3/2.5 (+1) | 1,880 (+8%) | 5mo | $225,000 | $120 | 45 |
| 1749 Stonegate Ct | 0.57mi | 3/2.0 (+1) | 1,523 (-12%) | 1mo | $195,000 | $128 | 42 |
| 10815 Stanley Aubin Ln | 0.67mi | 3/2.0 (+1) | 1,563 (-10%) | 3mo | $190,000 | $122 | 40 |
Match score weights: distance 35% · size 25% · config 20% · recency 20%. Top-matched comps best support the ARV.
Projected returns pro-forma
-3.0% appreciation · 0.16% rent growth · sell at horizon
- IRR
- -17.5%
- Equity multiple
- 0.40×
- Total profit
- $-21,096
- Equity at exit
- $18,787
- IRR
- -18.4%
- Equity multiple
- 0.17×
- Total profit
- $-29,425
- Equity at exit
- $10,894
Cash invested: $35,280 (down + closing). Projections, not guarantees.
Landlord ↔ Tenant lean methodology
- Overall (STATE)
- 90 Strongly Landlord-Friendly
- State Louisiana
- 90 Strongly Landlord-Friendly · R+12
- County
- — inherits STATE
- City
- — inherits STATE
ZIP-level market 70816
- Rents YoY
- 0.2%
- Active inventory
- 250
- Price-to-rent
- 7.1×
Monthly cashflow live
- Estimated rent
- $1,483 high interval (Pro) →
- Mortgage (P&I)
- −$661
- Tax from tax record
- −$178 /mo · $2,134/yr
- Insurance
- −$52
- HOA
- −$229
- Vacancy / Maint / Mgmt
- −$311
- Net cashflow
- $51
Break-even live
UW: 25.0% down · 7.5% · 30yr · 1.5% tax · 5.0% vac · 8.0% maint · 8.0% mgmt
Financing live
Cash to close
- Down payment
- $31,500
- Closing costs
- $3,780
- Reserves months
- —
- Total cash needed
- —
Loan-product check · same deal, 3 products live
Conventional
25% down · 7.5% · 30yr
- Down + closing
- —
- Monthly P&I
- —
- Monthly cashflow
- —
- DSCR
- —
- Eligible?
- —
Personal DTI + credit; lowest rate.
DSCR
20% down · 8.5% · 30yr
- Down + closing
- —
- Monthly P&I
- —
- Monthly cashflow
- —
- DSCR
- —
- Eligible?
- —
No personal income docs; deal must DSCR.
Hard money
10% down · 12.0% · 12mo
- Down + closing
- —
- Monthly P&I
- —
- Monthly cashflow
- —
- DSCR
- —
- Eligible?
- —
Short-term bridge; refi at stabilization.
Rent comps 40 comps
| Address | Beds | Baths | Sqft | Rent | $/sqft | DOM | Units | Dist |
|---|---|---|---|---|---|---|---|---|
| 10795 Mead Rd Baton Rouge, LA | 1.0–2.0 | 1.0–2.0 | 836 | $1,287 | $1.54 | 14d | 16 | 0.12mi |
| 11110 Boardwalk Dr #36 Baton Rouge, LA | 3.0 | 2.0 | 1618 | $2,000 | $1.24 | 43d | 1 | 0.22mi |
| 11110 Boardwalk Dr #36 Baton Rouge, LA | 3.0 | 2.0 | 1618 | $2,000 | $1.24 | 23d | 1 | 0.22mi |
| 2222 Seracedar Dr Baton Rouge, LA | 3.0 | 2.0 | 1550 | $1,700 | $1.10 | 43d | 1 | 0.33mi |
| 11111 N Harrells Ferry Rd Baton Rouge, LA | 1.0–2.0 | 1.0–2.0 | 949 | $1,185 | $1.25 | 23d | 1 | 0.43mi |
| 11070 Mead Rd Baton Rouge, LA | 1.0–2.0 | 1.0–2.0 | 836 | $1,284 | $1.53 | 14d | 19 | 0.43mi |
| 2257 Silverest Ave Baton Rouge, LA | 3.0 | 1.5 | 1800 | $1,700 | $0.94 | 23d | 1 | 0.50mi |
| 2166 Silverest Ave Baton Rouge, LA | 3.0 | 2.0 | 1640 | $1,800 | $1.10 | 23d | 1 | 0.55mi |
| 3237 Toulon Dr Apt 7 Baton Rouge, LA | 2.0 | 1.5 | 1100 | $875 | $0.80 | 43d | 1 | 0.59mi |
| 3484 Cedarcrest Ave Baton Rouge, LA | 1.0–3.0 | 1.0–2.0 | 937 | $1,122 | $1.20 | 23d | 1 | 0.65mi |
| 10127 Runnymede Ave Baton Rouge, LA | 3.0 | 2.0 | 2071 | $1,900 | $0.92 | 19d | 1 | 0.65mi |
| 10127 Runnymede Ave Baton Rouge, LA | 3.0 | 2.5 | 2071 | $1,900 | $0.92 | 43d | 1 | 0.65mi |
| 11151 Stanley Aubin Ln Baton Rouge, LA | 3.0 | 2.0 | 1265 | $1,450 | $1.15 | 43d | 1 | 0.67mi |
| 10642 Stanley Aubin Ln Unit C Baton Rouge, LA | 2.0 | 1.5 | 1050 | $900 | $0.86 | 43d | 1 | 0.72mi |
| 10245 Airline Hwy Baton Rouge, LA | 1.0–2.0 | 1.0–2.0 | 898 | $1,469 | $1.63 | 14d | 14 | 0.79mi |
| 2001 Red Stick Dr Baton Rouge, LA | 3.0 | 3.0 | 1559 | $2,150 | $1.38 | 23d | 1 | 0.91mi |
| 9855 Red Stick Crossing Ave Baton Rouge, LA | 3.0 | 2.5 | 1454 | $2,100 | $1.44 | 43d | 1 | 0.92mi |
| 11888 Old Hammond Hwy Baton Rouge, LA | 2.0–4.0 | 1.0–2.0 | 1028 | $995 | $0.97 | 43d | 1 | 0.96mi |
| 10318 Celtic Dr Baton Rouge, LA | 1.0–3.0 | 1.0–2.5 | 990 | $1,213 | $1.22 | 14d | 16 | 1.10mi |
| 10286 W Winston Ave Baton Rouge, LA | 2.0 | 1.5 | 1150 | $1,195 | $1.04 | 43d | 1 | 1.14mi |
| 1860 Boulevard de Province Baton Rouge, LA | 1.0–3.0 | 1.0–2.0 | 1095 | $1,150 | $1.05 | 43d | 1 | 1.15mi |
| 3445 Bluebonnet Blvd Baton Rouge, LA | 1.0–3.0 | 1.0–2.0 | 1105 | $1,888 | $1.71 | 14d | 10 | 1.18mi |
| 1855 Boulevard de Province Baton Rouge, LA | 1.0–2.0 | 1.0–2.0 | 880 | $975 | $1.11 | 43d | 1 | 1.28mi |
| 2424 Drusilla Ln Baton Rouge, LA | 1.0–3.0 | 1.0–2.0 | 1039 | $1,096 | $1.06 | 14d | 13 | 1.28mi |
| 3938 Garden View Dr Baton Rouge, LA | 3.0 | 2.0 | 1620 | $2,000 | $1.23 | 21d | 1 | 1.30mi |
| 1795 Boulevard de Province Unit A Baton Rouge, LA | 2.0 | 2.5 | 1109 | $1,250 | $1.13 | 43d | 1 | 1.30mi |
| 1919 Boulevard de Province Baton Rouge, LA | 1.0–2.0 | 1.0–2.0 | 1082 | $946 | $0.87 | 14d | 31 | 1.30mi |
| 1411 Cottondale Dr Apt C Baton Rouge, LA | 3.0 | 2.0 | 1100 | $1,000 | $0.91 | 43d | 1 | 1.31mi |
| 1735 Boulevard de Province Baton Rouge, LA | 2.0 | 2.5 | 1160 | $1,100 | $0.95 | 43d | 1 | 1.32mi |
| 10111 Jefferson Hwy Baton Rouge, LA | 3.0 | 2.5 | 1877 | $2,100 | $1.12 | 23d | 1 | 1.32mi |
| 4188 Jefferson Woods Dr Baton Rouge, LA | 2.0 | 1.5 | 1200 | $1,800 | $1.50 | 43d | 1 | 1.34mi |
| 1781 Boulevard de Province Unit D Baton Rouge, LA | 2.0 | 2.5 | 1260 | $1,100 | $0.87 | 43d | 1 | 1.34mi |
| 1783 Boulevard De Province Unit C Baton Rouge, LA | 2.0 | 2.5 | 1100 | $1,075 | $0.98 | 43d | 1 | 1.34mi |
| 9540 Lindale Ave Unit A Baton Rouge, LA | 3.0 | 2.5 | 1655 | $1,900 | $1.15 | 23d | 1 | 1.34mi |
| 814 Lonita St Baton Rouge, LA | 3.0 | 2.0 | 1678 | $1,900 | $1.13 | 23d | 1 | 1.35mi |
| 1755 Boulevard De Province Unit A Baton Rouge, LA | 2.0 | 2.5 | 1100 | $900 | $0.82 | 23d | 1 | 1.39mi |
| 1761 Boulevard De Province Unit D Baton Rouge, LA | 2.0 | 2.5 | 1123 | $1,100 | $0.98 | 43d | 1 | 1.39mi |
| 9925 Jefferson Hwy Baton Rouge, LA | 2.0 | 2.5 | 1458 | $1,900 | $1.30 | 14d | 1 | 1.41mi |
| 4630 Southpark Dr Baton Rouge, LA | 3.0 | 2.0 | 1364 | $1,400 | $1.03 | 23d | 1 | 1.41mi |
| 3098 Drusilla Ln Baton Rouge, LA | 3.0 | 1.5 | 1537 | $1,600 | $1.04 | 43d | 1 | 1.46mi |
HOA detail
- Monthly dues
- $229 · $2,748/yr
- Likely covers
- pool
Listing history 47 events
-
2026-06-18days on market $126,000 Active 45 DOM
-
2026-06-17days on market $126,000 Active 44 DOM
-
2026-06-16days on market $126,000 Active 43 DOM
-
2026-06-15days on market $126,000 Active 42 DOM
-
2026-06-14pricedays on market $126,000 Active 40 DOM
-
2026-06-10days on market $130,000 Active 37 DOM
-
2026-06-09days on market $130,000 Active 36 DOM
-
2026-06-08days on market $130,000 Active 35 DOM
-
2026-06-07days on market $130,000 Active 34 DOM
-
2026-06-05days on market $130,000 Active 31 DOM
-
2026-06-03days on market $130,000 Active 30 DOM
-
2026-06-02days on market $130,000 Active 29 DOM
-
2026-06-01days on market $130,000 Active 28 DOM
-
2026-05-31days on market $130,000 Active 27 DOM
-
2026-05-31days on market $130,000 Active 26 DOM
-
2026-05-01$130,000 Active 613-char remark
Show marketing remark (613 chars)
Located on a nice big lake for your evening enjoyment. Seat out and watch sun sets and sunrises from the benches located around the lake area. Sidewalks for strolling the community and enjoying the beauty. Fishing is fine, must be resident to the community, you must release them back. No paddle boats or boats of any kind. This townhome has been rental for present owner and could be for you as well. Owner is selling "AS IS", there are some things that need some TLC, so please preview well. Community pool for your enjoyment and now is the perfect time to become the new owner of the lovely townhome.
-
2023-05-26historical
-
2023-04-14historical
-
2023-03-24status Active
-
2023-02-14status Pending
-
2023-02-06$165,000 Active
-
2023-02-06$165,000
-
2018-06-01soldstatus
-
2018-05-04$1,200
-
2017-06-14historical
-
2017-06-05price $150,000
-
2017-03-03price $157,000
-
2016-09-30$165,000 Active
-
2016-09-29$150,000
-
2014-12-29soldstatus $147,500
-
2013-01-02soldstatus $138,300
-
2012-09-10$149,750
-
2012-05-21$159,900
-
2012-05-21$159,900
-
2011-06-06$145,000
-
2011-06-06$145,000
-
2011-06-01$145,000
-
2011-06-01$145,000
-
2009-10-26$158,500
-
2009-10-26$158,500
-
2009-10-05$1,150
-
2007-01-18$2,000
-
2005-11-03soldstatus $119,900
-
2005-01-07$119,900
-
2004-09-16$119,900
-
2004-09-16$119,900
ⓘ Source: listings_history table (triggers on properties + properties_extension) + one-shot
backfill from property_details.listing_events for pre-trigger history.
Tax reassessment forecast LA · Resets to sale price
- Current annual tax
- $2,134 · $178/mo
- Projected year-2 tax
- $2,134 · $178/mo
- Expected delta
- $0/yr ($0/mo · 0.0%)
ⓘ Screening estimate from a state-policy table — verify with the county assessor before closing.
Climate risk First Street
- Flood 4/10 Moderate FEMA zone X · 20% chance over 30 yrs
- Wildfire 1/10 Low
- Heat 8/10 Severe 7 d/yr ≥108°F today · 20 d/yr by 30 yrs out
- Wind 9/10 Extreme 99% chance of damaging wind over 30 yrs
- Air quality 3/10 Moderate 3 unhealthy d/yr today · 3 by 30 yrs out
Nearby sold comps map
Loading sold comps map…
Walkable amenities ~0.75 mi
Loading nearby amenities…
Taxation est. · year 1
- Rental income
- $17,793
- − Mortgage interest
- −$7,058
- − Property taxes
- −$2,134
- − Insurance
- −$630
- − Repairs & maintenance
- −$1,423
- − Management
- −$1,423
- − HOA
- −$2,748
- − Depreciation
- −$3,665
- Taxable loss
- −$1,289
- Est. tax savings @ 24.0%
- +$309
- After-tax cash flow
- $925/yr
For passive investors: Depreciation is non-cash, so a rental often shows a tax loss while cash-flowing — sheltering income. Rental losses are passive: they offset passive income freely, and up to $25,000/yr can offset ordinary (W-2) income if you actively participate and your MAGI is under $100k (phasing out to $0 by $150k); unused losses carry forward. On sale, claimed depreciation is recaptured at up to 25%, and gains may owe capital-gains tax (a 1031 exchange can defer both). Figures are a year-1 estimate at your 24.0% rate — not tax advice; consult a CPA.
Schools (NCES district)
- District
- East Baton Rouge Parish
- NCES district ID
- 2200540
- Math proficiency
- 22% ▼ -36.00%
- Reading proficiency
- 34% ▼ -31.00%
- Median HH income
- $46,263
- Composite
- 24.14/100
- National rank
- #7745
- State rank
- #47 of 98 in LA
Livability — Baton Rouge
- Score
- 74/100
- State rank
- #24
- US rank
- #4535
Category grades
Schools grade is shown separately in the Schools card above.
Census & demographics
- Census place
- Baton Rouge, LA
- County
- East Baton Rouge Parish · 399,686 people
- City population
- 351,868
- Metro
- Baton Rouge, LA
- Population (ZIP)
- 45,718
- Household income
- $67,353
- Rent vs Own
- Severe rent burden
- 2162.0
Population outlook (East Baton Rouge County) Hauer SSP2
- Today (2025)
- 464,810 people
- By 2030
- 472,137 · +1.6%
- By 2040
- 480,243 · +3.3%
- By 2050
- 484,422 · +4.2%
- By 2075
- 492,069 · +5.9%
- By 2100
- 476,347 · +2.5%
Race, ethnicity, and origin ACS 2023
- Neighborhood character
- Diverse neighborhood (Simpson 0.67)
- Race & ethnicity
- Black 41% White 38% Hispanic / Latino 11% Two or more races 7% Asian 5%
- Hispanic origin (detail)
- Mexican 3%
- Common ancestry
- Lithuanian 7% Italian 1% Hispanic 1%
- Foreign-born
- 11% · Canada, China, Vietnam
- Languages at home
- 86% English-only · Spanish 9% Chinese 1% Other Indo-European 1%
Political lean MEDSL · East Baton Rouge
- 2024 margin
- D (+11.1) · D 54.5% · R 43.4% · Other 2.1%
- 2008→2024 swing
- +8.9pp toward D · 2008: 2.2pp · 2024: 11.1pp
- All cycles
- 2024: D+11.1 2020: D+13.1 2016: D+9.2 2012: D+5.2 2008: D+2.2
Not yet ingested
- Civics
- —
Market trends
- HPI YoY
- ▼ -161.21%
- Current HPI
- 157.3823
- Rent YoY
- ▲ 0.16%
- Metro
- Baton Rouge, LA
- State GDP YoY
- ▲ 3.29%
- F500 in state
- 10
Industry mix (Fortune 500 HQ in LA)
| Industry | F500 HQs | Revenue |
|---|---|---|
| Telecommunications | 2 | $23B |
|
||
| Utilities | 1 | $12B |
|
||
| Wholesale / Distribution | 1 | $5B |
|
||
| Advertising | 1 | $2B |
|
||
Price history
+5.1% since first listed34 events — show timeline
- 2026-06-12 Price Changed $126,000 AcadianaMLS
- 2026-06-12 Price Changed $126,000 GBRMLS
- 2026-05-01 Listed $130,000 GBRMLS
- 2026-05-01 Listed $130,000 AcadianaMLS
- 2023-05-26 Rental Removed — RENT.
- 2023-04-14 Delisted — GBRMLS
- 2023-03-24 Relisted — GBRMLS
- 2023-02-14 Pending — GBRMLS
- 2023-02-06 Listed $165,000 AcadianaMLS
- 2023-02-06 Listed $165,000 GBRMLS
- 2018-06-01 Sold (MLS) — GBRMLS
- 2018-05-04 Listed $1,200 GBRMLS
- 2017-06-14 Delisted — GBRMLS
- 2017-06-05 Price Changed $150,000 GBRMLS
- 2017-03-03 Price Changed $157,000 GBRMLS
- 2016-09-30 Listed $165,000 GBRMLS
- 2016-09-29 Listed $150,000 AcadianaMLS
- 2014-12-29 Sold (Public Records) $147,500 Public Records
- 2013-01-02 Sold (Public Records) $138,300 Public Records
- 2012-09-10 Listed $149,750 AcadianaMLS
- 2012-05-21 Listed $159,900 AcadianaMLS
- 2012-05-21 Listed $159,900 GBRMLS
- 2011-06-06 Listed $145,000 AcadianaMLS
- 2011-06-06 Listed $145,000 GBRMLS
- 2011-06-01 Listed $145,000 GSREIN
- 2011-06-01 Listed $145,000 AcadianaMLS
- 2009-10-26 Listed $158,500 AcadianaMLS
- 2009-10-26 Listed $158,500 GBRMLS
- 2009-10-05 Listed $1,150 GBRMLS
- 2007-01-18 Listed $2,000 GBRMLS
- 2005-11-03 Sold (Public Records) $119,900 Public Records
- 2005-01-07 Listed $119,900 AcadianaMLS
- 2004-09-16 Listed $119,900 AcadianaMLS
- 2004-09-16 Listed $119,900 GBRMLS
Property tax history
+9.9%/yrLatest (2025): $2,134 · +4.7% YoY. Source: county tax records.
Cash-flow waterfall
monthlySold comps — $/sqft
last 12 mo · ≤1 miLoading sold comps…