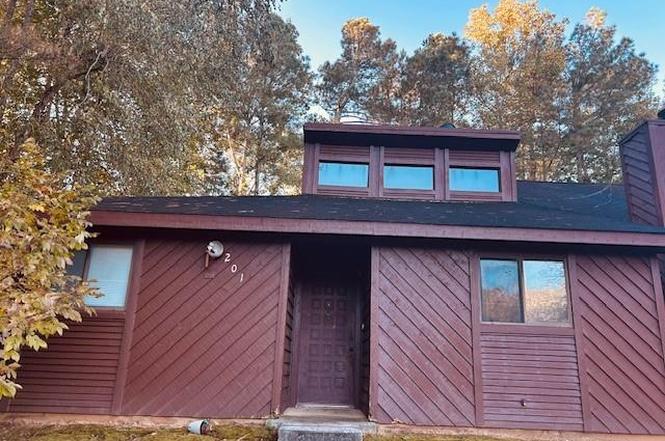
201 Rock Knoll Dr · Greenwood, SC
Flood risk 1/10 · Minimal
- FEMA flood zone
- X (unshaded)
- Chance of flooding over 30 yrs
- 0.0%
- Est. flood insurance / yr
- $507 – $1,088
Fire risk 3/10 · Minor
- Est. fire insurance / yr
- $783 – $1,453
Heat risk 6/10 · Moderate
- Hot days now (above 105°F)
- 7 days/yr
- Hot days in 30 yrs
- 17 days/yr
Wind risk 6/10 · Moderate
- Chance of severe wind over 30 yrs
- 27.0%
Air-quality risk 4/10 · Minor
- Unhealthy air days now
- 4 days/yr
- Unhealthy air days in 30 yrs
- 4 days/yr
Risk factors via First Street. Map © Google.
Why this score? — see what drove the B- grade
The composite is a weighted blend of 9 inputs, each scored 0–100. Each bar is that input's sub-score; the figure is the points it added to the 100-point composite (weight × sub-score).
- Cash flow +25.7/30.0
- ARV discount +15.0/15.0
- 1% rule +8.6/10.0
- DSCR +8.6/10.0
- Livability +3.2/5.0
- Schools +2.9/10.0
- Rent growth +2.5/5.0
- Condition / age +2.5/5.0
- Appreciation +0.0/10.0
$121,900
🖨 Deal sheet 📄 Offer letter ✓ Due diligence
Listing remarks
BACK ON THE MARKET WITH A NEW ROOF AND A PRICE REDUCTION! This one level townhome is located on the north end of Greenwood in an established neighborhood. Looking to avoid lawn care and exterior upkeep? This is the place for you. The living area is open an expansive, and has a fireplace for your enjoyment. Enjoy grilling, leisure, and relaxation on your quiet back patio. Lawn care and exterior maintenance are included, so you can keep your cost (and stress) down. Rock Knoll is very close to shopping and dining, but far enough away to maintain your peace and quiet. Don't wait - set up your showing today!
Key facts
- Included lawn care
- Quiet back patio
- One level townhome
Tags
Property features AI
Finance
- HOA & community: Homeowners association with a $110 monthly fee
Exterior
- Utilities: Connected to sewer
- Home design: Residential townhouse
- Construction: Slab foundation
- Exterior features: Wood fencing
Interior
- Kitchen: Microwave
- Flooring: Laminate
- Bathrooms: 2 full bathrooms
- Heating & cooling: Central air conditioning; Electric heating
- Interior features: Microwave; Laminate flooring
Neighborhood map
What this means for you Summary
Snapshot
- This is a 2-bed/2.0-bath townhouse listed at $122k.
Deal economics
- At list price, monthly cash flow is $293 ($4k/yr) — positive.
- The deal already cash-flows at list — no discount required.
- Meets the 1% rule at list price ($2k rent vs $122k).
- Recommended offer: $107k (12.0% below list) — sets the bar for market timing.
- Cap rate 9.2% vs local median 3.6% in Greenwood — top-decile yield for the area; either an underpriced asset or a hidden risk that comps aren't pricing in. Stress-test before assuming the spread holds.
Location & tenants
- Location reads 63/100 on livability (#167 in SC) — a middle-class / working-renter tenant base. Strengths: cost of living A+, health & safety A+, housing A; Watch: amenities D, schools F, crime F.
- Greenwood 50 (town): math 31% / reading 39% proficiency, ranked #43 of 80 in SC (top 54%) — families likely to look elsewhere, expect single-tenant / working-renter base with shorter leases.
- Market conditions: 253 active listings in the ZIP; 193 units permitted in Greenwood County in 2024 (0 in 5+ unit buildings).
- This rent runs 37% of the median local income ($55k/yr) — at the standard rent-burdened threshold; future hikes will face affordability resistance.
Forward outlook
- Local home prices are declining (-3.0%/yr); year-one equity from $843 of loan paydown is wiped out by about $4k of value loss. Plan a longer hold.
- Greenwood County population projected to shrink 8% by 2050 — rents likely to lag national; underwrite the cash flow, not the appreciation.
Negotiation context
- It's been on market 151 days — a 12% lower offer ($107k) is reasonable based on typical stale-listing flexibility.
- 2 sale attempts; this cycle's ask has dropped $13k (10%) from the opening price — seller is motivated, your offer sets the floor, not the list.
Risks & watch-outs
- Climate carrying-cost: major wind risk, 27% chance of damaging wind over 30y; extreme-heat days projected 7→17/yr by 2055 (HVAC capex compounding) — expect insurance premiums to compound above CPI over the hold.
Questions for the listing agent
- It's been on market 151 days. Have you received any prior offers? Is the seller open to a 12% concession, seller financing, or rate buy-down credit?
- What does the HOA fee cover, when was the last increase, and are there any pending special assessments or reserve-fund shortfalls?
- Why hasn't it sold? Are there any deal-killer items the seller is aware of (foundation, flood, title, zoning, code violations)?
- Is there a deadline driving the sale (1031 exchange, divorce, estate, relocation)? That informs how much negotiation room exists.
- Schools are F-rated, which usually means shorter tenancies and higher turnover. Who's the typical renter profile here, and what's been the actual vacancy rate?
- Crime grade is F in this area — have there been break-ins, vandalism, or insurance claims at this property in the last 3 years? What carrier currently insures it and at what premium?
- What's the average days-on-market for RENTAL listings here right now (not sales)? A rising rental-DOM trend means longer vacancies and softer asking-rent achievability than the comps imply.
- What's the recent tenant-quality profile in this submarket — average credit score on applications, eviction rate, late-payment / NSF rate, and stable-employment percentage? A property-management company in the area should have these aggregated.
- How much new for-sale + rental construction is in the pipeline within 1–3 miles? Heavy new supply typically softens prices + rents 12–24 months out; constrained supply supports both.
Investment metrics
- 1% rule
- 1.36% ✓
- Cap rate
- 9.18%
- Cash-on-cash
- 10.30%
- DSCR
- 1.46
- GRM
- 6.1
CMA / ARV
- ARV (on-the-fly)
- $155,232
- Comps found
- 12
Show comp detail 12 sales within ~0.75 mi
| Address | Dist | Beds/Ba | Sqft | Sold | Price | $/sf | Match |
|---|---|---|---|---|---|---|---|
| 216 Rock Knoll Dr | 0.07mi | 2/2.0 | 1,176 (0%) | 13mo | $140,000 | $119 | 86 |
| 315 Rock Knoll Dr | 0.14mi | 2/2.0 | 1,176 (0%) | 12mo | $150,000 | $128 | 84 |
| 323 E Rock Knl | 0.13mi | 2/2.0 | 1,137 (-3%) | 14mo | $145,000 | $128 | 77 |
| 303 #6 Haltiwanger Rd | 0.11mi | 2/1.5 | 1,050 (-11%) | 17mo | $107,000 | $102 | 61 |
| 303 Haltiwanger Unit 5 Rd | 0.11mi | 2/1.5 | 1,080 (-8%) | 23mo | $94,000 | $87 | 60 |
| 118 Ansley Ct | 0.60mi | 2/2.0 | 1,092 (-7%) | 2mo | $171,000 | $157 | 58 |
| 101 Saint Kitts Ct | 0.45mi | 2/2.0 | 1,106 (-6%) | 18mo | $145,900 | $132 | 54 |
| 135 Saint Kitts Ct | 0.40mi | 2/2.0 | 1,092 (-7%) | 20mo | $144,000 | $132 | 53 |
| 104 Hailey Ct | 0.66mi | 2/2.0 | 1,096 (-7%) | 16mo | $150,000 | $137 | 45 |
| 107 Rhett Ct | 0.64mi | 3/2.0 (+1) | 1,247 (+6%) | 14mo | $177,000 | $142 | 44 |
| 103 Wisteria Ct | 0.66mi | 2/2.0 | 1,092 (-7%) | 16mo | $157,000 | $144 | 43 |
| 114 Karlie Ct | 0.33mi | 2/2.0 | 1,000 (-15%) | 23mo | $150,000 | $150 | 41 |
Match score weights: distance 35% · size 25% · config 20% · recency 20%. Top-matched comps best support the ARV.
Projected returns pro-forma
-3.0% appreciation · 3.0% rent growth · sell at horizon
- IRR
- -0.7%
- Equity multiple
- 0.97×
- Total profit
- $-968
- Equity at exit
- $18,176
- IRR
- 9.0%
- Equity multiple
- 1.69×
- Total profit
- $23,717
- Equity at exit
- $10,540
Cash invested: $34,132 (down + closing). Projections, not guarantees.
Landlord ↔ Tenant lean methodology
- Overall (STATE)
- 90 Strongly Landlord-Friendly
- State South Carolina
- 90 Strongly Landlord-Friendly · R+6
- County
- — inherits STATE
- City
- — inherits STATE
ZIP-level market 29649
- Active inventory
- 253
- Price-to-rent
- 6.1×
Monthly cashflow live
- Estimated rent
- $1,661 medium interval (Pro) →
- Mortgage (P&I)
- −$639
- Tax from tax record
- −$220 /mo · $2,635/yr
- Insurance
- −$51
- HOA
- −$110
- Vacancy / Maint / Mgmt
- −$349
- Net cashflow
- $293
Break-even live
UW: 25.0% down · 7.5% · 30yr · 1.5% tax · 5.0% vac · 8.0% maint · 8.0% mgmt
Financing live
Cash to close
- Down payment
- $30,475
- Closing costs
- $3,657
- Reserves months
- —
- Total cash needed
- —
Loan-product check · same deal, 3 products live
Conventional
25% down · 7.5% · 30yr
- Down + closing
- —
- Monthly P&I
- —
- Monthly cashflow
- —
- DSCR
- —
- Eligible?
- —
Personal DTI + credit; lowest rate.
DSCR
20% down · 8.5% · 30yr
- Down + closing
- —
- Monthly P&I
- —
- Monthly cashflow
- —
- DSCR
- —
- Eligible?
- —
No personal income docs; deal must DSCR.
Hard money
10% down · 12.0% · 12mo
- Down + closing
- —
- Monthly P&I
- —
- Monthly cashflow
- —
- DSCR
- —
- Eligible?
- —
Short-term bridge; refi at stabilization.
HOA detail
- Monthly dues
- $110 · $1,320/yr
- Likely covers
- landscapingexterior maint.
Listing history 7 events
-
2026-05-14status Pending
-
2026-04-18status Active
-
2026-04-18price $121,900
-
2026-02-26historical
-
2026-01-05price $125,900
-
2025-12-11price $129,900
-
2025-10-24$134,900 Active
ⓘ Source: listings_history table (triggers on properties + properties_extension) + one-shot
backfill from property_details.listing_events for pre-trigger history.
Tax reassessment forecast SC · Resets to sale price
- Current annual tax
- $2,635 · $220/mo
- Projected year-2 tax
- $2,635 · $220/mo
- Expected delta
- $0/yr ($0/mo · 0.0%)
ⓘ Screening estimate from a state-policy table — verify with the county assessor before closing.
Climate risk First Street
- Flood 1/10 Low FEMA zone X (unshaded) · 0% chance over 30 yrs
- Wildfire 3/10 Moderate
- Heat 6/10 Major 7 d/yr ≥105°F today · 17 d/yr by 30 yrs out
- Wind 6/10 Major 27% chance of damaging wind over 30 yrs
- Air quality 4/10 Moderate 4 unhealthy d/yr today · 4 by 30 yrs out
Nearby sold comps map
Loading sold comps map…
Walkable amenities ~0.75 mi
Loading nearby amenities…
Taxation est. · year 1
- Rental income
- $19,936
- − Mortgage interest
- −$6,828
- − Property taxes
- −$2,635
- − Insurance
- −$610
- − Repairs & maintenance
- −$1,595
- − Management
- −$1,595
- − HOA
- −$1,320
- − Depreciation
- −$3,546
- Taxable income
- $1,807
- Est. tax owed @ 24.0%
- −$434
- After-tax cash flow
- $3,080/yr
For passive investors: Depreciation is non-cash, so a rental often shows a tax loss while cash-flowing — sheltering income. Rental losses are passive: they offset passive income freely, and up to $25,000/yr can offset ordinary (W-2) income if you actively participate and your MAGI is under $100k (phasing out to $0 by $150k); unused losses carry forward. On sale, claimed depreciation is recaptured at up to 25%, and gains may owe capital-gains tax (a 1031 exchange can defer both). Figures are a year-1 estimate at your 24.0% rate — not tax advice; consult a CPA.
Schools (NCES district)
- District
- Greenwood 50
- NCES district ID
- 4502340
- Math proficiency
- 31% ▼ -4.00%
- Reading proficiency
- 39% ▲ 2.00%
- Median HH income
- $37,663
- Composite
- 29.14/100
- National rank
- #6585
- State rank
- #43 of 80 in SC
Livability — Greenwood
- Score
- 63/100
- State rank
- #167
- US rank
- #15097
Category grades
Schools grade is shown separately in the Schools card above.
Census & demographics
- Census place
- Greenwood, SC
- County
- Greenwood County · 26,275 people
- City population
- 26,275
- Metro
- Greenwood, SC
- Population (ZIP)
- 26,275
- Household income
- $54,585
- Rent vs Own
- Severe rent burden
- 566.0
Population outlook (Greenwood County) Hauer SSP2
- Today (2025)
- 69,627 people
- By 2030
- 68,905 · -1.0%
- By 2040
- 66,640 · -4.3%
- By 2050
- 63,768 · -8.4%
- By 2075
- 55,769 · -19.9%
- By 2100
- 47,293 · -32.1%
Race, ethnicity, and origin ACS 2023
- Neighborhood character
- Predominantly White (65%)
- Race & ethnicity
- White 65% Black 25% Hispanic / Latino 4% Two or more races 4% Asian 2%
- Common ancestry
- Serbian 3% Italian 3% Slovak 3%
- Foreign-born
- 4% · Canada, China
- Languages at home
- 97% English-only · Spanish 2%
Political lean MEDSL · Greenwood
- 2024 margin
- Strong R (+29.0) · D 34.9% · R 63.8% · Other 1.3%
- 2008→2024 swing
- -13.3pp toward R · 2008: -15.7pp · 2024: -29.0pp
- All cycles
- 2024: R+29.0 2020: R+22.8 2016: R+21.8 2012: R+15.4 2008: R+15.7
Not yet ingested
- Civics
- —
Market trends
- HPI YoY
- ▼ -128.00%
- Current HPI
- 167.9262
- Rent YoY
- —
- Metro
- Greenwood, SC
- State GDP YoY
- ▲ 4.51%
- F500 in state
- 2
Industry mix (Fortune 500 HQ in SC)
| Industry | F500 HQs | Revenue |
|---|---|---|
| Packaging | 1 | $7B |
|
||
Price history
-9.6% since first listed7 events — show timeline
- 2026-05-14 Pending — GAOR
- 2026-04-18 Relisted — GAOR
- 2026-04-18 Price Changed $121,900 GAOR
- 2026-02-26 Delisted — GAOR
- 2026-01-05 Price Changed $125,900 GAOR
- 2025-12-11 Price Changed $129,900 GAOR
- 2025-10-24 Listed $134,900 GAOR
Property tax history
+2.4%/yrLatest (2025): $2,635 · +34.8% YoY. Source: county tax records.
Cash-flow waterfall
monthlySold comps — $/sqft
last 12 mo · ≤1 miLoading sold comps…