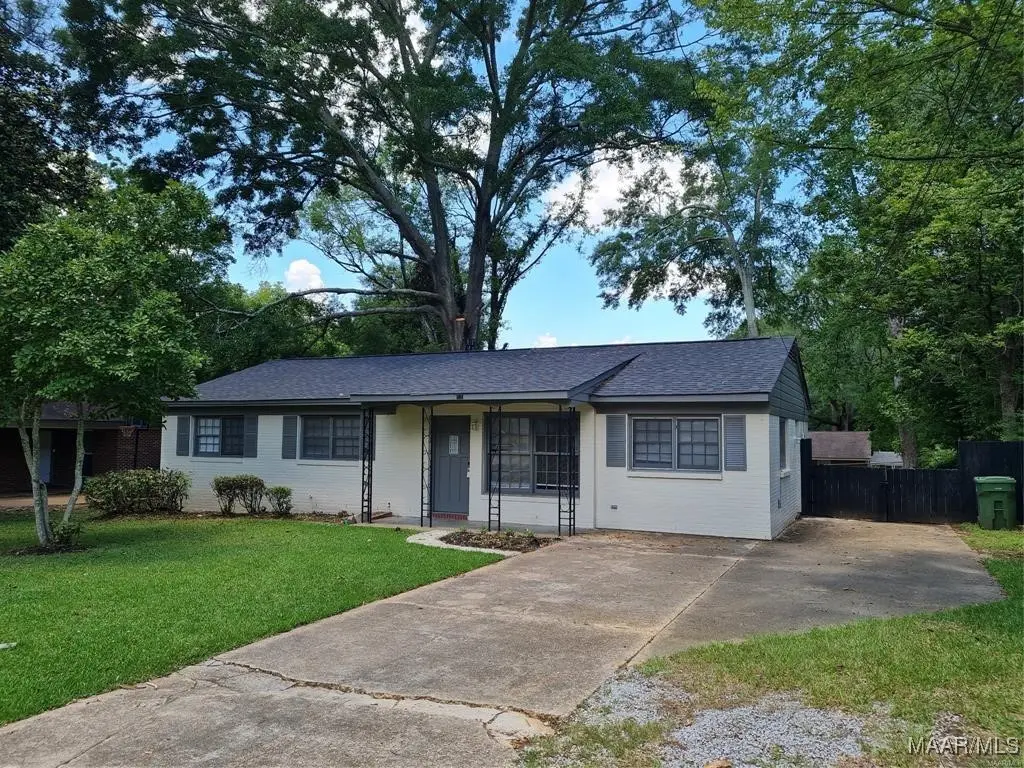
1128 Karen Rd · Montgomery, AL
Flood risk 1/10 · Minimal
- FEMA flood zone
- X (unshaded)
- Chance of flooding over 30 yrs
- 0.0%
- Est. flood insurance / yr
- $507 – $1,088
Fire risk 3/10 · Minor
- Est. fire insurance / yr
- $916 – $1,700
Heat risk 7/10 · Major
- Hot days now (above 107°F)
- 7 days/yr
- Hot days in 30 yrs
- 19 days/yr
Wind risk 8/10 · Major
- Chance of severe wind over 30 yrs
- 80.0%
Air-quality risk 3/10 · Minor
- Unhealthy air days now
- 4 days/yr
- Unhealthy air days in 30 yrs
- 4 days/yr
Risk factors via First Street. Map © Google.
Why this score? — see what drove the C+ grade
The composite is a weighted blend of 9 inputs, each scored 0–100. Each bar is that input's sub-score; the figure is the points it added to the 100-point composite (weight × sub-score).
- Cash flow +27.1/30.0
- DSCR +9.4/10.0
- ARV discount +8.9/15.0
- 1% rule +6.6/10.0
- Rent growth +3.2/5.0
- Livability +3.2/5.0
- Condition / age +2.5/5.0
- Schools +1.7/10.0
- Appreciation +0.0/10.0
$130,000
🖨 Deal sheet (PDF) 📄 Offer letter ✓ Due diligence
Listing remarks MLS
Great investment opportunity! Home has a section8 tenant lined up for $1,280.00 a month. All 7 properties can be purchased for $750,000. Looking for a home with NO CARPET?! You've found it! Luxury vinyl plank floors throughout, huge laundry room, and fresh paint. Best of all is the proximity to shopping, interstate and restaurants!. Fully fenced yard with lots of mature trees for shade. The tenant pays for all utilities, pest control, yard maintenance and air filters. Owner has 7 houses that can be purchased as a bundle for $750,000 (6 our tenant occupied). Roof 5 years old, HVAC 7 years old.
Key facts
- Huge laundry room
- Fully fenced yard
- 0.28 acre lot
Tags
Neighborhood map
What this means for you Summary
Snapshot
- This is a 4-bed/1.0-bath single-family listed at $130k.
Deal economics
- At list price, monthly cash flow is $369 ($4k/yr) — positive.
- The deal already cash-flows at list — no discount required.
- Meets the 1% rule at list price ($2k rent vs $130k).
- Recommended offer: $114k (12.0% below list) — sets the bar for market timing.
- Cap rate 9.7% vs local median 6.0% in Montgomery — top-decile yield for the area; either an underpriced asset or a hidden risk that comps aren't pricing in. Stress-test before assuming the spread holds.
Location & tenants
- Location reads 65/100 on livability (#138 in AL) — a middle-class / working-renter tenant base. Strengths: cost of living A+, housing A+; Watch: employment D, crime F, amenities D-.
- Montgomery County (urban): math 9% / reading 31% proficiency, ranked #106 of 129 in AL (top 82%) — low school quality limits family demand, transient renter base, plan for 1-2y turnover; 70% free/reduced lunch — lower-income household profile, screen leases tightly.
- Zoned schools: Flowers Elementary School (math 2% / reading 27%, grade F, #508 of 627 statewide, top 84%, 394 students, 74% FRL); Goodwyn Middle School (math 0% / reading 16%, grade F, #239 of 257 statewide, top 93%, 808 students, 84% FRL); Lee High School (math 2% / reading 8%, grade F, #276 of 305 statewide, top 95%, 1,374 students, 86% FRL).
- Market conditions: Rents rising (+2.6%/yr); 209 active listings in the ZIP; 40 comparable units currently listed for rent nearby; rentals at typical pace (median 23d on market — plan ~3-4 weeks tenant-placement turnaround); 40% of comp listings sitting > 30 days — soft ceiling on asking rent; 460 units permitted in Montgomery County in 2024 (37 in 5+ unit buildings).
- This rent runs 31% of the median local income ($59k/yr) — at the standard rent-burdened threshold; future hikes will face affordability resistance.
Forward outlook
- Local home prices are declining (-3.0%/yr); year-one equity from $899 of loan paydown is wiped out by about $4k of value loss. Plan a longer hold.
- Montgomery County population projected to shrink 8% by 2050 — rents likely to lag national; underwrite the cash flow, not the appreciation.
- At projected returns (-3.0% appreciation + 2.6% rent growth), your $36k cash investment doubles in ~10 years — after that, you're playing with house money.
Negotiation context
- It's been on market 264 days — a 12% lower offer ($114k) is reasonable based on typical stale-listing flexibility.
- 5 sale attempts since 9y ago; this cycle's ask is 9900% above the opening price — seller raised mid-cycle; expect resistance to lowballs.
Risks & watch-outs
- Climate carrying-cost: severe wind risk, 80% chance of damaging wind over 30y; extreme-heat days projected 7→19/yr by 2055 (HVAC capex compounding) — expect insurance premiums to compound above CPI over the hold.
Questions for the listing agent
- It's been on market 264 days. Have you received any prior offers? Is the seller open to a 12% concession, seller financing, or rate buy-down credit?
- Built in 1960 — when were the roof, HVAC, electrical panel, plumbing, and water heater last replaced?
- Why hasn't it sold? Are there any deal-killer items the seller is aware of (foundation, flood, title, zoning, code violations)?
- Is there a deadline driving the sale (1031 exchange, divorce, estate, relocation)? That informs how much negotiation room exists.
- Crime grade is F in this area — have there been break-ins, vandalism, or insurance claims at this property in the last 3 years? What carrier currently insures it and at what premium?
- What's the average days-on-market for RENTAL listings here right now (not sales)? A rising rental-DOM trend means longer vacancies and softer asking-rent achievability than the comps imply.
- What's the recent tenant-quality profile in this submarket — average credit score on applications, eviction rate, late-payment / NSF rate, and stable-employment percentage? A property-management company in the area should have these aggregated.
- How much new for-sale + rental construction is in the pipeline within 1–3 miles? Heavy new supply typically softens prices + rents 12–24 months out; constrained supply supports both.
Investment metrics
- 1% rule
- 1.16% ✓
- Cap rate
- 9.70%
- Cash-on-cash
- 12.16%
- DSCR
- 1.54
- GRM
- 7.2
CMA / ARV
- ARV (median comp)
- $134,244
- List price
- $130,000
- Delta
- -3.16%
- Verdict
- FAIR
- Comps
- 20 within 1.0 mi
Show comp detail 12 sales within ~0.75 mi
| Address | Dist | Beds/Ba | Sqft | Sold | Price | $/sf | Match |
|---|---|---|---|---|---|---|---|
| 1232 Zephyr Hills Dr | 0.39mi | 4/2.0 | 1,497 (-3%) | 1mo | $128,675 | $86 | 72 |
| 1244 Zephyr Hills Dr | 0.37mi | 4/2.0 | 1,497 (-3%) | 7mo | $155,000 | $104 | 67 |
| 3221 Gatsby Ln | 0.51mi | 3/2.0 (-1) | 1,491 (-4%) | 0mo | $150,000 | $101 | 61 |
| 887 Greg Dr | 0.50mi | 3/2.0 (-1) | 1,492 (-4%) | 2mo | $150,000 | $101 | 60 |
| 1229 Karen Rd | 0.26mi | 4/2.0 | 1,344 (-13%) | 3mo | $92,000 | $68 | 59 |
| 809 Perry Hill Rd | 0.70mi | 3/1.0 (-1) | 1,545 (-0%) | 5mo | $85,000 | $55 | 58 |
| 3734 Duquesne Dr | 0.48mi | 3/2.0 (-1) | 1,644 (+6%) | 4mo | $170,000 | $103 | 55 |
| 3243 Durham Dr | 0.46mi | 4/2.0 | 1,363 (-12%) | 1mo | $150,000 | $110 | 54 |
| 753 Green Ridge Rd | 0.57mi | 3/2.0 (-1) | 1,634 (+6%) | 3mo | $163,600 | $100 | 52 |
| 1300 Zephyr Hills Dr | 0.36mi | 3/2.0 (-1) | 1,389 (-10%) | 6mo | $91,500 | $66 | 52 |
| 664 Joryne Dr | 0.69mi | 3/2.0 (-1) | 1,363 (-12%) | 1mo | $129,000 | $95 | 38 |
| 525 Avondale Rd | 0.66mi | 3/2.0 (-1) | 1,731 (+12%) | 6mo | $155,000 | $90 | 36 |
Match score weights: distance 35% · size 25% · config 20% · recency 20%. Top-matched comps best support the ARV.
Projected returns pro-forma
-3.0% appreciation · 2.65% rent growth · sell at horizon
- IRR
- 1.3%
- Equity multiple
- 1.05×
- Total profit
- $1,866
- Equity at exit
- $19,383
- IRR
- 10.6%
- Equity multiple
- 1.81×
- Total profit
- $29,614
- Equity at exit
- $11,240
Cash invested: $36,400 (down + closing). Projections, not guarantees.
Landlord ↔ Tenant lean methodology
- Overall (STATE)
- 90 Strongly Landlord-Friendly
- State Alabama
- 90 Strongly Landlord-Friendly · R+15
- County
- — inherits STATE
- City
- — inherits STATE
ZIP-level market 36109
- Home prices YoY
- -20.1%
- Rents YoY
- 2.6%
- Active inventory
- 209
- Price-to-rent
- 7.2×
Monthly cashflow live
- Estimated rent
- $1,513 high interval (Pro) →
- Mortgage (P&I)
- −$682
- Tax from tax record
- −$91 /mo · $1,092/yr
- Insurance
- −$54
- HOA
- −$0
- Vacancy / Maint / Mgmt
- −$318
- Net cashflow
- $369
Break-even live
Sensitivity live
| Price | -10% $442 | -5% $406 | +0% $369 | +5% $332 | +10% $295 |
|---|---|---|---|---|---|
| Rent | -10% $249 | -5% $309 | +0% $369 | +5% $428 | +10% $488 |
| Rate | -1.0pp $434 | -0.5pp $402 | base $369 | +0.5pp $335 | +1.0pp $301 |
UW: 25.0% down · 7.5% · 30yr · 1.5% tax · 5.0% vac · 8.0% maint · 8.0% mgmt
Financing live
Cash to close
- Down payment
- $32,500
- Closing costs
- $3,900
- Reserves months
- —
- Total cash needed
- —
Loan-product check · same deal, 3 products live
Conventional
25% down · 7.5% · 30yr
- Down + closing
- —
- Monthly P&I
- —
- Monthly cashflow
- —
- DSCR
- —
- Eligible?
- —
Personal DTI + credit; lowest rate.
DSCR
20% down · 8.5% · 30yr
- Down + closing
- —
- Monthly P&I
- —
- Monthly cashflow
- —
- DSCR
- —
- Eligible?
- —
No personal income docs; deal must DSCR.
Hard money
10% down · 12.0% · 12mo
- Down + closing
- —
- Monthly P&I
- —
- Monthly cashflow
- —
- DSCR
- —
- Eligible?
- —
Short-term bridge; refi at stabilization.
Rent comps 40 comps
| Address | Beds | Baths | Sqft | Rent | $/sqft | DOM | Units | Dist |
|---|---|---|---|---|---|---|---|---|
| 1117 Karen Rd Montgomery, AL | 3.0 | 1.0 | 1308 | $1,195 | $0.91 | 45d | 1 | 0.05mi |
| 1154 Lakewood Dr Montgomery, AL | 3.0 | 2.0 | 1066 | $1,350 | $1.27 | 45d | 1 | 0.11mi |
| 3359 Bedford Ln Montgomery, AL | 4.0 | 2.0 | 1786 | $1,600 | $0.90 | 15d | 1 | 0.17mi |
| 3346 Bedford Ln Montgomery, AL | 3.0 | 1.0 | 1134 | $1,295 | $1.14 | 15d | 1 | 0.20mi |
| 1216 Karen Rd Montgomery, AL | 3.0 | 2.0 | 1620 | $1,350 | $0.83 | 15d | 1 | 0.23mi |
| 3323 Bedford Ln Montgomery, AL | 3.0 | 2.0 | 1134 | $1,200 | $1.06 | 22d | 1 | 0.26mi |
| 1229 Karen Rd Montgomery, AL | 4.0 | 2.0 | 1344 | $1,590 | $1.18 | 45d | 1 | 0.27mi |
| 3318 Habersham Rd Montgomery, AL | 3.0 | 2.0 | 1134 | $1,250 | $1.10 | 15d | 1 | 0.30mi |
| 926 Green Ridge Ct Montgomery, AL | 3.0 | 2.0 | 1665 | $1,381 | $0.83 | 15d | 1 | 0.36mi |
| 844 Sir Michael Dr Montgomery, AL | 4.0 | 2.0 | 1502 | $1,650 | $1.10 | 45d | 1 | 0.37mi |
| 817 Dumont Dr Montgomery, AL | 3.0 | 2.0 | 1635 | $1,800 | $1.10 | 15d | 1 | 0.40mi |
| 1216 Beechdale Rd Montgomery, AL | 4.0 | 2.0 | 1495 | $1,325 | $0.89 | 45d | 1 | 0.45mi |
| 908 Greg Dr Montgomery, AL | 3.0 | 1.0 | 1520 | $1,100 | $0.72 | 22d | 1 | 0.46mi |
| 895 Greg Dr Montgomery, AL | 3.0 | 2.0 | 1489 | $1,600 | $1.07 | 15d | 1 | 0.50mi |
| 860 Greg Dr Montgomery, AL | 3.0 | 2.0 | 1400 | $1,295 | $0.93 | 15d | 1 | 0.55mi |
| 3136 Harrison Rd Montgomery, AL | 3.0 | 1.5 | 1355 | $1,025 | $0.76 | 45d | 1 | 0.59mi |
| 688 Joryne Dr Montgomery, AL | 3.0 | 2.0 | 1500 | $1,200 | $0.80 | 45d | 1 | 0.63mi |
| 1738 Fairforest Dr Montgomery, AL | 3.0 | 2.0 | 2166 | $1,895 | $0.87 | 45d | 1 | 0.69mi |
| 3309 Hillcrest Ln Unit 1043908P Montgomery, AL | 4.0 | 2.0 | 1625 | $2,885 | $1.78 | 22d | 1 | 0.73mi |
| 4041A Beth Manor Dr Montgomery, AL | 1.0–3.0 | 1.0–2.0 | 925 | $1,000 | $1.08 | 22d | 20 | 0.77mi |
| 3602 Little John Dr Montgomery, AL | 4.0 | 1.0 | 1286 | $1,400 | $1.09 | 22d | 1 | 0.82mi |
| 2736 Chevy Chase Dr Montgomery, AL | 3.0 | 1.0 | 1100 | $1,300 | $1.18 | 45d | 1 | 0.84mi |
| 750 S Marquette Dr Montgomery, AL | 3.0 | 1.0 | 1325 | $1,195 | $0.90 | 45d | 1 | 0.86mi |
| 3233 Hillcrest Ln Montgomery, AL | 3.0 | 2.0 | 1278 | $1,395 | $1.09 | 22d | 1 | 0.89mi |
| 1827 Pinecrest Dr Montgomery, AL | 4.0 | 3.0 | 1893 | $1,550 | $0.82 | 15d | 1 | 0.91mi |
| 3692 Fairfield Dr Montgomery, AL | 3.0 | 2.0 | 1524 | $1,400 | $0.92 | 22d | 1 | 0.94mi |
| 1814 Pinecrest Dr Montgomery, AL | 3.0 | 1.0 | 1053 | $990 | $0.94 | 45d | 1 | 0.95mi |
| 401 Ridgewood Ln Montgomery, AL | 3.0 | 2.0 | 1513 | $1,195 | $0.79 | 22d | 1 | 0.97mi |
| 311 Bradley Dr Montgomery, AL | 3.0 | 1.0 | 1104 | $825 | $0.75 | 45d | 1 | 1.01mi |
| 1814 Sylvan Dr Montgomery, AL | 3.0 | 2.0 | 1785 | $1,400 | $0.78 | 22d | 1 | 1.01mi |
| 572 Farmington Rd Montgomery, AL | 3.0 | 2.0 | 2106 | $1,495 | $0.71 | 45d | 1 | 1.03mi |
| 3352 Ridgefield Dr Montgomery, AL | 3.0 | 2.0 | 1932 | $1,761 | $0.91 | 22d | 1 | 1.03mi |
| 560 Farmington Rd Montgomery, AL | 4.0 | 2.0 | 2161 | $1,695 | $0.78 | 15d | 1 | 1.04mi |
| 1839 Robison Hill Rd Montgomery, AL | 4.0 | 2.0 | 1370 | $1,550 | $1.13 | 22d | 1 | 1.05mi |
| 118 Nottingham Ct Montgomery, AL | 3.0 | 2.0 | 1344 | $1,275 | $0.95 | 45d | 1 | 1.06mi |
| 3329 Vermont Dr Montgomery, AL | 3.0 | 1.5 | 1465 | $1,395 | $0.95 | 15d | 1 | 1.09mi |
| 3515 Cottonwood Dr Montgomery, AL | 3.0 | 1.5 | 1246 | $1,350 | $1.08 | 45d | 1 | 1.10mi |
| 239 Forest Hills Dr Montgomery, AL | 4.0 | 1.5 | 1500 | $1,450 | $0.97 | 22d | 1 | 1.13mi |
| 1516 Charleton Dr Montgomery, AL | 3.0 | 2.0 | 1895 | $1,650 | $0.87 | 45d | 1 | 1.14mi |
| 122 Oak Forest Dr Montgomery, AL | 3.0 | 1.0 | 1092 | $975 | $0.89 | 22d | 1 | 1.15mi |
Listing history 29 events
-
2026-06-21days on market $130,000 Active 264 DOM
-
2026-06-18days on market $130,000 Active 261 DOM
-
2026-06-17days on market $130,000 Active 260 DOM
-
2026-06-16days on market $130,000 Active 259 DOM
-
2026-06-15days on market $130,000 Active 258 DOM
-
2026-06-14days on market $130,000 Active 256 DOM
-
2026-06-13remarks 618-char remark
-
2026-06-13days on market $130,000 Active 255 DOM
-
2026-06-10days on market $130,000 Active 253 DOM
-
2026-06-09days on market $130,000 Active 252 DOM
-
2026-06-08days on market $130,000 Active 251 DOM
-
2026-06-07days on market $130,000 Active 250 DOM
-
2026-06-03days on market $130,000 Active 246 DOM
-
2026-06-02days on market $130,000 Active 245 DOM
-
2026-06-01days on market $130,000 Active 244 DOM
-
2026-05-31days on market $130,000 Active 243 DOM
-
2026-05-30days on market $130,000 Active 242 DOM
-
2026-02-27historical $1,300
-
2026-02-04$1,300
-
2025-09-30$130,000 Active 599-char remark
Show marketing remark (599 chars)
Great investment opportunity! Home has a section8 tenant lined up for $1,280.00 a month. All 7 properties can be purchased for $750,000. Looking for a home with NO CARPET?! You've found it! Luxury vinyl plank floors throughout, huge laundry room, and fresh paint. Best of all is the proximity to shopping, interstate and restaurants!. Fully fenced yard with lots of mature trees for shade. The tenant pays for all utilities, pest control, yard maintenance and air filters. Owner has 7 houses that can be purchased as a bundle for $750,000 (6 our tenant occupied). Roof 5 years old, HVAC 7 years old.
-
2024-07-20historical $1,300
-
2024-05-29$1,300
-
2023-06-07soldstatus $119,500
-
2023-06-05soldstatus $119,500 Closed 280-char remark
Show marketing remark (280 chars)
Wonderful MOVE IN READY home in desirable Lakeview Heights. Both the roof and A/C about 3 years old. Laminate flooring throughout. Fresh paint inside and outside painted 3 years ago. Nice bonus room on the back 4 bedrooms and 2 full baths. Stove and refrigerator to remain. Vacant
-
2023-05-20historical Contingent 280-char remark
Show marketing remark (280 chars)
Wonderful MOVE IN READY home in desirable Lakeview Heights. Both the roof and A/C about 3 years old. Laminate flooring throughout. Fresh paint inside and outside painted 3 years ago. Nice bonus room on the back 4 bedrooms and 2 full baths. Stove and refrigerator to remain. Vacant
-
2023-05-18$132,500 Active 280-char remark
Show marketing remark (280 chars)
Wonderful MOVE IN READY home in desirable Lakeview Heights. Both the roof and A/C about 3 years old. Laminate flooring throughout. Fresh paint inside and outside painted 3 years ago. Nice bonus room on the back 4 bedrooms and 2 full baths. Stove and refrigerator to remain. Vacant
-
2017-12-06soldstatus $400,600
-
2017-11-30soldstatus $30,100
-
2017-07-10$34,900
ⓘ Source: listings_history table (triggers on properties + properties_extension) + one-shot
backfill from property_details.listing_events for pre-trigger history.
Tax reassessment forecast AL · Resets to sale price
- Current annual tax
- $1,092 · $91/mo
- Projected year-2 tax
- $1,092 · $91/mo
- Expected delta
- $0/yr ($0/mo · 0.0%)
ⓘ Screening estimate from a state-policy table — verify with the county assessor before closing.
Climate risk First Street
- Flood 1/10 Low FEMA zone X (unshaded) · 0% chance over 30 yrs
- Wildfire 3/10 Moderate
- Heat 7/10 Severe 7 d/yr ≥107°F today · 19 d/yr by 30 yrs out
- Wind 8/10 Severe 80% chance of damaging wind over 30 yrs
- Air quality 3/10 Moderate 4 unhealthy d/yr today · 4 by 30 yrs out
Nearby sold comps map
Loading sold comps map…
Walkable amenities ~0.75 mi
Loading nearby amenities…
Taxation est. · year 1
- Rental income
- $18,162
- − Mortgage interest
- −$7,282
- − Property taxes
- −$1,092
- − Insurance
- −$650
- − Repairs & maintenance
- −$1,453
- − Management
- −$1,453
- − Depreciation
- −$3,782
- Taxable income
- $2,450
- Est. tax owed @ 24.0%
- −$588
- After-tax cash flow
- $3,837/yr
For passive investors: Depreciation is non-cash, so a rental often shows a tax loss while cash-flowing — sheltering income. Rental losses are passive: they offset passive income freely, and up to $25,000/yr can offset ordinary (W-2) income if you actively participate and your MAGI is under $100k (phasing out to $0 by $150k); unused losses carry forward. On sale, claimed depreciation is recaptured at up to 25%, and gains may owe capital-gains tax (a 1031 exchange can defer both). Figures are a year-1 estimate at your 24.0% rate — not tax advice; consult a CPA.
Schools (NCES district)
- District
- Montgomery County
- NCES district ID
- 0102430
- Math proficiency
- 9% ▼ -21.00%
- Reading proficiency
- 31% ▼ -1.00%
- Median HH income
- $43,902
- Composite
- 17.24/100
- National rank
- #9093
- State rank
- #106 of 129 in AL
Livability — Montgomery
- Score
- 65/100
- State rank
- #138
- US rank
- #13416
Category grades
Schools grade is shown separately in the Schools card above.
Census & demographics
- Census place
- Montgomery, AL
- County
- Montgomery County · 190,016 people
- City population
- 175,913
- Metro
- Montgomery, AL
- Population (ZIP)
- 23,581
- Household income
- $59,193
- Rent vs Own
- Severe rent burden
- 1039.0
Population outlook (Montgomery County) Hauer SSP2
- Today (2025)
- 224,008 people
- By 2030
- 221,460 · -1.1%
- By 2040
- 214,179 · -4.4%
- By 2050
- 204,912 · -8.5%
- By 2075
- 177,821 · -20.6%
- By 2100
- 145,134 · -35.2%
Race, ethnicity, and origin ACS 2023
- Neighborhood character
- Diverse neighborhood (Simpson 0.60)
- Race & ethnicity
- White 49% Black 39% Hispanic / Latino 8% Two or more races 4%
- Hispanic origin (detail)
- Mexican 4%
- Common ancestry
- Slovak 2% Lithuanian 1% Serbian 1%
- Foreign-born
- 4% · Canada, South Korea
- Languages at home
- 94% English-only · Spanish 5%
Political lean MEDSL · Montgomery
- 2024 margin
- Solid D (+30.7) · D 64.8% · R 34.1% · Other 1.1%
- 2008→2024 swing
- +11.5pp toward D · 2008: 19.2pp · 2024: 30.7pp
- All cycles
- 2024: D+30.7 2020: D+31.5 2016: D+26.2 2012: D+24.3 2008: D+19.2
Not yet ingested
- Civics
- —
Market trends
- HPI YoY
- ▼ -37.64%
- Current HPI
- 149.3867
- Rent YoY
- ▲ 2.65%
- Metro
- Montgomery, AL
- State GDP YoY
- ▲ 2.94%
- F500 in state
- 4
Industry mix (Fortune 500 HQ in AL)
| Industry | F500 HQs | Revenue |
|---|---|---|
| Financial Services | 1 | $8B |
|
||
| Healthcare | 1 | $5B |
|
||
Price history
-96.3% since first listed12 events — show timeline
- 2026-02-27 Rental Removed $1,300 MAAR
- 2026-02-04 Listed for Rent $1,300 MAAR
- 2025-09-30 Listed $130,000 MAAR
- 2024-07-20 Rental Removed $1,300 MAAR
- 2024-05-29 Listed for Rent $1,300 MAAR
- 2023-06-07 Sold (Public Records) $119,500 Public Records
- 2023-06-05 Sold (MLS) $119,500 MAAR
- 2023-05-20 Contingent — MAAR
- 2023-05-18 Listed $132,500 MAAR
- 2017-12-06 Sold (Public Records) $400,600 Public Records
- 2017-11-30 Sold (MLS) $30,100 MAAR
- 2017-07-10 Listed $34,900 MAAR
Property tax history
+13.3%/yrLatest (2025): $1,092 · -4.5% YoY. Source: county tax records.
Cash-flow waterfall
monthlySold comps — $/sqft
last 12 mo · ≤1 miLoading sold comps…