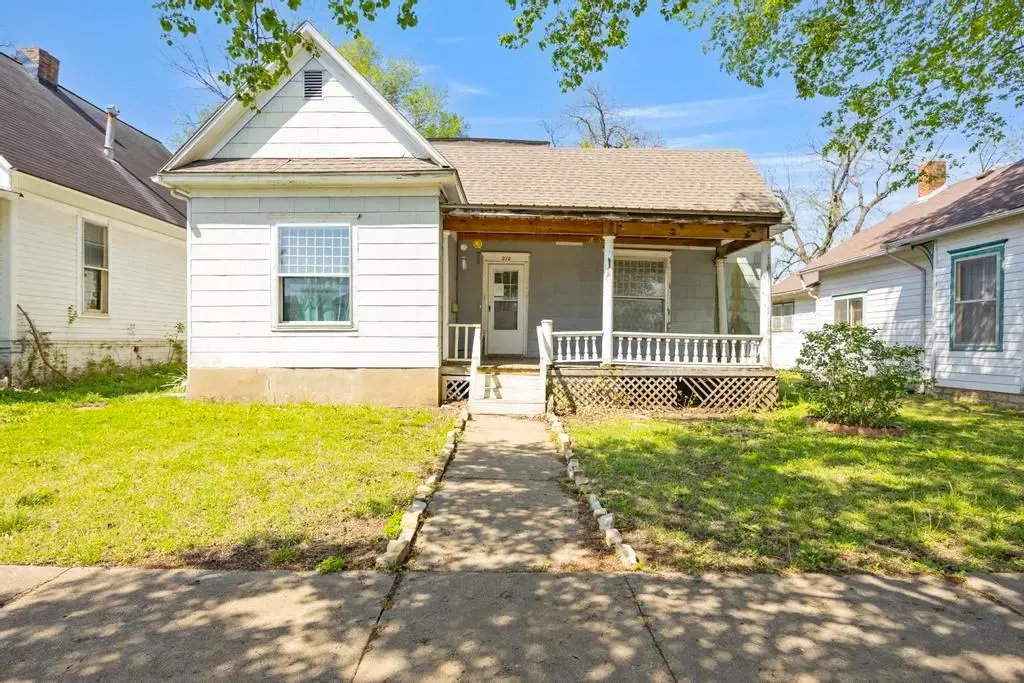
212 S Holbrook St · Fort Scott, KS
Flood risk 1/10 · Minimal
- FEMA flood zone
- X (unshaded)
- Chance of flooding over 30 yrs
- 0.0%
- Est. flood insurance / yr
- $507 – $1,088
Fire risk 5/10 · Moderate
- Est. fire insurance / yr
- $1,154 – $2,142
Heat risk 5/10 · Moderate
- Hot days now (above 109°F)
- 7 days/yr
- Hot days in 30 yrs
- 19 days/yr
Wind risk 2/10 · Minimal
- Chance of severe wind over 30 yrs
- 0.0%
Air-quality risk 2/10 · Minimal
- Unhealthy air days now
- 1 days/yr
- Unhealthy air days in 30 yrs
- 1 days/yr
Risk factors via First Street. Map © Google.
Why this score? — see what drove the B- grade
The composite is a weighted blend of 9 inputs, each scored 0–100. Each bar is that input's sub-score; the figure is the points it added to the 100-point composite (weight × sub-score).
- Cash flow +30.0/30.0
- 1% rule +10.0/10.0
- DSCR +10.0/10.0
- ARV discount +7.5/15.0
- Livability +3.3/5.0
- Rent growth +2.5/5.0
- Condition / age +2.5/5.0
- Schools +2.0/10.0
- Appreciation +0.0/10.0
$55,000
🖨 Deal sheet 📄 Offer letter ✓ Due diligence
Listing remarks
This turn of the century bungalow offers tons of potential, at a great price point! You are sure to love the bright and inviting living space with fresh paint, updated flooring, and tall ceilings. Many updates have been recently completed throughout the interior, and with a little TLC on the exterior, this home will be adorable inside and out. Whether you’re a first-time buyer, looking to downsizing, or searching for a turnkey investment that cashflows well, this move-in ready home is one you won’t want to miss! (Property is being sold as-is. )
Key facts
- 6,000 sq ft lot
- Garage
- Built 1900
Neighborhood map
What this means for you Summary
Snapshot
- This is a 2-bed/1.0-bath single-family listed at $55k.
Deal economics
- At list price, monthly cash flow is $500 ($6k/yr) — positive.
- The deal already cash-flows at list — no discount required.
- Meets the 1% rule at list price ($1k rent vs $55k).
- Cap rate 17.2% vs local median 4.9% in Fort Scott — top-decile yield for the area; either an underpriced asset or a hidden risk that comps aren't pricing in. Stress-test before assuming the spread holds.
Location & tenants
- Location reads 66/100 on livability (#259 in KS) — a middle-class / working-renter tenant base. Strengths: cost of living A+, health & safety A+, housing A; Watch: schools D, amenities F, commute F.
- Fort Scott (town): math 19% / reading 28% proficiency, ranked #150 of 169 in KS (top 89%) — low school quality limits family demand, transient renter base, plan for 1-2y turnover.
- Market conditions: 70 active listings in the ZIP; 5 units permitted in Bourbon County in 2024 (0 in 5+ unit buildings).
Forward outlook
- Local home prices are declining (-3.0%/yr); year-one equity from $380 of loan paydown is wiped out by about $2k of value loss. Plan a longer hold.
- Bourbon County population projected at -21% by 2050 — secular population decline; favor cash flow + early exit over multi-decade hold.
- At projected returns (-3.0% appreciation + 3.0% rent growth), your $15k cash investment doubles in ~4 years — after that, you're playing with house money.
Negotiation context
- Only 7 days on market — expect competitive offers; lowballing is unlikely to land.
- Current owner paid $20k; list at $55k implies a 168% gain — meaningful room to come down on a strong offer.
Risks & watch-outs
- Watch-outs: built in 1900 — expect roof / HVAC / electrical / plumbing capex.
- Climate carrying-cost: moderate wildfire risk; extreme-heat days projected 7→19/yr by 2055 (HVAC capex compounding) — expect insurance premiums to compound above CPI over the hold.
Questions for the listing agent
- Built in 1900 — when were the roof, HVAC, electrical panel, plumbing, and water heater last replaced?
- Is there a deadline driving the sale (1031 exchange, divorce, estate, relocation)? That informs how much negotiation room exists.
- Schools are D-rated, which usually means shorter tenancies and higher turnover. Who's the typical renter profile here, and what's been the actual vacancy rate?
- What's the average days-on-market for RENTAL listings here right now (not sales)? A rising rental-DOM trend means longer vacancies and softer asking-rent achievability than the comps imply.
- What's the recent tenant-quality profile in this submarket — average credit score on applications, eviction rate, late-payment / NSF rate, and stable-employment percentage? A property-management company in the area should have these aggregated.
- How much new for-sale + rental construction is in the pipeline within 1–3 miles? Heavy new supply typically softens prices + rents 12–24 months out; constrained supply supports both.
Investment metrics
- 1% rule
- 1.97% ✓
- Cap rate
- 17.21%
- Cash-on-cash
- 38.97%
- DSCR
- 2.73
- GRM
- 4.2
CMA / ARV
- ARV (on-the-fly)
- $124,608
- Comps found
- 12
Show comp detail 12 sales within ~0.75 mi
| Address | Dist | Beds/Ba | Sqft | Sold | Price | $/sf | Match |
|---|---|---|---|---|---|---|---|
| 212 S Holbrook St | 0.00mi | 2/1.0 | 1,416 (0%) | 1mo | $55,000 | $39 | 99 |
| 108 N Crawford St | 0.29mi | 2/1.0 | 1,345 (-5%) | 1mo | $60,000 | $45 | 77 |
| 20 S Crawford St | 0.18mi | 2/1.5 | 1,583 (+12%) | 7mo | $139,500 | $88 | 65 |
| 608 S Lowman St | 0.28mi | 2/1.0 | 1,280 (-10%) | 8mo | $110,000 | $86 | 64 |
| 602 Horton St | 0.28mi | 3/1.0 (+1) | 1,279 (-10%) | 3mo | $130,000 | $102 | 63 |
| 523 S Crawford St | 0.29mi | 3/2.0 (+1) | 1,332 (-6%) | 5mo | $159,900 | $120 | 63 |
| 716 S Osbun St | 0.40mi | 3/2.0 (+1) | 1,385 (-2%) | 7mo | $100,000 | $72 | 63 |
| 910 S Judson St | 0.67mi | 2/1.0 | 1,340 (-5%) | 2mo | $87,500 | $65 | 58 |
| 209 Heylman St | 0.31mi | 3/2.0 (+1) | 1,620 (+14%) | 2mo | $185,000 | $114 | 51 |
| 802 Heylman St | 0.60mi | 2/1.5 | 1,233 (-13%) | 1mo | $197,500 | $160 | 47 |
| 850 State St | 0.75mi | 2/1.0 | 1,606 (+13%) | 3mo | $44,000 | $27 | 40 |
| 606 S Hill St | 0.74mi | 3/1.0 (+1) | 1,276 (-10%) | 8mo | $120,000 | $94 | 38 |
Match score weights: distance 35% · size 25% · config 20% · recency 20%. Top-matched comps best support the ARV.
Projected returns pro-forma
-3.0% appreciation · 3.0% rent growth · sell at horizon
- IRR
- 35.2%
- Equity multiple
- 2.49×
- Total profit
- $22,946
- Equity at exit
- $8,201
- IRR
- 42.0%
- Equity multiple
- 4.96×
- Total profit
- $61,007
- Equity at exit
- $4,755
Cash invested: $15,400 (down + closing). Projections, not guarantees.
Landlord ↔ Tenant lean methodology
- Overall (STATE)
- 83 Strongly Landlord-Friendly
- State Kansas
- 83 Strongly Landlord-Friendly · R+10
- County
- — inherits STATE
- City
- — inherits STATE
ZIP-level market 66701
- Home prices YoY
- -10.4%
- Active inventory
- 70
- Price-to-rent
- 4.2×
Monthly cashflow live
- Estimated rent
- $1,083 medium interval (Pro) →
- Mortgage (P&I)
- −$288
- Tax from tax record
- −$44 /mo · $533/yr
- Insurance
- −$23
- HOA
- −$0
- Vacancy / Maint / Mgmt
- −$228
- Net cashflow
- $500
Break-even live
UW: 25.0% down · 7.5% · 30yr · 1.5% tax · 5.0% vac · 8.0% maint · 8.0% mgmt
Financing live
Cash to close
- Down payment
- $13,750
- Closing costs
- $1,650
- Reserves months
- —
- Total cash needed
- —
Loan-product check · same deal, 3 products live
Conventional
25% down · 7.5% · 30yr
- Down + closing
- —
- Monthly P&I
- —
- Monthly cashflow
- —
- DSCR
- —
- Eligible?
- —
Personal DTI + credit; lowest rate.
DSCR
20% down · 8.5% · 30yr
- Down + closing
- —
- Monthly P&I
- —
- Monthly cashflow
- —
- DSCR
- —
- Eligible?
- —
No personal income docs; deal must DSCR.
Hard money
10% down · 12.0% · 12mo
- Down + closing
- —
- Monthly P&I
- —
- Monthly cashflow
- —
- DSCR
- —
- Eligible?
- —
Short-term bridge; refi at stabilization.
Listing history 4 events
-
2026-04-21status Pending
-
2026-04-14$55,000 Active
-
2007-11-01soldstatus $20,500
-
2000-06-01soldstatus $27,000
ⓘ Source: listings_history table (triggers on properties + properties_extension) + one-shot
backfill from property_details.listing_events for pre-trigger history.
Tax reassessment forecast KS · Resets to sale price
- Current annual tax
- $533 · $44/mo
- Projected year-2 tax
- $776 · $65/mo
- Expected delta
- +$243/yr (+$20/mo · 45.5%)
ⓘ Screening estimate from a state-policy table — verify with the county assessor before closing.
Climate risk First Street
- Flood 1/10 Low FEMA zone X (unshaded) · 0% chance over 30 yrs
- Wildfire 5/10 Major
- Heat 5/10 Major 7 d/yr ≥109°F today · 19 d/yr by 30 yrs out
- Wind 2/10 Low 0% chance of damaging wind over 30 yrs
- Air quality 2/10 Low 1 unhealthy d/yr today · 1 by 30 yrs out
Nearby sold comps map
Loading sold comps map…
Walkable amenities ~0.75 mi
Loading nearby amenities…
Taxation est. · year 1
- Rental income
- $13,002
- − Mortgage interest
- −$3,081
- − Property taxes
- −$533
- − Insurance
- −$275
- − Repairs & maintenance
- −$1,040
- − Management
- −$1,040
- − Depreciation
- −$1,600
- Taxable income
- $5,432
- Est. tax owed @ 24.0%
- −$1,304
- After-tax cash flow
- $4,698/yr
For passive investors: Depreciation is non-cash, so a rental often shows a tax loss while cash-flowing — sheltering income. Rental losses are passive: they offset passive income freely, and up to $25,000/yr can offset ordinary (W-2) income if you actively participate and your MAGI is under $100k (phasing out to $0 by $150k); unused losses carry forward. On sale, claimed depreciation is recaptured at up to 25%, and gains may owe capital-gains tax (a 1031 exchange can defer both). Figures are a year-1 estimate at your 24.0% rate — not tax advice; consult a CPA.
Schools (NCES district)
- District
- Fort Scott
- NCES district ID
- 2006180
- Math proficiency
- 19% ▼ -3.00%
- Reading proficiency
- 28% ▬ 0.00%
- Median HH income
- $38,034
- Composite
- 19.64/100
- National rank
- #8741
- State rank
- #150 of 169 in KS
Livability — Fort Scott
- Score
- 66/100
- State rank
- #259
- US rank
- #11422
Category grades
Schools grade is shown separately in the Schools card above.
Census & demographics
- Census place
- Fort Scott, KS
- Population (ZIP)
- 11,075
Population outlook (Bourbon County) Hauer SSP2
- Today (2025)
- 13,761 people
- By 2030
- 13,139 · -4.5%
- By 2040
- 11,920 · -13.4%
- By 2050
- 10,892 · -20.8%
- By 2075
- 8,645 · -37.2%
- By 2100
- 6,751 · -50.9%
Race, ethnicity, and origin ACS 2023
- Neighborhood character
- Predominantly White (89%)
- Race & ethnicity
- White 89% Two or more races 5% Hispanic / Latino 3% Black 2%
- Common ancestry
- Lithuanian 2% Serbian 2% Slovak 2%
- Foreign-born
- 1%
- Languages at home
- 97% English-only · Spanish 1% Other Asian/Pacific 1% German/W. Germanic 1%
Political lean MEDSL · Bourbon
- 2024 margin
- Solid R (+54.2) · D 22.0% · R 76.1% · Other 1.9%
- 2008→2024 swing
- -26.9pp toward R · 2008: -27.2pp · 2024: -54.2pp
- All cycles
- 2024: R+54.2 2020: R+52.0 2016: R+50.8 2012: R+33.9 2008: R+27.2
Not yet ingested
- Civics
- —
Market trends
- HPI YoY
- ▼ -20.03%
- Current HPI
- 172.2531
- Rent YoY
- —
- Metro
- —
- State GDP YoY
- —
- F500 in state
- 0
Price history
+103.7% since first listed4 events — show timeline
- 2026-04-21 Pending — Heartland MLS as Distributed by MLS Grid
- 2026-04-14 Listed $55,000 Heartland MLS as Distributed by MLS Grid
- 2007-11-01 Sold (Public Records) $20,500 Public Records
- 2000-06-01 Sold (Public Records) $27,000 Public Records
Property tax history
+0.2%/yrLatest (2025): $533 · -15.2% YoY. Source: county tax records.
Cash-flow waterfall
monthlySold comps — $/sqft
last 12 mo · ≤1 miLoading sold comps…