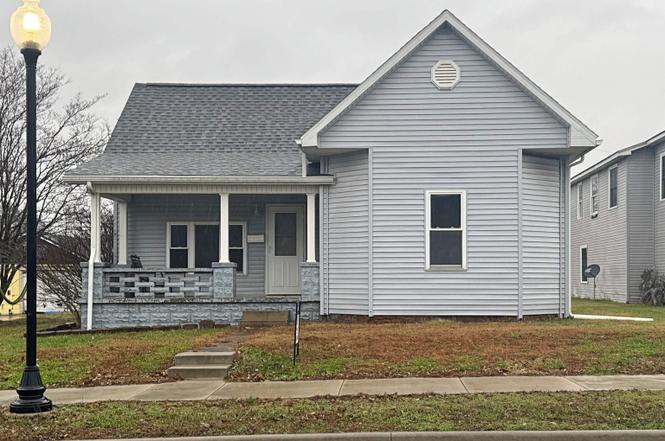
604 W National Hwy · Washington, IN
Flood risk 1/10 · Minimal
- FEMA flood zone
- —
- Chance of flooding over 30 yrs
- 0.0%
- Est. flood insurance / yr
- —
Fire risk 1/10 · Minimal
- Est. fire insurance / yr
- $717 – $1,331
Heat risk 5/10 · Moderate
- Hot days now (above 106°F)
- 7 days/yr
- Hot days in 30 yrs
- 19 days/yr
Wind risk 2/10 · Minimal
- Chance of severe wind over 30 yrs
- 2.0%
Air-quality risk 4/10 · Minor
- Unhealthy air days now
- 3 days/yr
- Unhealthy air days in 30 yrs
- 5 days/yr
Risk factors via First Street. Map © Google.
Why this score? — see what drove the C- grade
The composite is a weighted blend of 9 inputs, each scored 0–100. Each bar is that input's sub-score; the figure is the points it added to the 100-point composite (weight × sub-score).
- Cash flow +19.9/30.0
- ARV discount +10.6/15.0
- DSCR +6.3/10.0
- 1% rule +5.3/10.0
- Livability +3.6/5.0
- Schools +3.2/10.0
- Rent growth +2.5/5.0
- Condition / age +2.5/5.0
- Appreciation +0.0/10.0
$149,900
🖨 Deal sheet (PDF) 📄 Offer letter ✓ Due diligence
Listing remarks MLS
Spacious 2 bedroom, 1 bath home featuring classic high ceilings, main floor laundry, nice front and back porch, off-street parking, and detached garage. Plus updated windows, gas water heater, HVAC, and electrical 200 amp panel.
Key facts
- Covered front porch
- Covered deck
- Main-level laundry
Tags
Neighborhood map
What this means for you Summary
Snapshot
- This is a 3-bed/1.0-bath single-family listed at $150k.
Deal economics
- At list price, monthly cash flow is $180 ($2k/yr) — positive.
- The deal already cash-flows at list — no discount required.
- Meets the 1% rule at list price ($2k rent vs $150k).
- Recommended offer: $132k (12.0% below list) — sets the bar for market timing.
- Cap rate 7.7% vs local median 4.9% in Washington — top-decile yield for the area; either an underpriced asset or a hidden risk that comps aren't pricing in. Stress-test before assuming the spread holds.
Location & tenants
- Location reads 72/100 on livability (#110 in IN) — a middle-class / working-renter tenant base. Strengths: cost of living A+, housing A+, health & safety A+; Watch: amenities F, commute F, employment F.
- Washington Community Schools (town): math 36% / reading 38% proficiency, ranked #174 of 301 in IN (top 58%) — families likely to look elsewhere, expect single-tenant / working-renter base with shorter leases.
- Zoned schools: Washington Intermediate (math 28% / reading 19%, grade F, #782 of 994 statewide, top 79%, 445 students, 68% FRL); Washington Upper Elementary (math 44% / reading 43%, grade D, #90 of 330 statewide, top 27%, 361 students, 62% FRL); Washington High School (math 27% / reading 57%, grade F, #197 of 369 statewide, top 57%, 780 students, 58% FRL).
- Market conditions: 115 active listings in the ZIP; 71 units permitted in Daviess County in 2024 (0 in 5+ unit buildings).
Forward outlook
- Local home prices are declining (-3.0%/yr); year-one equity from $1k of loan paydown is wiped out by about $4k of value loss. Plan a longer hold.
- Daviess County population projected at +6% by 2050 — modest demand growth; plan on rents tracking national, not racing it.
Negotiation context
- It's been on market 126 days — a 12% lower offer ($132k) is reasonable based on typical stale-listing flexibility.
- 2 sale attempts since 2y ago; this cycle's ask has dropped $9k (6%) from the opening price — seller is motivated, your offer sets the floor, not the list.
- Current owner paid $90k; list at $150k implies a 67% gain — meaningful room to come down on a strong offer.
Risks & watch-outs
- Watch-outs: built in 1895 — expect roof / HVAC / electrical / plumbing capex.
- Climate carrying-cost: extreme-heat days projected 7→19/yr by 2055 (HVAC capex compounding) — expect insurance premiums to compound above CPI over the hold.
Questions for the listing agent
- It's been on market 126 days. Have you received any prior offers? Is the seller open to a 12% concession, seller financing, or rate buy-down credit?
- Built in 1895 — when were the roof, HVAC, electrical panel, plumbing, and water heater last replaced?
- Why hasn't it sold? Are there any deal-killer items the seller is aware of (foundation, flood, title, zoning, code violations)?
- Is there a deadline driving the sale (1031 exchange, divorce, estate, relocation)? That informs how much negotiation room exists.
- What's the average days-on-market for RENTAL listings here right now (not sales)? A rising rental-DOM trend means longer vacancies and softer asking-rent achievability than the comps imply.
- What's the recent tenant-quality profile in this submarket — average credit score on applications, eviction rate, late-payment / NSF rate, and stable-employment percentage? A property-management company in the area should have these aggregated.
- How much new for-sale + rental construction is in the pipeline within 1–3 miles? Heavy new supply typically softens prices + rents 12–24 months out; constrained supply supports both.
Investment metrics
- 1% rule
- 1.03% ✓
- Cap rate
- 7.73%
- Cash-on-cash
- 5.15%
- DSCR
- 1.23
- GRM
- 8.1
CMA / ARV
- ARV (on-the-fly)
- $160,968
- Comps found
- 12
Show comp detail 12 sales within ~0.75 mi
| Address | Dist | Beds/Ba | Sqft | Sold | Price | $/sf | Match |
|---|---|---|---|---|---|---|---|
| 502 W Sycamore St | 0.10mi | 3/1.5 | 1,152 (+9%) | 1mo | $225,000 | $195 | 78 |
| 10 W Sycamore St | 0.34mi | 3/2.0 | 1,050 (-1%) | 8mo | $199,500 | $190 | 72 |
| 102 Sycamore St | 0.31mi | 2/1.0 (-1) | 1,120 (+6%) | 2mo | $174,500 | $156 | 69 |
| 210 W Vantrees St | 0.41mi | 2/1.0 (-1) | 1,056 (-0%) | 10mo | $50,000 | $47 | 67 |
| 705 SW 1st St | 0.36mi | 2/2.0 (-1) | 1,116 (+5%) | 5mo | $170,000 | $152 | 61 |
| 412 Meredith St | 0.59mi | 3/1.0 | 1,021 (-4%) | 7mo | $160,000 | $157 | 61 |
| 904 W Main St | 0.39mi | 3/1.0 | 1,144 (+8%) | 10mo | $75,000 | $66 | 60 |
| 508 NW 3rd St | 0.69mi | 3/1.0 | 1,120 (+6%) | 7mo | $156,000 | $139 | 52 |
| 401 W Flora St | 0.53mi | 3/2.0 | 1,132 (+7%) | 11mo | $125,000 | $110 | 50 |
| 804 S Meridian St | 0.46mi | 2/1.0 (-1) | 1,154 (+9%) | 12mo | $139,800 | $121 | 48 |
| 706 SE 2nd St | 0.54mi | 2/1.0 (-1) | 936 (-12%) | 7mo | $78,500 | $84 | 45 |
| 407 Ogdon St | 0.66mi | 3/2.0 | 1,190 (+12%) | 2mo | $193,000 | $162 | 43 |
Match score weights: distance 35% · size 25% · config 20% · recency 20%. Top-matched comps best support the ARV.
Projected returns pro-forma
-3.0% appreciation · 3.0% rent growth · sell at horizon
- IRR
- -8.3%
- Equity multiple
- 0.69×
- Total profit
- $-12,803
- Equity at exit
- $22,351
- IRR
- 1.3%
- Equity multiple
- 1.09×
- Total profit
- $3,709
- Equity at exit
- $12,961
Cash invested: $41,972 (down + closing). Projections, not guarantees.
Landlord ↔ Tenant lean methodology
- Overall (STATE)
- 90 Strongly Landlord-Friendly
- State Indiana
- 90 Strongly Landlord-Friendly · R+11
- County
- — inherits STATE
- City
- — inherits STATE
ZIP-level market 47501
- Home prices YoY
- -23.2%
- Active inventory
- 115
- Price-to-rent
- 8.1×
Monthly cashflow live
- Estimated rent
- $1,539 medium interval (Pro) →
- Mortgage (P&I)
- −$786
- Tax est. 1.5%
- −$187 /mo · $2,248/yr
- Insurance
- −$62
- HOA
- −$0
- Vacancy / Maint / Mgmt
- −$323
- Net cashflow
- $180
Break-even live
Sensitivity live
| Price | -10% $284 | -5% $232 | +0% $180 | +5% $128 | +10% $76 |
|---|---|---|---|---|---|
| Rent | -10% $58 | -5% $119 | +0% $180 | +5% $241 | +10% $302 |
| Rate | -1.0pp $255 | -0.5pp $218 | base $180 | +0.5pp $141 | +1.0pp $102 |
UW: 25.0% down · 7.5% · 30yr · 1.5% tax · 5.0% vac · 8.0% maint · 8.0% mgmt
Financing live
Cash to close
- Down payment
- $37,475
- Closing costs
- $4,497
- Reserves months
- —
- Total cash needed
- —
Loan-product check · same deal, 3 products live
Conventional
25% down · 7.5% · 30yr
- Down + closing
- —
- Monthly P&I
- —
- Monthly cashflow
- —
- DSCR
- —
- Eligible?
- —
Personal DTI + credit; lowest rate.
DSCR
20% down · 8.5% · 30yr
- Down + closing
- —
- Monthly P&I
- —
- Monthly cashflow
- —
- DSCR
- —
- Eligible?
- —
No personal income docs; deal must DSCR.
Hard money
10% down · 12.0% · 12mo
- Down + closing
- —
- Monthly P&I
- —
- Monthly cashflow
- —
- DSCR
- —
- Eligible?
- —
Short-term bridge; refi at stabilization.
Listing history 8 events
-
2026-04-28status Pending
-
2026-04-15price $149,900
-
2026-04-15price $149,000
-
2025-12-19$159,000 Active
-
2025-01-24soldstatus $90,000 Closed 228-char remark
Show marketing remark (228 chars)
Spacious 2 bedroom, 1 bath home featuring classic high ceilings, main floor laundry, nice front and back porch, off-street parking, and detached garage. Plus updated windows, gas water heater, HVAC, and electrical 200 amp panel.
-
2025-01-23soldstatus $90,000
-
2025-01-06status Pending 228-char remark
Show marketing remark (228 chars)
Spacious 2 bedroom, 1 bath home featuring classic high ceilings, main floor laundry, nice front and back porch, off-street parking, and detached garage. Plus updated windows, gas water heater, HVAC, and electrical 200 amp panel.
-
2024-12-31$95,900 Active 228-char remark
Show marketing remark (228 chars)
Spacious 2 bedroom, 1 bath home featuring classic high ceilings, main floor laundry, nice front and back porch, off-street parking, and detached garage. Plus updated windows, gas water heater, HVAC, and electrical 200 amp panel.
ⓘ Source: listings_history table (triggers on properties + properties_extension) + one-shot
backfill from property_details.listing_events for pre-trigger history.
Climate risk First Street
- Flood 1/10 Low 0% chance over 30 yrs
- Wildfire 1/10 Low
- Heat 5/10 Major 7 d/yr ≥106°F today · 19 d/yr by 30 yrs out
- Wind 2/10 Low 2% chance of damaging wind over 30 yrs
- Air quality 4/10 Moderate 3 unhealthy d/yr today · 5 by 30 yrs out
Nearby sold comps map
Loading sold comps map…
Walkable amenities ~0.75 mi
Loading nearby amenities…
Taxation est. · year 1
- Rental income
- $18,470
- − Mortgage interest
- −$8,397
- − Property taxes
- −$2,248
- − Insurance
- −$750
- − Repairs & maintenance
- −$1,478
- − Management
- −$1,478
- − Depreciation
- −$4,361
- Taxable loss
- −$241
- Est. tax savings @ 24.0%
- +$58
- After-tax cash flow
- $2,218/yr
For passive investors: Depreciation is non-cash, so a rental often shows a tax loss while cash-flowing — sheltering income. Rental losses are passive: they offset passive income freely, and up to $25,000/yr can offset ordinary (W-2) income if you actively participate and your MAGI is under $100k (phasing out to $0 by $150k); unused losses carry forward. On sale, claimed depreciation is recaptured at up to 25%, and gains may owe capital-gains tax (a 1031 exchange can defer both). Figures are a year-1 estimate at your 24.0% rate — not tax advice; consult a CPA.
Schools (NCES district)
- District
- Washington Community Schools
- NCES district ID
- 1812450
- Math proficiency
- 36% ▼ -1.00%
- Reading proficiency
- 38% ▼ -3.00%
- Median HH income
- $45,422
- Composite
- 31.57/100
- National rank
- #5952
- State rank
- #174 of 301 in IN
Livability — Washington
- Score
- 72/100
- State rank
- #110
- US rank
- #5706
Category grades
Schools grade is shown separately in the Schools card above.
Census & demographics
- Census place
- Washington, IN
- City population
- 18,335
- Population (ZIP)
- 18,335
Population outlook (Daviess County) Hauer SSP2
- Today (2025)
- 33,940 people
- By 2030
- 34,457 · +1.5%
- By 2040
- 35,412 · +4.3%
- By 2050
- 35,803 · +5.5%
- By 2075
- 35,173 · +3.6%
- By 2100
- 29,799 · -12.2%
Race, ethnicity, and origin ACS 2023
- Neighborhood character
- Predominantly White (81%)
- Race & ethnicity
- White 81% Hispanic / Latino 11% Two or more races 8% Black 3%
- Hispanic origin (detail)
- Mexican 9%
- Common ancestry
- Hispanic 4% Lithuanian 2% Slovak 1%
- Foreign-born
- 7% · Canada
- Languages at home
- 89% English-only · Spanish 5% French/Haitian/Cajun 3% German/W. Germanic 1%
Political lean MEDSL · Daviess
- 2024 margin
- Solid R (+64.3) · D 17.1% · R 81.5% · Other 1.4%
- 2008→2024 swing
- -29.1pp toward R · 2008: -35.2pp · 2024: -64.3pp
- All cycles
- 2024: R+64.3 2020: R+62.0 2016: R+62.8 2012: R+50.8 2008: R+35.2
Not yet ingested
- Civics
- —
Market trends
- HPI YoY
- ▼ -64.30%
- Current HPI
- 213.3049
- Rent YoY
- —
- Metro
- —
- State GDP YoY
- ▲ 2.90%
- F500 in state
- 18
Industry mix (Fortune 500 HQ in IN)
| Industry | F500 HQs | Revenue |
|---|---|---|
| Industrial Machinery | 2 | $37B |
|
||
| Healthcare | 1 | $177B |
|
||
| Pharmaceuticals | 1 | $45B |
|
||
| Metals / Steel | 1 | $18B |
|
||
| Agriculture | 1 | $17B |
|
||
| Packaging | 1 | $12B |
|
||
Price history
+56.3% since first listed8 events — show timeline
- 2026-04-28 Pending — IRMLS
- 2026-04-15 Price Changed $149,900 IRMLS
- 2026-04-15 Price Changed $149,000 IRMLS
- 2025-12-19 Listed $159,000 IRMLS
- 2025-01-24 Sold (MLS) $90,000 IRMLS
- 2025-01-23 Sold (Public Records) $90,000 Public Records
- 2025-01-06 Pending — IRMLS
- 2024-12-31 Listed $95,900 IRMLS
Cash-flow waterfall
monthlySold comps — $/sqft
last 12 mo · ≤1 miLoading sold comps…