1268 Balsam Rd · Wilmer, TX
Flood risk No data
- FEMA flood zone
- —
- Chance of flooding over 30 yrs
- —
- Est. flood insurance / yr
- —
Fire risk No data
- Est. fire insurance / yr
- —
Heat risk No data
- Hot days now (above threshold)
- —
- Hot days in 30 yrs
- —
Wind risk No data
- Chance of severe wind over 30 yrs
- —
Air-quality risk No data
- Unhealthy air days now
- —
- Unhealthy air days in 30 yrs
- —
Risk factors via First Street. Map © Google.
Why this score? — see what drove the D- grade
The composite is a weighted blend of 9 inputs, each scored 0–100. Each bar is that input's sub-score; the figure is the points it added to the 100-point composite (weight × sub-score).
- Cash flow +13.3/30.0
- Appreciation +5.6/10.0
- DSCR +4.0/10.0
- 1% rule +3.1/10.0
- Livability +3.0/5.0
- Schools +2.8/10.0
- Rent growth +2.5/5.0
- Condition / age +2.5/5.0
- ARV discount +0.0/15.0
$235,999
🖨 Deal sheet (PDF) 📄 Offer letter ✓ Due diligence
Listing remarks MLS
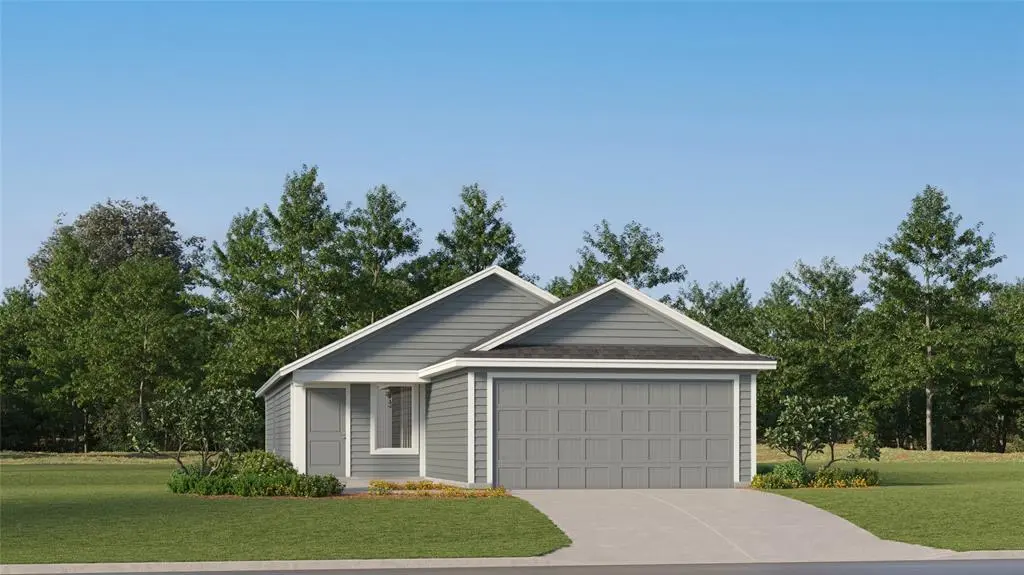
This single-level home showcases a spacious open floorplan shared between the kitchen, dining area and family room for easy entertaining during gatherings. An owner's suite enjoys a private location in a rear corner of the home, complemented by an en-suite bathroom and walk-in closet. There are two secondary bedrooms along the side of the home, which are comfortable spaces for household members and overnight guests.
Key facts
- Walk-in closet
- Open floorplan
- Secondary bedrooms
Tags
Property features AI
Finance
- Financial info: Accepts Cash, Conventional, FHA, USDA Loan, and VA Loan; Second mortgage not indicated
- HOA & community: Mandatory HOA managed by Legacy; Annual association fee of $899; HOA covers maintenance of grounds, management fees, and full use of facilities
Exterior
- Parking: Attached 2-car garage that faces front; 2 covered parking spaces
- Security: Smoke detectors, fire alarm, and carbon monoxide detectors
- Utilities: City water and city sewer; Concrete driveway/walks; Located in a municipal utility district
- Home design: Single family residence (attached); One-story; Shingle composition roof
- Construction: 2025 construction; Brick, rock/stone, and siding exterior; Slab foundation
- Exterior features: Covered porch(es); Wood fencing; Landscaped yard with sprinkler system; Interior lot with sidewalks and curbs
Interior
- Kitchen: Kitchen with built-in cabinets and natural stone/granite surfaces; Kitchen island; Microwave; Electric oven and electric range; Dishwasher; Walk-in pantry
- Bedrooms: 3 bedrooms, all on the main level; Primary bedroom on the main level with dual sinks and linen closet
- Flooring: Carpet; Other flooring
- Bathrooms: 2 full bathrooms
- Heating & cooling: Central heating (electric) with ENERGY STAR qualified equipment; Central air conditioning (electric) with ENERGY STAR qualified equipment
- Interior features: Open floorplan with decorative lighting and built-in features; Kitchen island; Pantry; Walk-in closets; Cable TV and high-speed internet available; Vented exhaust fan
- Laundry & utility: Electric water heater
Neighborhood map
What this means for you Summary
Snapshot
- This is a 3-bed/2.0-bath land listed at $236k.
Deal economics
- At list price, monthly cash flow is $-1 ($-13/yr) — negative.
- To cash-flow at today's rent, offer at most $236k (0.1% below list).
- To meet the 1% rule (rent ≥ 1% of price), the offer needs to be $192k (18.7% below list).
- Recommended offer: $192k (18.7% below list) — sets the bar for 1% rule.
- Cap rate 6.3% vs local median 4.8% in Wilmer — top-decile yield for the area; either an underpriced asset or a hidden risk that comps aren't pricing in. Stress-test before assuming the spread holds.
Location & tenants
- Location reads 60/100 on livability (#1,054 in TX) — a middle-class / working-renter tenant base. Strengths: cost of living A+, housing A+; Watch: crime C-, amenities F, commute F.
- Dallas ISD (urban): math 31% / reading 36% proficiency, ranked #559 of 826 in TX (top 68%) — families likely to look elsewhere, expect single-tenant / working-renter base with shorter leases; 83% free/reduced lunch — lower-income household profile, screen leases tightly.
- Zoned schools: Eddie Bernice Johnson Stem Academy (math 27% / reading 27%, grade F, #2,791 of 4,322 statewide, top 68%, 502 students, 92% FRL); Kennedy-Curry Middle (math 29% / reading 20%, grade F, #1,279 of 1,662 statewide, top 78%, 626 students, 100% FRL); Wilmer-Hutchins H S (math 14% / reading 29%, grade F, #1,377 of 1,632 statewide, top 85%, 1,020 students, 73% FRL) — zoned schools at 88% FRL track the district average.
- Market conditions: 85 active listings in the ZIP; 12 comparable units currently listed for rent nearby; rentals at typical pace (median 26d on market — plan ~3-4 weeks tenant-placement turnaround); 42% of comp listings sitting > 30 days — soft ceiling on asking rent; 12,577 units permitted in Dallas County in 2024 (6,829 in 5+ unit buildings).
Forward outlook
- In year one you build about $4k of equity ($2k loan paydown + $3k appreciation (1.2% local appreciation)).
- Dallas County population projected at +35% by 2050 — long-run rental-demand tailwind backs the buy-and-hold thesis.
- At projected returns (1.2% appreciation + 3.0% rent growth), your $66k cash investment doubles in ~10 years — after that, you're playing with house money.
- By year 7, paydown + projected appreciation supports a ~$30k cash-out refi (75% LTV) — recoverable capital for the next deal without selling this one.
Negotiation context
- Only 5 days on market — expect competitive offers; lowballing is unlikely to land.
- 6 sale attempts with the ask held roughly flat each time — persistent listings suggest the price (not the market) is what's stuck; bring a comps-based counter.
Questions for the listing agent
- What do current leases actually rent for vs. the listed asking? Can we see a recent rent roll and the last 12 months of T-12 income?
- What does the HOA fee cover, when was the last increase, and are there any pending special assessments or reserve-fund shortfalls?
- Is there a deadline driving the sale (1031 exchange, divorce, estate, relocation)? That informs how much negotiation room exists.
- Schools are F-rated, which usually means shorter tenancies and higher turnover. Who's the typical renter profile here, and what's been the actual vacancy rate?
- The area grade is low — what's the realistic commute time and amenity access for the typical tenant pool here? Any planned neighborhood developments (good or bad) we should know about?
- What's the average days-on-market for RENTAL listings here right now (not sales)? A rising rental-DOM trend means longer vacancies and softer asking-rent achievability than the comps imply.
- What's the recent tenant-quality profile in this submarket — average credit score on applications, eviction rate, late-payment / NSF rate, and stable-employment percentage? A property-management company in the area should have these aggregated.
- How much new for-sale + rental construction is in the pipeline within 1–3 miles? Heavy new supply typically softens prices + rents 12–24 months out; constrained supply supports both.
Investment metrics
- 1% rule
- 0.81% ✗
- Cap rate
- 6.29%
- Cash-on-cash
- -0.02%
- DSCR
- 1.00
- GRM
- 10.2
CMA / ARV
- ARV (median comp)
- $165,557
- List price
- $235,999
- Delta
- 42.55%
- Verdict
- OVERPRICED
- Comps
- 4 within 2.0 mi
Projected returns pro-forma
1.21% appreciation · 3.0% rent growth · sell at horizon
- IRR
- 2.0%
- Equity multiple
- 1.10×
- Total profit
- $6,740
- Equity at exit
- $83,158
- IRR
- 6.4%
- Equity multiple
- 1.80×
- Total profit
- $52,957
- Equity at exit
- $112,542
Cash invested: $66,080 (down + closing). Projections, not guarantees.
Landlord ↔ Tenant lean methodology
- Overall (STATE)
- 87 Strongly Landlord-Friendly
- State Texas
- 87 Strongly Landlord-Friendly · R+5
- County
- — inherits STATE
- City
- — inherits STATE
ZIP-level market 75141
- Home prices YoY
- 0.3%
- Active inventory
- 85
- Price-to-rent
- 10.2×
Monthly cashflow live
- Estimated rent
- $1,919 high interval (Pro) →
- Mortgage (P&I)
- −$1,238
- Tax from tax record
- −$106 /mo · $1,271/yr
- Insurance
- −$98
- HOA
- −$75
- Vacancy / Maint / Mgmt
- −$403
- Net cashflow
- $-1
Break-even live
Sensitivity live
| Price | -10% $133 | -5% $66 | +0% $-1 | +5% $-68 | +10% $-135 |
|---|---|---|---|---|---|
| Rent | -10% $-153 | -5% $-77 | +0% $-1 | +5% $75 | +10% $150 |
| Rate | -1.0pp $118 | -0.5pp $59 | base $-1 | +0.5pp $-62 | +1.0pp $-124 |
UW: 25.0% down · 7.5% · 30yr · 1.5% tax · 5.0% vac · 8.0% maint · 8.0% mgmt
Financing live
Cash to close
- Down payment
- $59,000
- Closing costs
- $7,080
- Reserves months
- —
- Total cash needed
- —
Loan-product check · same deal, 3 products live
Conventional
25% down · 7.5% · 30yr
- Down + closing
- —
- Monthly P&I
- —
- Monthly cashflow
- —
- DSCR
- —
- Eligible?
- —
Personal DTI + credit; lowest rate.
DSCR
20% down · 8.5% · 30yr
- Down + closing
- —
- Monthly P&I
- —
- Monthly cashflow
- —
- DSCR
- —
- Eligible?
- —
No personal income docs; deal must DSCR.
Hard money
10% down · 12.0% · 12mo
- Down + closing
- —
- Monthly P&I
- —
- Monthly cashflow
- —
- DSCR
- —
- Eligible?
- —
Short-term bridge; refi at stabilization.
Rent comps 12 comps
| Address | Beds | Baths | Sqft | Rent | $/sqft | DOM | Units | Dist |
|---|---|---|---|---|---|---|---|---|
| 1255 Maple St Wilmer, TX | 3.0 | 2.0 | 1529 | $1,875 | $1.23 | 45d | 1 | 0.04mi |
| 110 Willow Way Wilmer, TX | 3.0 | 2.0 | 1647 | $1,875 | $1.14 | 45d | 1 | 0.05mi |
| 118 Willow Way Wilmer, TX | 3.0 | 2.0 | 1647 | $1,875 | $1.14 | 45d | 1 | 0.05mi |
| 1239 Maple St Wilmer, TX | 3.0 | 2.0 | 1673 | $1,895 | $1.13 | 26d | 1 | 0.06mi |
| 1235 Maple St Wilmer, TX | 3.0 | 2.0 | 1673 | $1,895 | $1.13 | 26d | 1 | 0.07mi |
| 1223 Maple St Wilmer, TX | 3.0 | 2.0 | 1381 | $1,935 | $1.40 | 45d | 1 | 0.09mi |
| 314 Rolling Meadow Dr Wilmer, TX | 4.0 | 2.0 | 1496 | $2,399 | $1.60 | 45d | 1 | 0.37mi |
| 531 Sydney St Wilmer, TX | 4.0 | 2.0 | 1696 | $2,100 | $1.24 | 0d | 1 | 0.45mi |
| 5900 S Interstate Highway 45 Wilmer, TX | 1.0–3.0 | 1.0–2.0 | 988 | $1,794 | $1.81 | 0d | 9 | 0.82mi |
| 6000 S Interstate Highway 45 Wilmer, TX | 1.0–4.0 | 1.0–2.0 | 988 | $1,781 | $1.80 | 0d | 13 | 1.01mi |
| 301 Mars Rd Wilmer, TX | 1.0–3.0 | 1.0–2.0 | 965 | $1,890 | $1.96 | 0d | 25 | 1.14mi |
| 409 Dewitt St Wilmer, TX | 3.0 | 2.0 | 1320 | $2,000 | $1.52 | 0d | 1 | 1.26mi |
HOA detail
- Monthly dues
- $75 · $900/yr
Listing history 7 events
-
2026-06-21days on market $235,999 Active 5 DOM
-
2026-06-18days on market $235,999 Active 2 DOM
-
2026-06-17remarks 553-char remark
-
2026-06-17days on market $235,999 Active 1 DOM
-
2026-06-09days on market $235,999 Active 24 DOM
Show marketing remark (419 chars)
This single-level home showcases a spacious open floorplan shared between the kitchen, dining area and family room for easy entertaining during gatherings. An owner's suite enjoys a private location in a rear corner of the home, complemented by an en-suite bathroom and walk-in closet. There are two secondary bedrooms along the side of the home, which are comfortable spaces for household members and overnight guests.
-
2026-06-08remarks 419-char remark
Show marketing remark (419 chars)
This single-level home showcases a spacious open floorplan shared between the kitchen, dining area and family room for easy entertaining during gatherings. An owner's suite enjoys a private location in a rear corner of the home, complemented by an en-suite bathroom and walk-in closet. There are two secondary bedrooms along the side of the home, which are comfortable spaces for household members and overnight guests.
-
2026-06-08pricestatusdays on market $235,999 Active 23 DOM
Show marketing remark (419 chars)
This single-level home showcases a spacious open floorplan shared between the kitchen, dining area and family room for easy entertaining during gatherings. An owner's suite enjoys a private location in a rear corner of the home, complemented by an en-suite bathroom and walk-in closet. There are two secondary bedrooms along the side of the home, which are comfortable spaces for household members and overnight guests.
ⓘ Source: listings_history table (triggers on properties + properties_extension) + one-shot
backfill from property_details.listing_events for pre-trigger history.
Tax reassessment forecast TX · Resets to sale price
- Current annual tax
- $1,271 · $106/mo
- Projected year-2 tax
- $4,319 · $360/mo
- Expected delta
- +$3,047/yr (+$254/mo · 239.7%)
ⓘ Screening estimate from a state-policy table — verify with the county assessor before closing.
Nearby sold comps map
Loading sold comps map…
Walkable amenities ~0.75 mi
Loading nearby amenities…
Taxation est. · year 1
- Rental income
- $23,025
- − Mortgage interest
- −$13,220
- − Property taxes
- −$1,271
- − Insurance
- −$1,180
- − Repairs & maintenance
- −$1,842
- − Management
- −$1,842
- − HOA
- −$900
- − Depreciation
- −$6,865
- Taxable loss
- −$4,096
- Est. tax savings @ 24.0%
- +$983
- After-tax cash flow
- $970/yr
For passive investors: Depreciation is non-cash, so a rental often shows a tax loss while cash-flowing — sheltering income. Rental losses are passive: they offset passive income freely, and up to $25,000/yr can offset ordinary (W-2) income if you actively participate and your MAGI is under $100k (phasing out to $0 by $150k); unused losses carry forward. On sale, claimed depreciation is recaptured at up to 25%, and gains may owe capital-gains tax (a 1031 exchange can defer both). Figures are a year-1 estimate at your 24.0% rate — not tax advice; consult a CPA.
Schools (NCES district)
- District
- Dallas ISD
- NCES district ID
- 4816230
- Math proficiency
- 31% ▼ -16.00%
- Reading proficiency
- 36% ▼ -4.00%
- Median HH income
- $42,881
- Composite
- 28.41/100
- National rank
- #6763
- State rank
- #559 of 826 in TX
Livability — Wilmer
- Score
- 60/100
- State rank
- #1054
- US rank
- #18696
Category grades
Schools grade is shown separately in the Schools card above.
Census & demographics
- Census place
- Wilmer, TX
- City population
- 5,873
- Population (ZIP)
- 4,686
Population outlook (Dallas County) Hauer SSP2
- Today (2025)
- 2,979,839 people
- By 2030
- 3,191,823 · +7.1%
- By 2040
- 3,619,611 · +21.5%
- By 2050
- 4,026,915 · +35.1%
- By 2075
- 4,957,073 · +66.4%
- By 2100
- 5,508,725 · +84.9%
Race, ethnicity, and origin ACS 2023
- Neighborhood character
- Diverse neighborhood (Simpson 0.56)
- Race & ethnicity
- Hispanic / Latino 53% Black 39% Two or more races 24% White 6%
- Hispanic origin (detail)
- Mexican 46% Puerto Rican 3%
- Common ancestry
- Slovak 1% American 1% Russian 1%
- Foreign-born
- 23% · Canada
- Languages at home
- 51% English-only · Spanish 49% Other Indo-European 1%
Political lean MEDSL · Dallas
- 2024 margin
- Strong D (+22.2) · D 60.2% · R 38.0% · Other 1.8%
- 2008→2024 swing
- +6.9pp toward D · 2008: 15.3pp · 2024: 22.2pp
- All cycles
- 2024: D+22.2 2020: D+31.6 2016: D+26.2 2012: D+15.4 2008: D+15.3
Not yet ingested
- Civics
- —
Market trends
- HPI YoY
- ▲ 1.21%
- Current HPI
- 382.1182
- Rent YoY
- —
- Metro
- —
- State GDP YoY
- ▲ 3.95%
- F500 in state
- 110
Industry mix (Fortune 500 HQ in TX)
| Industry | F500 HQs | Revenue |
|---|---|---|
| Energy | 16 | $1,198B |
|
||
| Technology | 5 | $198B |
|
||
| Engineering / Construction | 4 | $72B |
|
||
| Energy Services | 3 | $60B |
|
||
| Utilities | 3 | $41B |
|
||
| Healthcare | 2 | $330B |
|
||
Price history
-11.8% since first listed14 events — show timeline
- 2026-06-19 Relisted — Zillow
- 2026-06-19 Price Changed $239,999 Zillow
- 2026-06-16 Listed $235,999 NTREIS
- 2026-06-09 Delisted — Zillow
- 2026-06-08 Relisted — Zillow
- 2026-06-08 Price Changed $235,999 Zillow
- 2026-05-03 Delisted — Zillow
- 2026-04-22 Relisted — Zillow
- 2026-04-22 Price Changed $239,999 Zillow
- 2026-03-25 Delisted — Zillow
- 2026-03-18 Relisted — Zillow
- 2026-03-17 Delisted — Zillow
- 2026-03-12 Price Changed $242,999 Zillow
- 2026-03-11 Listed $271,999 Zillow
Cash-flow waterfall
monthlySold comps — $/sqft
last 12 mo · ≤1 miLoading sold comps…